Energy Flow Sun Light Sunlight is the main


 and water into")


- Slides: 21
Energy Flow
Sun Light • Sunlight is the main energy source for all life on Earth. • What % of the sun’s energy is used by living things? • Less than 1% of all the sun’s energy that reaches the Earth is used by living things.
Producers / Autotrophs • Organisms that can produce their own food source. • Producers use sun light or chemical compounds to synthesize their own food.
Producers / Autotrophs • Only plants, some algae, & certain bacteria can capture energy from sunlight or chemicals. • Use energy from the environment to fuel the assembly of simple inorganic compounds into complex organic molecules. • These organic molecules combine to produce living tissue.
Main Autotrophs • Plants – on land • Algae – in fresh water, and the top layer of the ocean. • Cyanobacteria – wet lands and salt marshes.
Photosynthesis • Plants use sunlight to convert carbon dioxide (CO 2) and water into oxygen (O 2) and carbohydrates. • Photosynthesis is responsible for removing CO 2 from the atmosphere, and replenishing O 2.
Chemosynthesis • The conversion of energy from inorganic chemicals to organic compounds. • Chemosynthesis is performed by several types of bacteria. • These bacteria make up a large portion of autotrophs.
Consumers/Heterotrophs • Acquire their energy from other organisms. • Many diff types of heterotrophs. 1. Herbivores – eat plants 2. Carnivores – eat animals 3. Omnivores – eat both plants & animals
4. Detritivores – feed on plant and animal remains and other dead matter. - Ex. Earthworms & maggots 5. Decomposers – break down organic matter - Ex. Bacteria & fungi
Feeding Relationships • Energy flows through an ecosystem in one direction. • Energy flows from the sun or inorganic compounds to autotrophs and then to various heterotrophs.
Food Chains • A food chain is a series of steps in which organisms transfer energy by eating and being eaten.
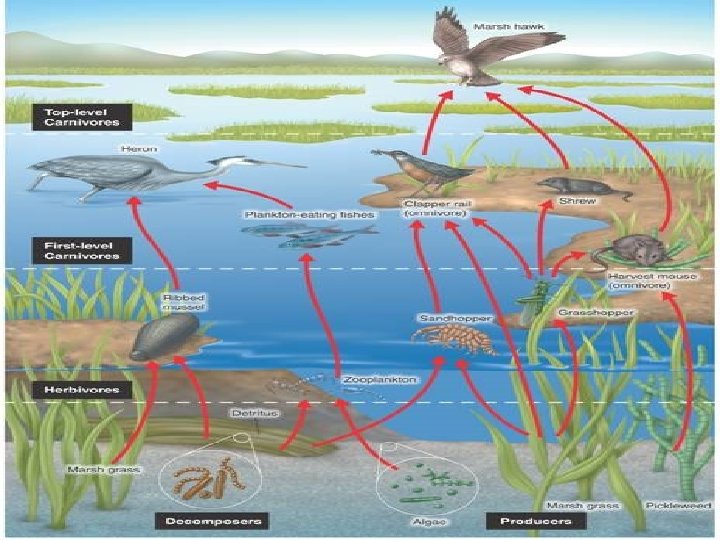
Food Web • A food web links all the food chains in an ecosystem together.
Trophic Level • Each step in a food chain or a food web is called a trophic level. • Producers make up the first trophic level. • Consumers make up the 2 nd, 3 rd, 4 th & 5 th levels. • There are rarely more than 4 or 5 levels
Ecological Pyramids • Diagrams that show the relative amounts of energy or matter contained within each trophic level.
Energy Pyramid • • Energy pyramid- shows the relative amount of energy available at each trophic level. Only about 10% of the energy available within one trophic level is transferred to organisms at the next trophic level. - This is why there are rarely more than 4 or 5 levels
http: //raxacollective. files. wordpress. com/2011/08/energy_pyramid. png
Biomass Pyramid • Represents the amount of potential food available for each trophic level. • Expressed as grams per unit area. • The greatest biomass is at the base of the pyramid.
Pyramid of numbers • Shows the relative number of individual organisms at each trophic level.