Ending the HIV Epidemic in New York City


- Slides: 16
Ending the HIV Epidemic in New York City Demetre Daskalakis MD MPH Deputy Commissioner, Disease Control New York City Department of Health and Mental Hygiene
New York State Blueprint for Ending the Epidemic • • In April 2015, Governor Andrew Cuomo released the New York State Blueprint for Ending the Epidemic, a set of recommendations by community members, government officials, and providers, expanding on his 2014 three-point plan to: Identify people with HIV who remain undiagnosed and link them to care; Link and retain people diagnosed with HIV in care to maximize virus suppression so they remain healthy and prevent further transmission; and Provide access to Pr. EP for people at high risk for HIV infection.
New York City Ending the Epidemic Plan • • • At the World AIDS Day 2015 citywide event, Mayor Bill de Blasio announced the New York City Ending the Epidemic Plan, a four-part strategy building upon the New York State Blueprint to: Increase access to HIV prevention services, including Pr. EP and PEP; Promote optimal treatment for all New Yorkers with HIV; Enhance methods for tracing HIV transmission; and Advance sexual health equity for all New Yorkers by promoting access to comprehensive, affirming sexual health care through targeted outreach to priority populations and enhancements to the Health Department’s Sexual Health Clinics. New York City became a Fast Track City in June, 2016.
HISTORY OF THE HIV EPIDEMIC IN NYC As reported to the New York City Department of Health and Mental Hygiene by March 31, 2018.
HIV/AIDS in New York City, Basic Statistics, 2017 • 2, 157 new HIV diagnoses – 25. 3 new HIV diagnoses per 100, 000 population – 1, 779 HIV without AIDS – 378 HIV concurrent with AIDS (17. 5%) • 1, 239 new AIDS diagnoses • 125, 884 persons diagnosed, reported, presumed to be living with HIV/AIDS • 1, 343 deaths among people with HIV/AIDS 1 – Age-adjusted death rate: 7. 0 per 1, 000 people with HIV/AIDS Diagnosis rate calculated using DOHMH 2016 population estimate, modified from US Census Bureau intercensal population estimates, updated September 2017. 1 Death rate age-adjusted to the NYC Census 2010 population. Death data for 2017 are incomplete. As reported to the New York City Department of Health and Mental Hygiene by March 31, 2018.
New HIV Diagnoses, NYC, 2017 80% 70% 60% 50% 40% 30% 20% 10% (1 m iu Lo w (< 10 % Hi 0 -< ) gh 20 Ve (20 %) -< ry Hi 30 gh %) (≥ 30 % ) al U xu ID ro te Transmission Risk* ed Borough He M Age se SM TG -S C an ha M n tta Q n St uee at en ns Isl an d x kly on oo Br Br 9 + 50 -4 9 40 -3 9 30 -2 0 20 <2 AP I te o hi W k ac La tin Race/ Ethnicity M Gender Bl Fe M al e m Tr an ale sg en de r 0% Poverty (area based, % below FPL) As reported to the New York City Department of Health and Mental Hygiene by March 31, 2018. *MSM=Men who have sex with men, TG-SC=Transgender people with sexual contact, IDU=People with injection drug use history
HIV Diagnosis Rates 1 among Men and Women in NYC by Race/Ethnicity 2, 2017 HIV 1 diagnosis rates 2 among 13 -59 year old males 3 by race/ethnicity 4, NYC 2017 120 105. 2 New HIV Diagnoses per 100, 000 Population 90 120 HIV 1 diagnosis rates 2 among 13 -59 year old females 3 by race/ethnicity 4, NYC 2017 90 77. 3 60 60 31. 1 30 36. 3 26. 0 30 0 AP I te hi Hispanic 2. 9 White API W Black 3. 4 La tin o/ Hi sp Bl an ac ic k 0 13. 2 API=Asian/Pacific Islander. 1 Includes diagnoses of HIV without AIDS and HIV concurrent with AIDS. 2 Rates calculated using Health Department 2016 population estimates, modified from U. S. Census Bureau intercensal population estimates, updated September 2017. 3 Includes transgender men. 4 Native American and multiracial groups not shown because of small numbers. As reported to the New York City Department of Health and Mental Hygiene by March 31, 2018.
New Diagnoses and Incidence Estimates 1 NYC, 2013 -20172 New Diagnoses of HIV Number of HIV cases 3, 500 2, 898 3, 000 2, 500 2, 800 Estimated incident HIV infections 2, 805 2, 494 2, 800 2, 276 2, 600 2, 157 2, 200 2, 000 1, 800 1, 500 1, 000 500 0 2013 1 Using 2014 2015 Year of diagnosis 2016 2017 the method in: Song R, et al. Using CD 4 data to estimate HIV incidence, prevalence, and percent of undiagnosed infections in the United States. J Acquir Immune Defic Syndr 2017; 74(1): 3 -9. 22017 incidence estimates are preliminary. As reported to the New York City Department of Health and Mental Hygiene by March 31, 2018.
Trends in estimated incident HIV infections 1 by sex at birth and transmission risk, NYC 2013 -2017 1 Using the method in: Song R, et al. , J Acquir Immune Defic Syndr 2017; 74(1): 3 -9. 22017 incidence estimates are preliminary. As reported to the New York City Department of Health and Mental Hygiene by March 31, 2018.
Proportion of new HIV diagnoses determined to be AHI, NYC, 2008 -17 Percent of HIV Diagnoses 120% 100% 80% 60% 40% 20% 0% 1. 9 3. 5 5. 2 5. 9 2008 2009 2010 2011 AHI. As reported to the New York City Department of Health and Mental Hygiene by March 31, 2018. 8. 2 9. 4 9. 6 10. 5 12. 1 13. 7 2012 2013 2014 2015 2016 2017 NON AHI
Proportion of PLWH in NYC Engaged in Selected Stages of the HIV Care Continuum, 2017 100% 80% 93% 86% 80% 74% 60% 40% 20% 0% People living with HIV/AIDS HIV-diagnosed Retained in care Prescribed ART Virally suppressed Of approximately 90, 500 PLWHA in NYC in 2017, 74% had a suppressed viral load. As reported to the New York City Department of Health and Mental Hygiene by March 31, 2018.
UNAIDS 90 -90 -90 targets for PLWH in NYC, overall and by race/ethnicity, 2017 As reported to the New York City Department of Health and Mental Hygiene by March 31, 2018.
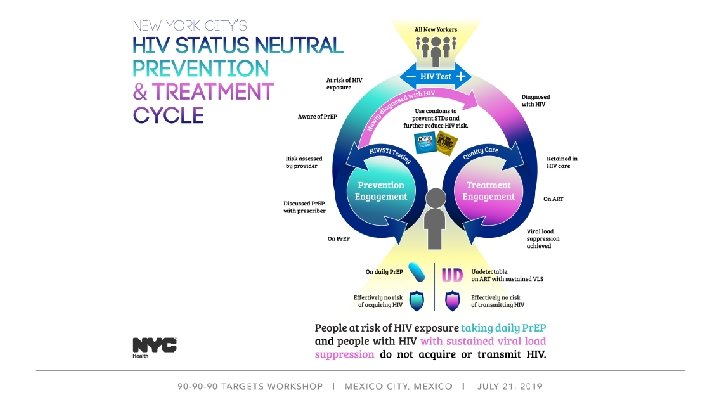
What does this all mean? • We are diagnosing prevalent HIV infections at a stable rate earlier and more efficiently – – • Decreasing incidence means that people are not getting HIV – – • Proportion of acute infections detected increasing Diagnosis at earlier stage of infection, before people get ill. 17. 5 % concurrent AIDS U=U continues to work Pr. EP in MSM is likely driving down transmission Areas we are working to improve – – Pr. EP in cis Women and TGNC People Latino MSM- ¡Listos! and more! NYC IS ON TRACK FOR 2020!
ddaskalakis@health. nyc. gov THANK YOU!