EMMREM Predicted Dose Rates for CRa TER N


; barrier to penetrations of CRs")


 averaged")


- Slides: 18
EMMREM Predicted Dose Rates for CRa. TER N. Schwadron, L. Townsend, K. Kozarev, H. Spence, M. Golightly et al.
Motivator. . GCR Dose Rate Modulation Near Earth Measurements Outside Geomagnetosphere Over Four Solar Cycles Chandrayyan LRO Thin detector dose ~ 35 km x 200 km Thick detector dose ~35 km x 200 km Thin detector dose ~50 km circular Thick detector dose ~50 km circular 100 90 80 70 4250 60 4000 50 3500 40 Apollo 15 Apollo 8 Apollo 11 3750 30 20 3250 10 2009 2007 2005 2003 2001 1999 1998 1996 1994 1992 1990 1988 1986 1984 1982 1980 1978 1976 1974 1972 1970 1968 1966 1964 1962 1960 0 1958 3000 Mission-Averages Dose Rate (mrad[Si]/d) 4500 mean CRa. TER dosimeter IP dose average Chandrayyan/RADOM 100 km circular orbit dose Apollo 16 Apollo 17 average crew skin dose average VABD depth dose average Biostack tissue dose Apollo 13 4750 1957 Thule Neutron Monitor Monthly-Averaged Count Rate (c/100/h) 5000
Modulation Potential • Modulation potential, Φ = |Z e|φ(r); barrier to penetrations of CRs • Integral in (1) extends from the inner boundary at radius r to the outer modulation boundary Rb, • Solar wind speed is V (x) and 1(x) is related to the radial diffusion coefficient, • based on fit to observed spectrum over time and species [O’Neil and Badhwar, 2006]: = 1(r) P β where P is the rigidity in GV, β is the particle speed over the speed of light, 1(r) 1 + (r/r 0)2 and r 0 = 4 AU • Reductions in modulation potential are caused by enhanced diffusion, allowing greater access and therefore higher fluxes of GCRs in the inner heliosphere
Predictions for LRO CRa. TER Computed GCR LET Spectra in Detector D 1 CREME-96: 1987. 0 J (#/s-sr-cm 2 -(ke. V/μm)) 1 E+00 SPENVIS: 1982. 5 SPENVIS: 1987 1 E-01 CREME-96: 1982. 5 1 E-02 CREME-96 GCR Flux Model and Particle Transport 1 E-03 Z = 1 to 26 No SPE contribution Emin = 0. 1 Me. V/nuc, LETmin = 0. 466 ke. V/μm Flux transported through D 1 endcap (0. 8128 mm Al) GF = 29. 97 cm 2 -sr (D 1 coincidence) 1 E-04 1 E-05 SPENVIS GCR Flux Model and Particle Transport 1 E-06 Linear Energy Transfer spectrum (CREME-86) Target material stopping power: Sil (CREME) GCR model: MSU model (ISO-15390) Z = 1 to 26 Flux transported through D 1 endcap (0. 8 mm Al) GF = 29. 97 cm 2 -sr (D 1 coincidence) 1 E-07 1 E-08 1 E-09 0, 1 1 10 100 LETSi (ke. V/μm) 10000
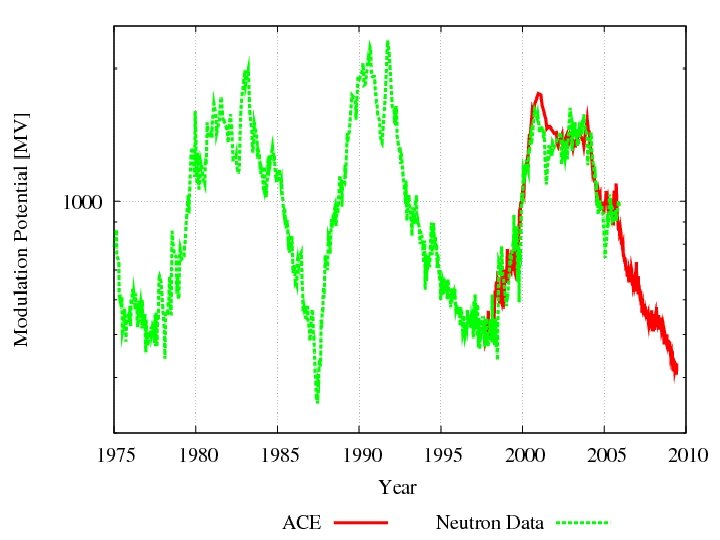
Revisions to Original Predictions • The extended solar minimum shows lowest field strengths through space age; but why isn’t the modulation potential at a minimum? – Base modulation potential on ACE and Thule Neutrons. . • Characterize modulation potential in terms of field strength (extensions back to Maunder Minimum and before) • Is there an effect of the shrinking heliopshere in the extended solar minimum?
Revised Modulation Potential
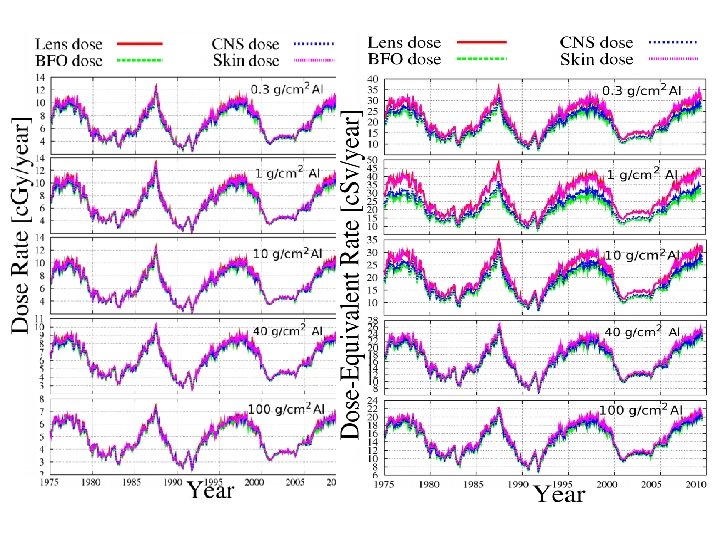
Revised Doses using Thule Neutron Monitor Data
Modulation Potential • Modulation potential, Φ, should scale with some power of the field strength or radial field strength • Motivated by recent work on the Closed flux ejected by CMEs over the solar cycle
CMEs Add Closed Flux To Heliosphere
Model for CME Injection of Closed Magnetic Flux
Correlation Between Field Strenght and Modulation Potential
Mc. Cracken and Beer, JGR, 2007 -- Annual 10 Be data (1428– 1930) averaged with binomial filter; the other data are annual averages. -- Line Cnm(LIS) estimated pseudo-Climax counting rate in the absence of any solar modulation -- Heavy lines indicate the levels of “residual modulation” during the four Gleissberg maxima. -- Arrows between 1533 and 1686 are at 22 -year intervals -- Removed Effects of long-term change in geo dipole, and prod. of 10 Be by solar cosmic rays
Derived from Cosmic Ray Record Mc. Cracken, JGR, 2007 -- Estimated annual average heliospheric magnetic field strength near Earth, 1428– 2005 -- heavy lines are estimates of the heliomagnetic floor values for the several Gleissberg cycles
Modulation Potential Paleo Record • Field strengths reduced by 5 -10 from historical record • Implications modulation potentials of 6 -20 (as opposed to 400 currently) • Need to run much smaller modulation potentials to know how bad the environment can get
Is there an Effect of the Shrinking Heliosphere? • Reduction in modulation potential more than adequately accounted for by changes in field strength • The effect of a reduction in size of heliosphere remains elusive
Takeaway • We have a story to tell with dose rate comparison – But we are missing the comparison part