Economic Growth Read Chapter 8 pages 168 182

 When a quantity grows at a given percentage rate, it experiences exponential growth.")

 Growth in per capita 1) Output per capita equals real GDP person. 2)")
 Aggregate Production 1) The aggregate")
 The Aggregate Production Function, the Market for Labor and Long Run Aggregate Supply.")
 Example 1: Consider an increase in productivity. This is an increase in the")
 Example 2: Consider an increase in labor supply. Figure 8 -8 illustrates the")
 The sources of Economic Growth. 1) Increases in")
 Explaining the Great Slowdown: Cause for Alarm? Growth in the 50’s and 60’s")
- Slides: 12
Economic Growth Read Chapter 8 pages 168 – 182 I The Significance of Economic Growth A)Basics 1)Economic Growth is the process through which an economy achieves an outward shift in its production possibilities curve. 2) In measuring economic growth we must use potential GDP and not actual GDP.
3) When a quantity grows at a given percentage rate, it experiences exponential growth. 4) The rule of 72 states that a variable’s approximate doubling time equals 72 divided by the growth rate, stated as a whole number.
B) Growth in per capita 1) Output per capita equals real GDP person. 2) Example: GDP in 1999 = $7, 759 Billion US population =272. 5 million per capita output = $28, 476. 3) % growth rate of output per capita = % growth in GDP - % growth in population
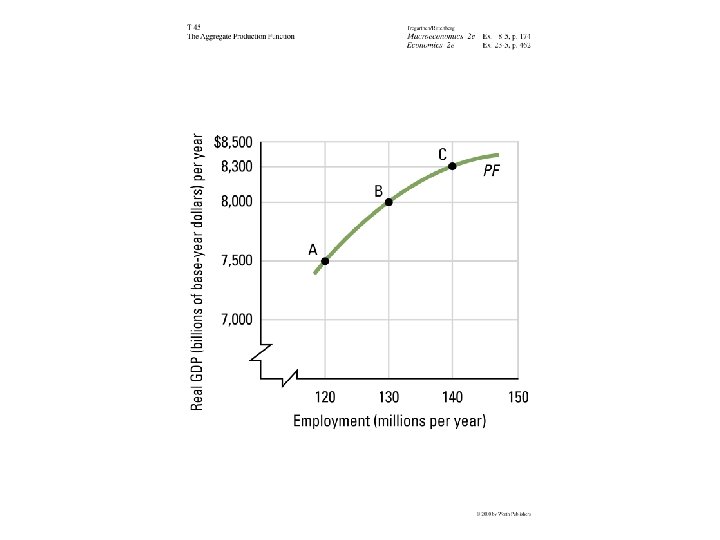
II Growth and the Long-Run Aggregate Supply Curve. A) Aggregate Production 1) The aggregate production function relates the total output of an economy to the total amount of labor employed in the economy, all other determinants of production unchanged. 2) Diminishing marginal returns occur when additional units of a variable factor add less and less to total output, given constant quantities of other factors.
B) The Aggregate Production Function, the Market for Labor and Long Run Aggregate Supply. 1) Key Point – Long Run Aggregate Supply is determined by the natural level of employment. 2) Changes in Long Run Aggregate Supply occur because of: a) changes in the aggregate production function; b) changes in labor supply. 3) Productivity is the amount of output per worker.
4) Example 1: Consider an increase in productivity. This is an increase in the production function. Figure 8 -7 illustrates the impact on the Long Run Aggregate Supply curve.
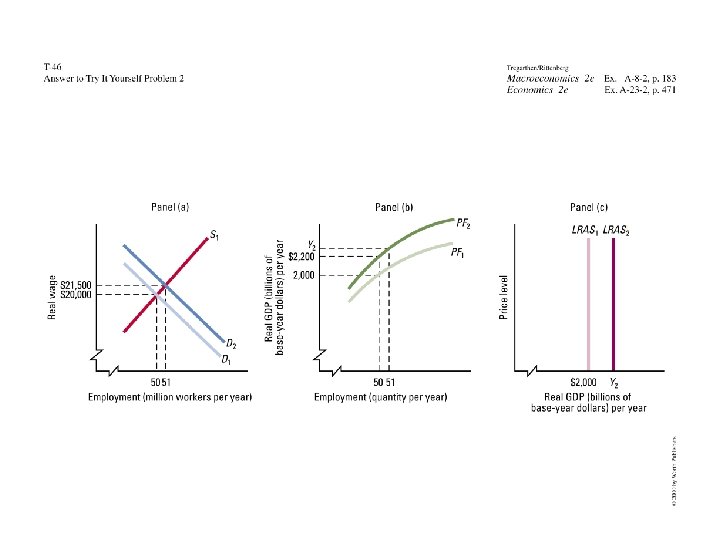
5) Example 2: Consider an increase in labor supply. Figure 8 -8 illustrates the impact on the Long Run Aggregate Supply curve. Note there is a typo in Panel (b) of Figure 88. The production function does not shift up as drawn.
III Determinants of Economic Growth. A) The sources of Economic Growth. 1) Increases in the quantity of labor. 2) Increases in the quantity of capital. 3) Increase in human capital. 4) Improved technologies. B) Note that 2)-4) involve some type of current sacrifice.
C) Explaining the Great Slowdown: Cause for Alarm? Growth in the 50’s and 60’s was significantly higher than during the 70’s and 80’s. Why? 1) Measurement errors. 2) Higher oil prices 3) Slowing Growth in Human Capital 4) Government Regulation 5) Higher inflation 6) Running out of ideas.