Economic Development of Japan No 5 Meiji 4

 Trade, Budget & Finance, Saving Mobilization •")


 • Exports to West--silk to US (60 -70%)")

/(import value) Meiji Source: Ministry of Finance Policy")

")
: until 1897 – Depreciation against Western")

 & Reparation • Japan fought and won a war against Qing")
 Note: total budget for Yahata Steel Mill was")
 n Cause: influence over Korea and Manchuria (Northeast China). Russia")
/Gross Investment Meiji Source: Ryoshin Minami, The")
 Gov’t Infrastructure Public spending Tax Agriculture Industry")
 Prof. Teranishi’s savings & investment estimates expressed in")
 % of GDP Saving/GDP")


 (% of Estimated GDP) Note:")

. However,")
- Slides: 26
Economic Development of Japan No. 5 Meiji 4 Opening of New Tokyo Stock Exchange, 1897
Macroeconomy of Late Meiji (1890 s-1900 s) Trade, Budget & Finance, Saving Mobilization • Aggressive public spending continued for militarization and industrialization, causing budget deficit and gold reserve loss. • Cotton industry succeeded in import substitution. Trade exhibited dual structure—exporting light industry goods to Asia and importing machinery from the West. • Yen initially floated down, but was fixed at $1=2 yen after joining the gold standard in 1897. • Banks and stock exchanges were set up, but main source of saving remained self-finance and joint stock companies within the private business sector. • Japan relied relatively little on FDI. But foreign bonds were issued to execute the Japan-Russia War, local public investments and budget financing.
Government was relatively small Meiji Source: Ryoshin Minami, The Economic Development of Japan, 1986.
Tax Revenue Structure Meiji Source: Management and Coordination Agency, Historical Statistics of Japan, vol. 3, Japan Statistical Association, 1988, pp. 268 -269.
Meiji PP. 60 -61 Shifts in Trade Structure Source: Ryoshin Minami, The Economic Development of Japan, 1986.
Trade Structure in Meiji (incl. colonies) • Exports to West--silk to US (60 -70%) dominated • Imports from West--machinery, steel, US raw cotton • Exports to other areas--cotton products, light industry goods (matches, umbrellas, clocks, glass products, lamp, knitted goods) • Imports from other areas--foodstuff, Indian raw cotton Trade content with developing areas & with colonies were similar Export Import Taiwan, Korea, occupied China Developing areas Europe, US Source: Y. Yamamoto & K. Oku, “Trade, ” JEH vol. 5, 1990.
Japan’s Trade Pattern Early Meiji Late Meiji Europe, US Machinery, textile products Tea, silk Japan Machinery, raw cotton (US) Japan Raw cotton (India), food Textile & light manufacturing Rest of Asia
Average Tariff Rate Calculated as (tariff revenue)/(import value) Meiji Source: Ministry of Finance Policy Research Institute, Ministry of Finance Statistics Monthly, vols. 178 (Aug. 1966), 293 (Apr. 1976), 413 (Sep. 1986), 437 (Sep. 1988), 630 (Oct. 2004) and 772 (Aug. 2016). If data do not exactly match between volumes, data in later volume are used.
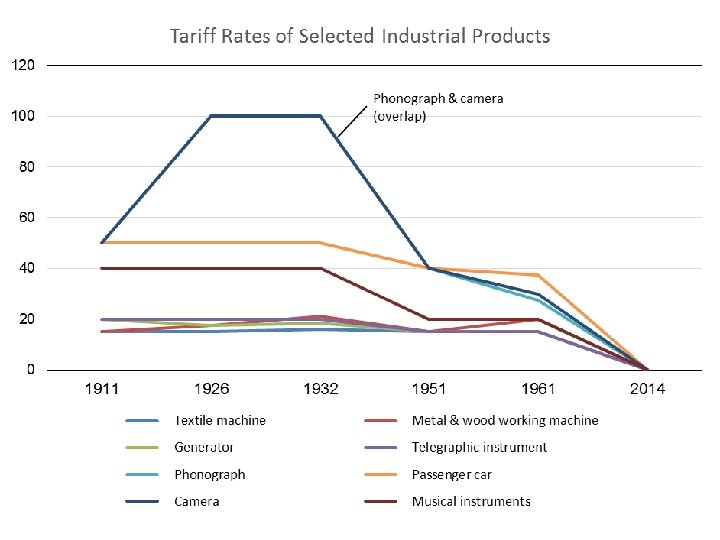
Transition of Tariff Rates of Selected Products Product Raw materials Coal Wool Cotton Light manufactures Woolen products Cotton products Artificial fiber products Leather footwear Soap Industrial inputs Artificial fiber Pig iron Steel Machinery Textile machine Metal & wood working machine Generator Telegraphic instrument Phonograph Passenger car Camera Musical instruments Tariff rate (%) 1911 1926 1932 1951 1961 2014 0 0 0 -5 0 0 0 -21 0 0 0 0 0 25 20 40 40 50 15 -20 5 100 100 8 -16 7 -27 100 100 20 10 15, 25 30 30 20 10 -15 15, 25 27 -30 5. 3 -7. 9 2. 9 -5. 6 4 -10 17. 3 -30 0 30 5 7. 5 27 4 15 75 20 15 15, 25 10 12. 5 4 -6. 6 0 0 -3. 9 15 15 20 20 50 50 50 15 15 -20 20 100 50 100 16 21 8 -29 20 100 50 100 15 15 40 40 40 15 15 -25 15 15 25 -30 35 -40 30 0 0 0 40 40 40 20 20 0
The Ratio of Nonzero Tariff Imports to Total Imports (有税品比率=有税品輸入額/輸入総額)
P. 90 Exchange Rate Regime Silver standard (float): until 1897 – Depreciation against Western currencies; East Asia (Shanghai forex market) used silver Gold standard (fix): 1897 -1917 and 1930 -31 – Adopting global standard with reparation gold from China (at the initiative of Finance Minister Matsukata) Merits of gold standard -Pride of joining the firstclass country club -No exchange risk -Ease in issuing foreign bonds Meiji Demerit? -No more depreciation
P. 103 --Due to active public spending, Japan faced BOP pressure. --Foreign bond issue can be regarded as a financing measure to avoid fiscal belt -tightening. Meiji WW 1 --Meanwhile, Japan’s gold reserves were on a declining trend in late Meiji. --Japan eventually solved the BOP crisis not by tight budget but through WW 1 export boom.
Japan-China War (189495) & Reparation • Japan fought and won a war against Qing Dynasty of China over the control of Korea (1894 -95). • After the war, Japan received from China: – Taiwan and Penghu Islands – Liaodong Peninsula (immediately forced to return to China under the pressure of Russia, Germany, France) – Reparation of 365 million yen (4 times the annual budget) • China borrowed from other countries and paid reparation in sterling-denominated checks in London • Japan held this amount in London as gold reserves • This balance was used to issue convertible paper money in Japan (establishment of gold exchange standard, 1897).
For military 83. 7% (see note) Note: total budget for Yahata Steel Mill was 6. 5 million yen, of which reparation covered 9%.
Japan-Russia War (1904 -1905) n Cause: influence over Korea and Manchuria (Northeast China). Russia gained territorial & economic concessions and kept large troops in Manchuria. Japan signed Japan-UK Alliance to deter Russia. n When the war started, few thought Japan would win. n To cover the war cost, Japan issued government bonds in London and New York. At first there were no takers, but finally the deal was done. n Battles were fought on land at sea. The fall of Russia’s Lushun Fortress and the defeat of Russia’s Baltic Fleet were decisive. n Many were surprised that a non. Western latecomer beat Whites. n Russia paid no war reparation. The Japanese government accepted this Jap. army & navy Major battles because it needed to end the war Main cities asap to avoid fiscal crisis. Main railroads
Estimated Saving Ratios Dependence on Foreign Saving =(Imports-Exports)/Gross Investment Meiji Source: Ryoshin Minami, The Economic Development of Japan, 1986.
PP. 92 -93 Foreign saving (bond issues) Gov’t Infrastructure Public spending Tax Agriculture Industry Banks Not very active Intra-sectoral financing --Self finance --Joint stock companies --Mobilizing rich merchants & producers
Gross Savings (% of estimated GDP) Prof. Teranishi’s savings & investment estimates expressed in percent of GDP Gross Investment (% of estimated GDP) Note: GDP estimate by Prof. Yamada, from Management and Coordination Agency, Historical Statistics of Japan, vol. 3, Japan Statistical Association, 1988, pp. 344 -345.
A Comparison with Vietnam Today (Nguyen Ngoc Son’s preliminary study) % of GDP Saving/GDP Business Household Government --Saving & investment rates are higher than Meiji Japan (data problem? ) --Business is a large saver & investor: internal saving mobilization of business sector (same as Meiji Japan) --Mobilization of foreign saving is large (nearly 10% of GDP) Household Investment/GDP Business Government Household (S-I)/GDP Government
Japanese Economy and Foreign Capital, 1858 -1939 Simon Bytheway, 2005 (in Japanese, Ph. D dissertation at Tohoku Gakuin Univ. ) • After 1858, foreign trading firms came, but their activities were confined to foreign settlement areas. • Japan prohibited FDI until 1899 (revision of commercial law). Even after that, policy and popular opinion remained hostile to FDI. • During Meiji period, foreign debt issue (borrowing) was much larger than FDI Share in foreign saving mobilization--gov’t bonds 82. 5%, municipal bonds 7. 8%, corporate bonds 9. 0%, FDI 0. 7% • However, FDI played important roles in some industries (see below), esp. technology transfer through patents. Ex. light bulbs: bamboo filament tungsten filament
Foreign Bond Issue of Meiji Government --Foreign bond issue was made easier by adoption of the gold standard. Other reasons were economic and legal maturity of Japan, and victories over China and Russia. --Borrowing in later period was mainly for war and deficit refinancing. Source: S. J. Bytheway (2005), pp. 106 -107
Central Government Bonds Outstanding Source: Management and Coordination Agency, Historical Statistics of Japan, vol. 3, Japan Statistical Association, 1988, pp. 278 -279.
Central Government Bonds Outstanding (Including Domestic & Foreign Bonds) (% of Estimated GDP) Note: GDP estimate by Prof. Yamada, from Management and Coordination Agency, Historical Statistics of Japan, vol. 3, Japan Statistical Association, 1988, pp. 344 -345.
Foreign Bond Issues of Municipalities Six cities borrowed abroad for building local infrastructure In addition, many public/utility companies issued corporate bonds: RR companies, banks, textile companies, power companies, etc. Source: S. J. Bytheway (2005), pp. 138 -139
Major FDI Firms in Meiji Period FDI was relatively small (cf. China, India). However, it played leading roles in tobacco, oil refining, electrical and general machinery, weapons, automobiles, glass, (aluminum). Later, zaibatsu mostly took over FDI technology and production. Source: S. J. Bytheway (2005), pp. 166 -167