Dynamical Models of Decision Making Optimality human performance


 • How do")


: – Add between-trial variance in direction of drift. •")
 Leaky Competing Accumulator Model • Addresses the process of")


 and b")
 x 1")


 RT task paradigm")


")


- Slides: 22
Dynamical Models of Decision Making Optimality, human performance, and principles of neural information processing Jay Mc. Clelland Department of Psychology and Center for Mind Brain and Computation Stanford University
How do we make a decision given a marginal stimulus?
An Abstract Statistical Theory (Random Walk or Sequential Probability Ratio Test) • How do you decide if an urn contains more black balls or white balls? – We assume you can only draw balls one at a time and want to stop as soon as you have enough evidence to achieve a desired level of accuracy. • Optimal policy: – Reach in and grab a ball – Keep track of difference between the # of black balls and # of white balls. – Respond when the difference reaches a criterion value C. – Produces fastest decisions for specified level of accuracy
The Drift Diffusion Model • Continuous version of the SPRT • At each time step a small random step is taken. • Mean direction of steps is +m for one direction, –m for the other. • When criterion is reached, respond. • Alternatively, in ‘time controlled’ tasks, respond when signal is given.
Two Problems with the DDM • The model predicts correct and incorrect RT’s will have the same distribution, but incorrect RT’s are generally slower than correct RT’s. Hard Errors RT • Accuracy should gradually improve toward ceiling levels, even for very hard discriminations, but this is not what is observed in human data. Prob. Correct Easy Correct Responses Hard -> Easy
Two Solutions • Ratcliff (1978): – Add between-trial variance in direction of drift. • Usher & Mc. Clelland (2001): – Consider effects of leakage and competition between evidence ‘accumulators’. – The idea is based on properties of populations of neurons. • Populations tend to compete • Activity tends to decay away Selected Activation of neurons responsive to Selected vs. non-selected target from Chelazzi et al (1993)
Usher and Mc. Clelland (2001) Leaky Competing Accumulator Model • Addresses the process of deciding between two alternatives based on external input (r 1 + r 2 = 1) with leakage, self-excitation, mutual inhibition, and noise dx 1/dt = r 1 -l(x 1)+af(x 1)–bf(x 2)+x 1 dx 2/dt = r 2 -l(x 2)+af(x 2)–bf(x 1)+x 2 • Captures u-shaped activity profile for loosing alternative seen in experiments. • Matches accuracy data and RT distribution shape as a function of ease of discrimination. • Easily extends to n alternatives, models effects of n or RT.
Discussion of assumptions • Units represent populations of neurons, not single neurons – rate corresponds to instantaneous population firing rate. • Activation function is chosen to be non-linear but simple (f = []+). Other choices allow additional properties (Wong and Wang, next lecture). • Decay represents tendency of neurons to return to their resting level. • Self-excitation ~ recurrent excitatory interactions among members of the population. • In general, neurons tend to decay quite quickly; the effective decay is equal to decay - self-excitation • (In reality competition is mediated by interneurons. ) • Injected noise is independent but propagates non-linearly.
Testing between the models • Quantitative test: – Differences in shapes of ‘time-accuracy curves’ – Use of analytic approximation – Many subsequent comparisons by Ratcliff • Qualitative test: – Understanding the dynamics of the model leads to novel predictions
Roles of (k = l – a) and b
Change of Coordinates (Bogacz et al, 2006) x 1
Time-accuracy curves for different |k -b| |k-b| = 0 |k-b| =. 2 |k-b| =. 4
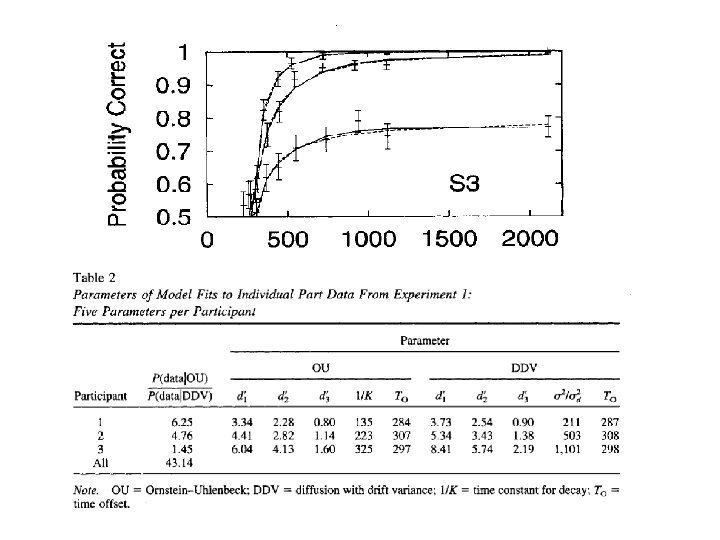
Assessing Integration Dynamics • • Participant sees stream of S’s and H’s Must decide which is predominant 50% of trials last ~500 msec, allow accuracy assessment 50% are ~250 msec, allow assessment of dynamics – Equal # of S’s and H’s But there are clusters bunched together at the end (0, 2 or 4). Leak-dominant Inhibition-dom. Favored early Favored late
Subjects show both kinds of biases; the less the bias, the higher the accuracy, as predicted. S 3
Extension to N alternatives • Extension to n alternatives is very natural (just add units to pool). • Model accounts quite well for Hick’s law (RT increases with log n alternatives), assuming that threshold is raised with n to maintain equal accuracy in all conditions. • Use of non-linear activation function increases efficiency in cases where there are only a few alternatives ‘in contention’ given the stimulus.
Neural Basis of Decision Making in Monkeys (Roitman & Shadlen, 2002) RT task paradigm of R&T. Motion coherence and direction is varied from trial to trial.
Neural Basis of Decision Making in Monkeys: Results Data are averaged over many different neurons that are associated with intended eye movements to the location of target.
Neural Activity and Low-Dimensional Models • Human behavior is often characterized by simple regularities at an overt level, yet this simplicity arises from a highly complex underlying neural mechanism. • Can we understand how these simple regularities could arise?
Wong & Wang (2006)
7200 - and 2 -variable Models both account for the behavioral data … and the physiological data as well!
Some Extensions • Usher & Mc. Clelland, 2004 – Leaky competing accumulator model with • Vacillation of attention between attributes • Loss aversion – Accounts for several violations of rationality in choosing among multiple alternatives differing on multiple dimensions. – Makes predictions for effects of parametric manipulations, some of which have been supported in further experiments. • Future work – Effects of involuntary attention – Combined effects of outcome value and stimulus uncertainty on choice