DRAFT Central Thistlemoor PCN Data pack August 2019




- Slides: 18
DRAFT Central Thistlemoor PCN Data pack August 2019
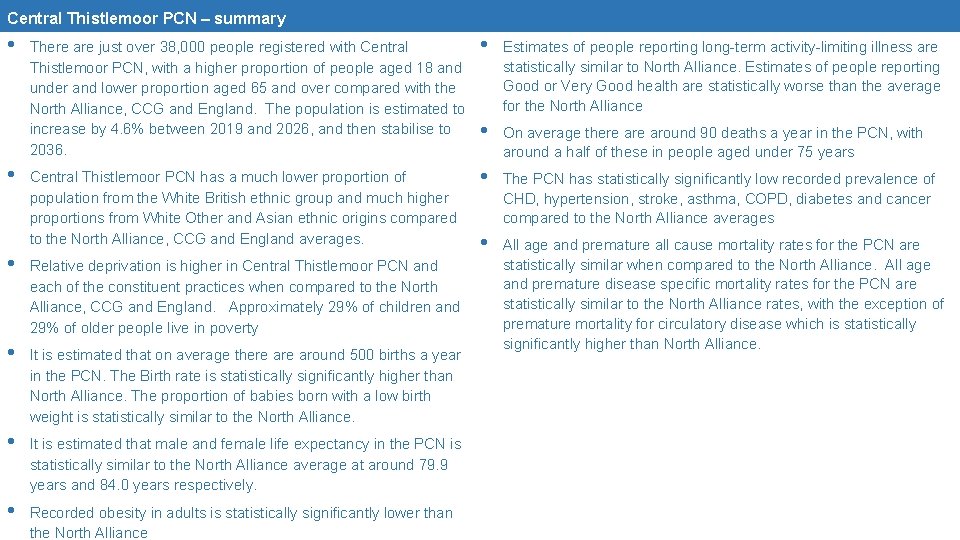
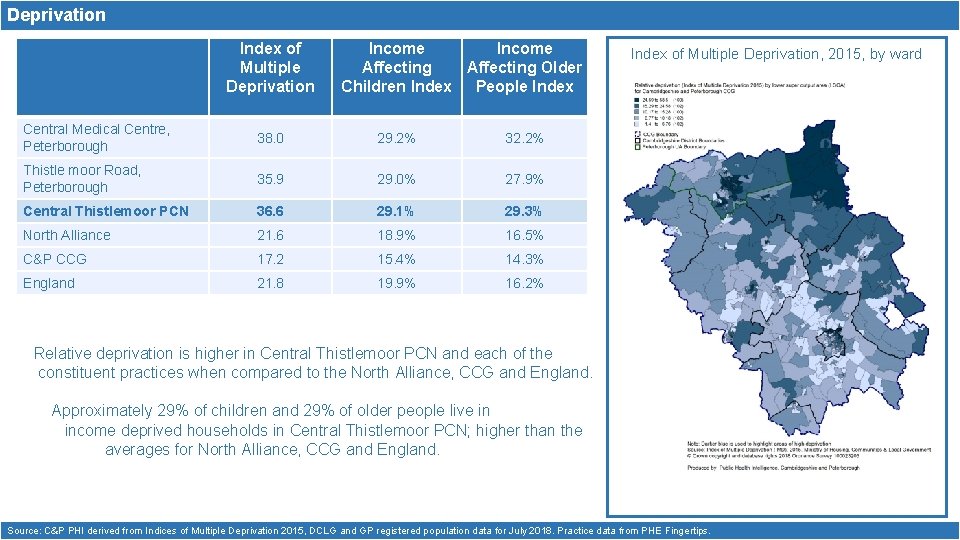
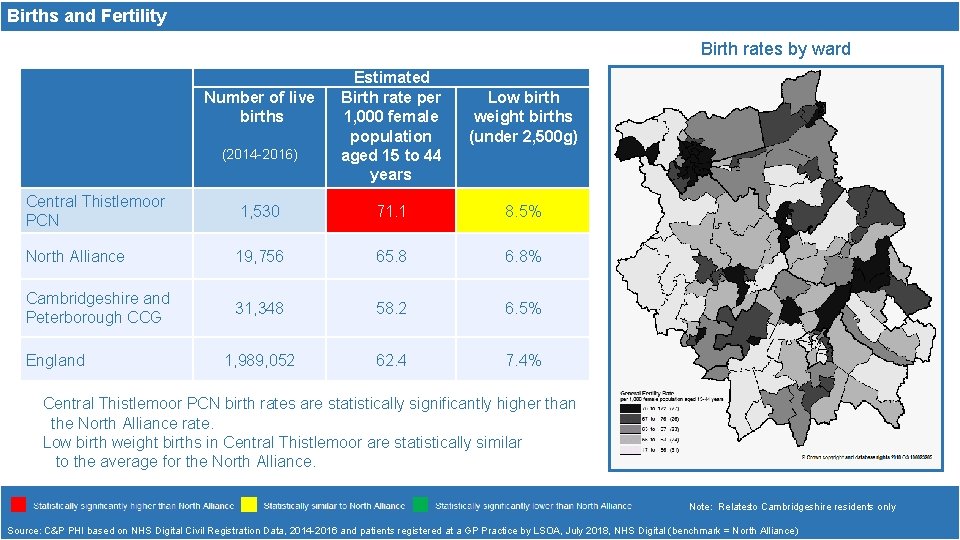
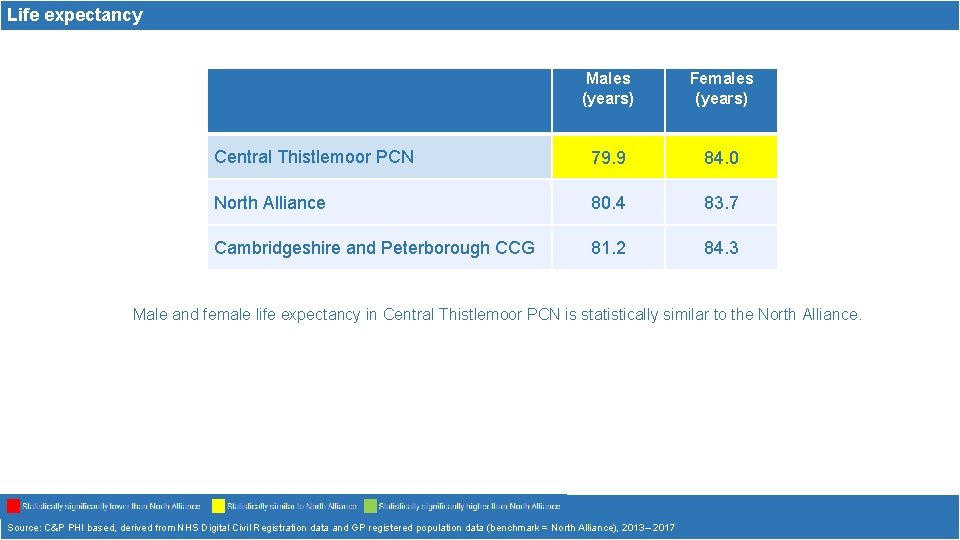
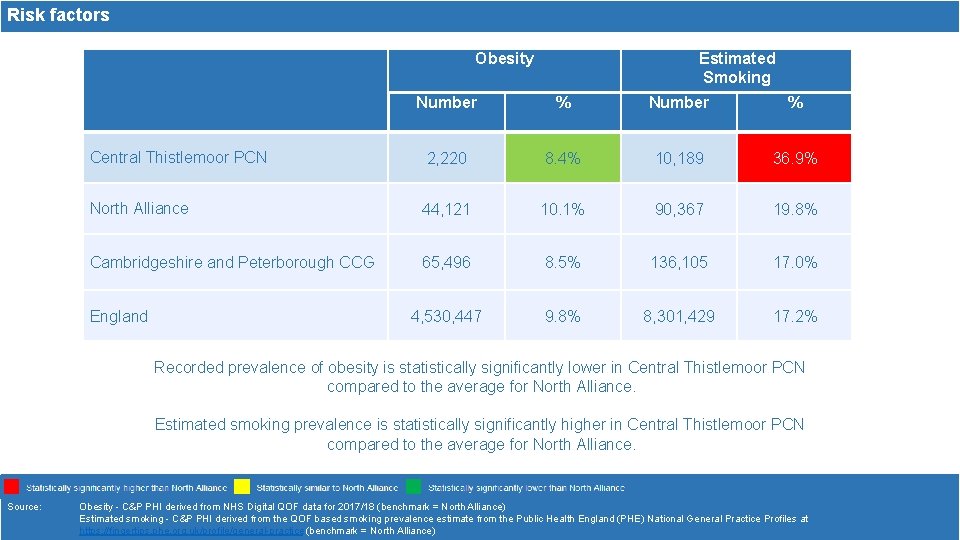
Central Thistlemoor PCN – summary • • There are just over 38, 000 people registered with Central Thistlemoor PCN, with a higher proportion of people aged 18 and under and lower proportion aged 65 and over compared with the North Alliance, CCG and England. The population is estimated to increase by 4. 6% between 2019 and 2026, and then stabilise to 2036. Central Thistlemoor PCN has a much lower proportion of population from the White British ethnic group and much higher proportions from White Other and Asian ethnic origins compared to the North Alliance, CCG and England averages. • Relative deprivation is higher in Central Thistlemoor PCN and each of the constituent practices when compared to the North Alliance, CCG and England. Approximately 29% of children and 29% of older people live in poverty • It is estimated that on average there around 500 births a year in the PCN. The Birth rate is statistically significantly higher than North Alliance. The proportion of babies born with a low birth weight is statistically similar to the North Alliance. • It is estimated that male and female life expectancy in the PCN is statistically similar to the North Alliance average at around 79. 9 years and 84. 0 years respectively. • Recorded obesity in adults is statistically significantly lower than the North Alliance • Estimates of people reporting long-term activity-limiting illness are statistically similar to North Alliance. Estimates of people reporting Good or Very Good health are statistically worse than the average for the North Alliance • On average there around 90 deaths a year in the PCN, with around a half of these in people aged under 75 years • The PCN has statistically significantly low recorded prevalence of CHD, hypertension, stroke, asthma, COPD, diabetes and cancer compared to the North Alliance averages • All age and premature all cause mortality rates for the PCN are statistically similar when compared to the North Alliance. All age and premature disease specific mortality rates for the PCN are statistically similar to the North Alliance rates, with the exception of premature mortality for circulatory disease which is statistically significantly higher than North Alliance.
Demography
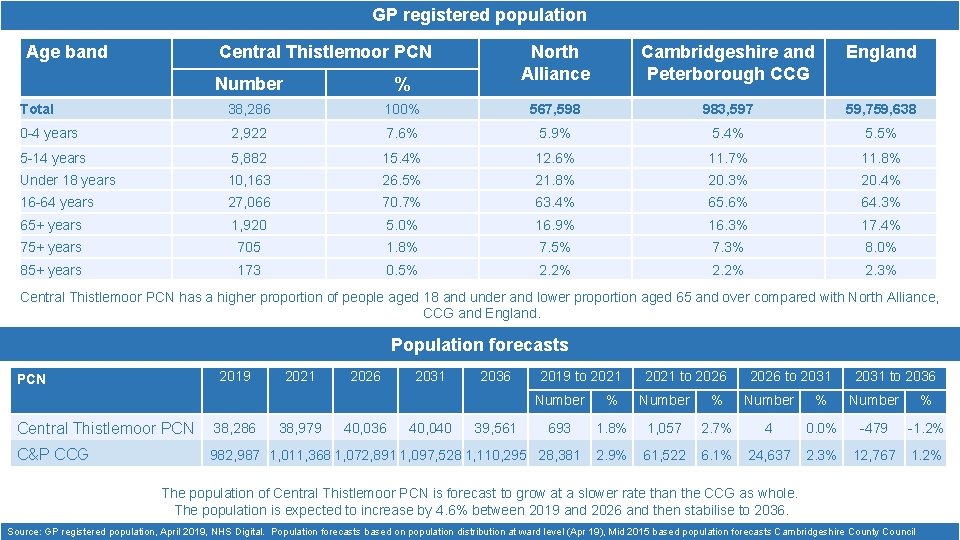
GP registered population Age band Central Thistlemoor PCN North Alliance Cambridgeshire and Peterborough CCG England Number % Total 38, 286 100% 567, 598 983, 597 59, 759, 638 0 -4 years 2, 922 7. 6% 5. 9% 5. 4% 5. 5% 5 -14 years 5, 882 15. 4% 12. 6% 11. 7% 11. 8% Under 18 years 10, 163 26. 5% 21. 8% 20. 3% 20. 4% 16 -64 years 27, 066 70. 7% 63. 4% 65. 6% 64. 3% 65+ years 1, 920 5. 0% 16. 9% 16. 3% 17. 4% 75+ years 705 1. 8% 7. 5% 7. 3% 8. 0% 85+ years 173 0. 5% 2. 2% 2. 3% Central Thistlemoor PCN has a higher proportion of people aged 18 and under and lower proportion aged 65 and over compared with North Alliance, CCG and England. Population forecasts 2019 PCN 2021 2026 2031 2036 2019 to 2021 Number % 693 1. 8% 1, 057 2. 7% 4 0. 0% -479 -1. 2% 2. 9% 61, 522 6. 1% 24, 637 2. 3% 12, 767 1. 2% C&P CCG 982, 987 1, 011, 368 1, 072, 891 1, 097, 528 1, 110, 295 28, 381 40, 040 39, 561 2031 to 2036 % 38, 286 40, 036 2026 to 2031 Number Central Thistlemoor PCN 38, 979 2021 to 2026 The population of Central Thistlemoor PCN is forecast to grow at a slower rate than the CCG as whole. The population is expected to increase by 4. 6% between 2019 and 2026 and then stabilise to 2036. Source: GP registered population, April 2019, NHS Digital. Population forecasts based on population distribution at ward level (Apr 19), Mid 2015 based population forecasts Cambridgeshire County Council
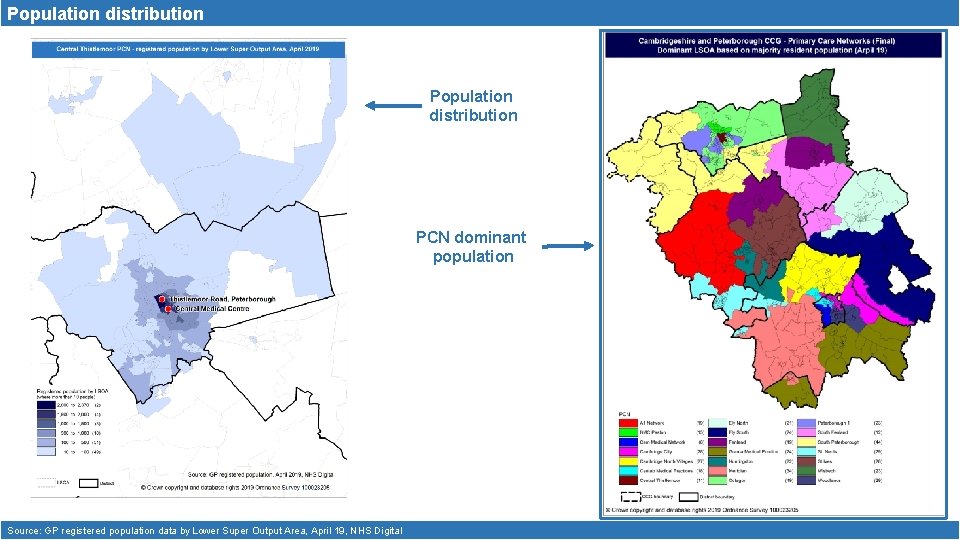
Population distribution PCN dominant population Source: GP registered population data by Lower Super Output Area, April 19, NHS Digital
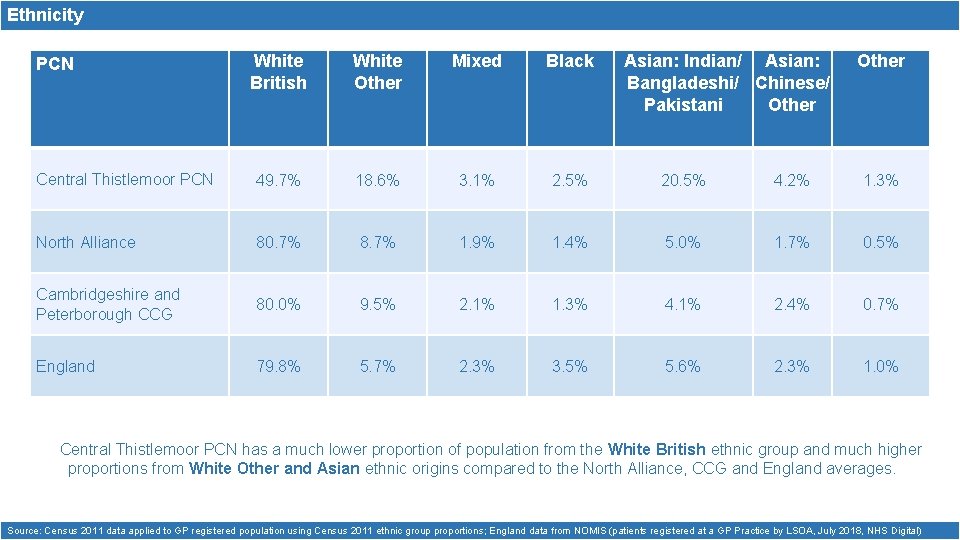
Ethnicity White British White Other Mixed Black Central Thistlemoor PCN 49. 7% 18. 6% 3. 1% 2. 5% 20. 5% 4. 2% 1. 3% North Alliance 80. 7% 8. 7% 1. 9% 1. 4% 5. 0% 1. 7% 0. 5% Cambridgeshire and Peterborough CCG 80. 0% 9. 5% 2. 1% 1. 3% 4. 1% 2. 4% 0. 7% England 79. 8% 5. 7% 2. 3% 3. 5% 5. 6% 2. 3% 1. 0% PCN Asian: Indian/ Asian: Bangladeshi/ Chinese/ Pakistani Other Central Thistlemoor PCN has a much lower proportion of population from the White British ethnic group and much higher proportions from White Other and Asian ethnic origins compared to the North Alliance, CCG and England averages. Source: Census 2011 data applied to GP registered population using Census 2011 ethnic group proportions; England data from NOMIS (patients registered at a GP Practice by LSOA, July 2018, NHS Digital)
Deprivation Index of Multiple Deprivation Income Affecting Older Children Index People Index Central Medical Centre, Peterborough 38. 0 29. 2% 32. 2% Thistle moor Road, Peterborough 35. 9 29. 0% 27. 9% Central Thistlemoor PCN 36. 6 29. 1% 29. 3% North Alliance 21. 6 18. 9% 16. 5% C&P CCG 17. 2 15. 4% 14. 3% England 21. 8 19. 9% 16. 2% Index of Multiple Deprivation, 2015, by ward Relative deprivation is higher in Central Thistlemoor PCN and each of the constituent practices when compared to the North Alliance, CCG and England. Approximately 29% of children and 29% of older people live in income deprived households in Central Thistlemoor PCN; higher than the averages for North Alliance, CCG and England. Source: C&P PHI derived from Indices of Multiple Deprivation 2015, DCLG and GP registered population data for July 2018. Practice data from PHE Fingertips.
Births and Fertility Birth rates by ward Number of live births (2014 -2016) Estimated Birth rate per 1, 000 female population aged 15 to 44 years Low birth weight births (under 2, 500 g) Central Thistlemoor PCN 1, 530 71. 1 8. 5% North Alliance 19, 756 65. 8 6. 8% Cambridgeshire and Peterborough CCG 31, 348 58. 2 6. 5% 1, 989, 052 62. 4 7. 4% England Central Thistlemoor PCN birth rates are statistically significantly higher than the North Alliance rate. Low birth weight births in Central Thistlemoor are statistically similar to the average for the North Alliance. Note: Relates to Cambridgeshire residents only Source: C&P PHI based on NHS Digital Civil Registration Data, 2014 -2016 and patients registered at a GP Practice by LSOA, July 2018, NHS Digital (benchmark = North Alliance)
Life expectancy Males (years) Females (years) Central Thistlemoor PCN 79. 9 84. 0 North Alliance 80. 4 83. 7 Cambridgeshire and Peterborough CCG 81. 2 84. 3 Male and female life expectancy in Central Thistlemoor PCN is statistically similar to the North Alliance. Source: C&P PHI based, derived from NHS Digital Civil Registration data and GP registered population data (benchmark = North Alliance), 2013 – 2017
Risk factors
Risk factors Obesity Estimated Smoking Number % Central Thistlemoor PCN 2, 220 8. 4% 10, 189 36. 9% North Alliance 44, 121 10. 1% 90, 367 19. 8% Cambridgeshire and Peterborough CCG 65, 496 8. 5% 136, 105 17. 0% 4, 530, 447 9. 8% 8, 301, 429 17. 2% England Recorded prevalence of obesity is statistically significantly lower in Central Thistlemoor PCN compared to the average for North Alliance. Estimated smoking prevalence is statistically significantly higher in Central Thistlemoor PCN compared to the average for North Alliance. Source: Obesity - C&P PHI derived from NHS Digital QOF data for 2017/18 (benchmark = North Alliance) Estimated smoking - C&P PHI derived from the QOF based smoking prevalence estimate from the Public Health England (PHE) National General Practice Profiles at https: //fingertips. phe. org. uk/profile/general-practice (benchmark = North Alliance)
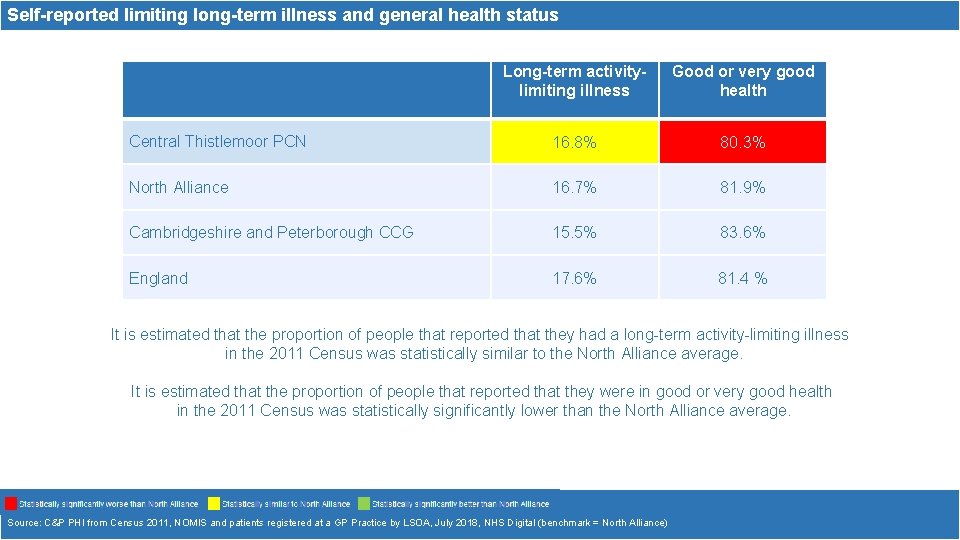
Self-reported limiting long-term illness and general health status Long-term activitylimiting illness Good or very good health Central Thistlemoor PCN 16. 8% 80. 3% North Alliance 16. 7% 81. 9% Cambridgeshire and Peterborough CCG 15. 5% 83. 6% England 17. 6% 81. 4 % It is estimated that the proportion of people that reported that they had a long-term activity-limiting illness in the 2011 Census was statistically similar to the North Alliance average. It is estimated that the proportion of people that reported that they were in good or very good health in the 2011 Census was statistically significantly lower than the North Alliance average. Source: C&P PHI from Census 2011, NOMIS and patients registered at a GP Practice by LSOA, July 2018, NHS Digital (benchmark = North Alliance)
Diseases
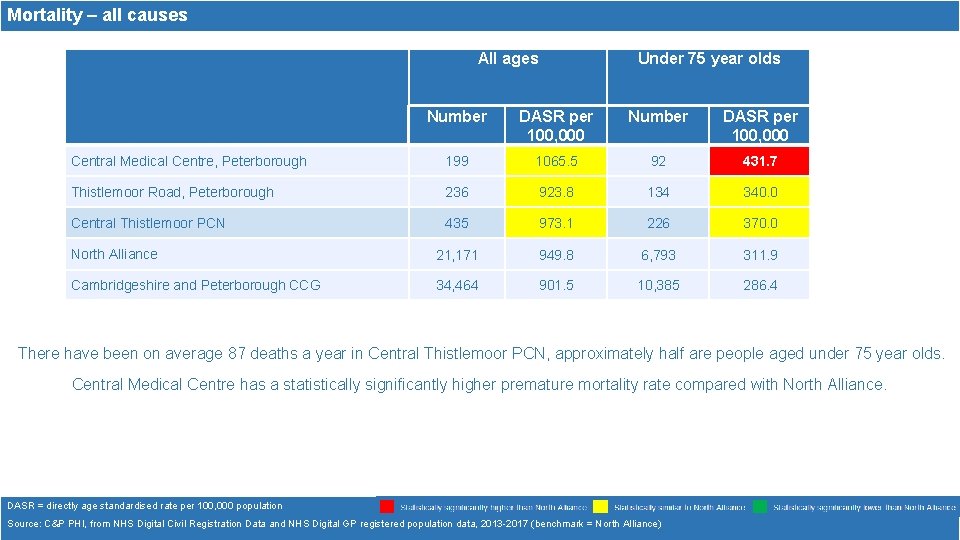
Mortality – all causes All ages Under 75 year olds Number DASR per 100, 000 Central Medical Centre, Peterborough 199 1065. 5 92 431. 7 Thistlemoor Road, Peterborough 236 923. 8 134 340. 0 Central Thistlemoor PCN 435 973. 1 226 370. 0 North Alliance 21, 171 949. 8 6, 793 311. 9 Cambridgeshire and Peterborough CCG 34, 464 901. 5 10, 385 286. 4 There have been on average 87 deaths a year in Central Thistlemoor PCN, approximately half are people aged under 75 year olds. Central Medical Centre has a statistically significantly higher premature mortality rate compared with North Alliance. DASR = directly age standardised rate per 100, 000 population Source: C&P PHI, from NHS Digital Civil Registration Data and NHS Digital GP registered population data, 2013 -2017 (benchmark = North Alliance)
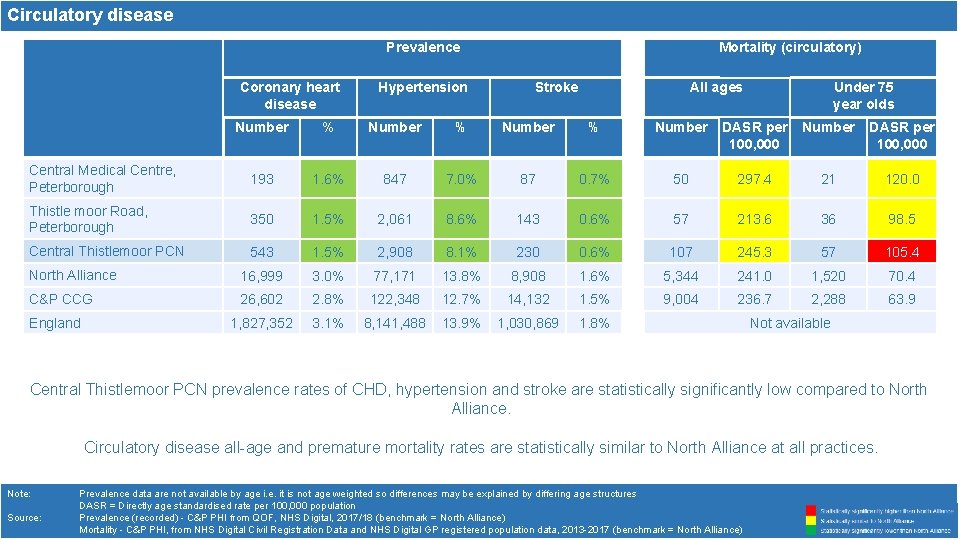
Circulatory disease Prevalence Coronary heart disease Hypertension Mortality (circulatory) Stroke All ages Under 75 year olds Number % Number DASR per 100, 000 Central Medical Centre, Peterborough 193 1. 6% 847 7. 0% 87 0. 7% 50 297. 4 21 120. 0 Thistle moor Road, Peterborough 350 1. 5% 2, 061 8. 6% 143 0. 6% 57 213. 6 36 98. 5 Central Thistlemoor PCN 543 1. 5% 2, 908 8. 1% 230 0. 6% 107 245. 3 57 105. 4 North Alliance 16, 999 3. 0% 77, 171 13. 8% 8, 908 1. 6% 5, 344 241. 0 1, 520 70. 4 C&P CCG 26, 602 2. 8% 122, 348 12. 7% 14, 132 1. 5% 9, 004 236. 7 2, 288 63. 9 1, 827, 352 3. 1% 8, 141, 488 13. 9% 1, 030, 869 1. 8% England Not available Central Thistlemoor PCN prevalence rates of CHD, hypertension and stroke are statistically significantly low compared to North Alliance. Circulatory disease all-age and premature mortality rates are statistically similar to North Alliance at all practices. Note: Prevalence data are not available by age i. e. it is not age weighted so differences may be explained by differing age structures DASR = Directly age standardised rate per 100, 000 population Source: Prevalence (recorded) - C&P PHI from QOF, NHS Digital, 2017/18 (benchmark = North Alliance) Mortality - C&P PHI, from NHS Digital Civil Registration Data and NHS Digital GP registered population data, 2013 -2017 (benchmark = North Alliance)
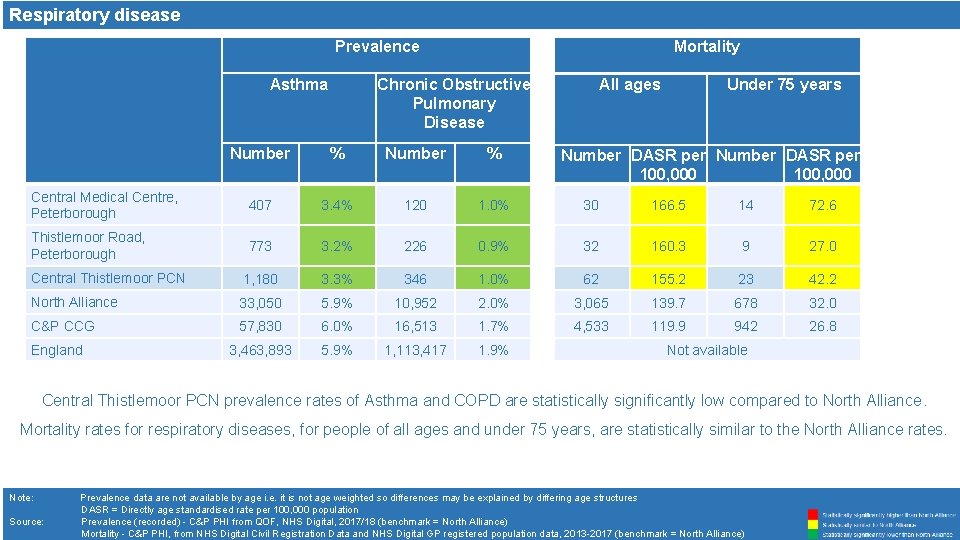
Respiratory disease Prevalence Asthma Mortality Chronic Obstructive Pulmonary Disease All ages Under 75 years Number % Central Medical Centre, Peterborough 407 3. 4% 120 1. 0% 30 166. 5 14 72. 6 Thistlemoor Road, Peterborough 773 3. 2% 226 0. 9% 32 160. 3 9 27. 0 Central Thistlemoor PCN 1, 180 3. 3% 346 1. 0% 62 155. 2 23 42. 2 North Alliance 33, 050 5. 9% 10, 952 2. 0% 3, 065 139. 7 678 32. 0 C&P CCG 57, 830 6. 0% 16, 513 1. 7% 4, 533 119. 9 942 26. 8 3, 463, 893 5. 9% 1, 113, 417 1. 9% England Number DASR per 100, 000 Not available Central Thistlemoor PCN prevalence rates of Asthma and COPD are statistically significantly low compared to North Alliance. Mortality rates for respiratory diseases, for people of all ages and under 75 years, are statistically similar to the North Alliance rates. Note: Prevalence data are not available by age i. e. it is not age weighted so differences may be explained by differing age structures DASR = Directly age standardised rate per 100, 000 population Source: Prevalence (recorded) - C&P PHI from QOF, NHS Digital, 2017/18 (benchmark = North Alliance) Mortality - C&P PHI, from NHS Digital Civil Registration Data and NHS Digital GP registered population data, 2013 -2017 (benchmark = North Alliance)
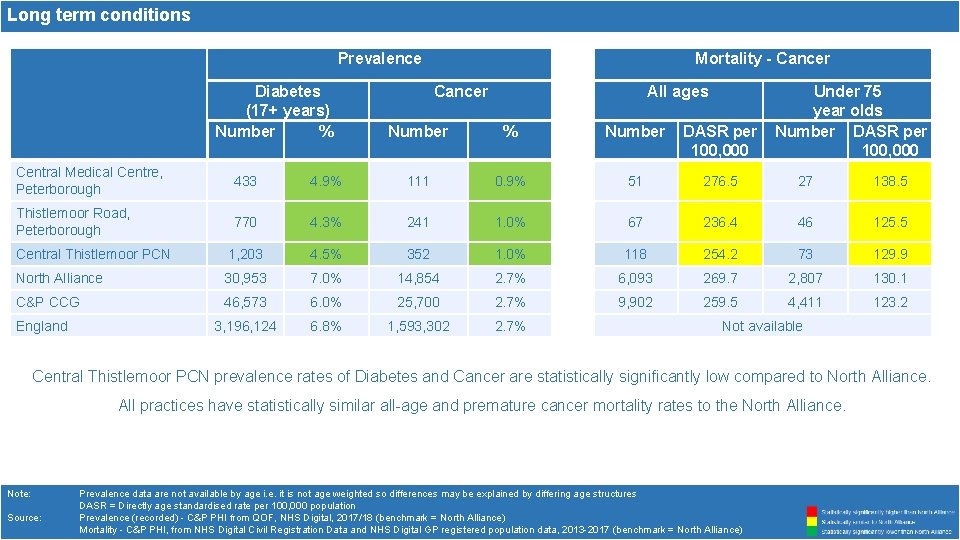
Long term conditions Prevalence Diabetes (17+ years) Number % Mortality - Cancer All ages Number % Number DASR per 100, 000 Under 75 year olds Number DASR per 100, 000 Central Medical Centre, Peterborough 433 4. 9% 111 0. 9% 51 276. 5 27 138. 5 Thistlemoor Road, Peterborough 770 4. 3% 241 1. 0% 67 236. 4 46 125. 5 Central Thistlemoor PCN 1, 203 4. 5% 352 1. 0% 118 254. 2 73 129. 9 North Alliance 30, 953 7. 0% 14, 854 2. 7% 6, 093 269. 7 2, 807 130. 1 C&P CCG 46, 573 6. 0% 25, 700 2. 7% 9, 902 259. 5 4, 411 123. 2 3, 196, 124 6. 8% 1, 593, 302 2. 7% England Not available Central Thistlemoor PCN prevalence rates of Diabetes and Cancer are statistically significantly low compared to North Alliance. All practices have statistically similar all-age and premature cancer mortality rates to the North Alliance. Note: Prevalence data are not available by age i. e. it is not age weighted so differences may be explained by differing age structures DASR = Directly age standardised rate per 100, 000 population Source: Prevalence (recorded) - C&P PHI from QOF, NHS Digital, 2017/18 (benchmark = North Alliance) Mortality - C&P PHI, from NHS Digital Civil Registration Data and NHS Digital GP registered population data, 2013 -2017 (benchmark = North Alliance)
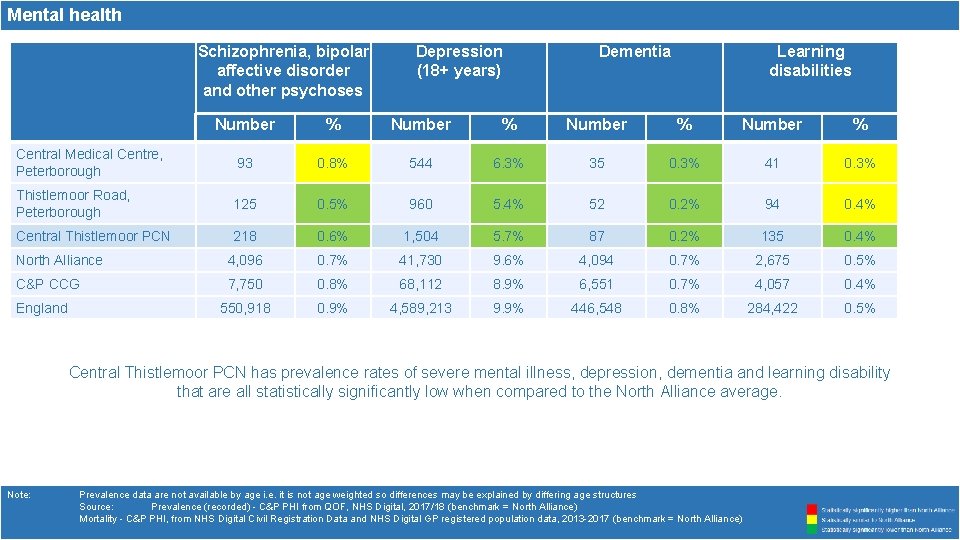
Mental health Schizophrenia, bipolar affective disorder and other psychoses Depression (18+ years) Dementia Learning disabilities Number % Central Medical Centre, Peterborough 93 0. 8% 544 6. 3% 35 0. 3% 41 0. 3% Thistlemoor Road, Peterborough 125 0. 5% 960 5. 4% 52 0. 2% 94 0. 4% Central Thistlemoor PCN 218 0. 6% 1, 504 5. 7% 87 0. 2% 135 0. 4% North Alliance 4, 096 0. 7% 41, 730 9. 6% 4, 094 0. 7% 2, 675 0. 5% C&P CCG 7, 750 0. 8% 68, 112 8. 9% 6, 551 0. 7% 4, 057 0. 4% 550, 918 0. 9% 4, 589, 213 9. 9% 446, 548 0. 8% 284, 422 0. 5% England Central Thistlemoor PCN has prevalence rates of severe mental illness, depression, dementia and learning disability that are all statistically significantly low when compared to the North Alliance average. Note: Prevalence data are not available by age i. e. it is not age weighted so differences may be explained by differing age structures Source: Prevalence (recorded) - C&P PHI from QOF, NHS Digital, 2017/18 (benchmark = North Alliance) Mortality - C&P PHI, from NHS Digital Civil Registration Data and NHS Digital GP registered population data, 2013 -2017 (benchmark = North Alliance)