DOMESTIC POLICY SOCIAL WELFARE Social Welfare Policies Provide


 vs. Cyclical/Structural Poverty (“Undeserving Poor”)")


? • • Increase Payroll Taxes Decrease benefits for recipients Increase age at which")

- Slides: 24
DOMESTIC POLICY SOCIAL WELFARE
Social Welfare Policies • Provide benefits to individuals • Based on either Entitlement (regardless of need; Social Security/Medicare) or Means. Tested programs (based on need; Food Stamps or Medicaid)
Means-Tested Programs • Controversial due to philosophical differences • Deserving Poor vs. Undeserving Poor • Social Darwinism vs. Cyclical / Structural Poverty
Income Distribution: describes how the national income is divided
• Relative Deprivation: perception by an individual that they are not doing well economically in comparison to others • Income: amount of money collected between two points in time • Wealth: Value of all assets owned (stocks, bonds, bank accounts, cars, houses, etc. ) – 1/3 of wealth held by 1%, – 1/3 by next 9%, – remaining 1/3 by the other 90%
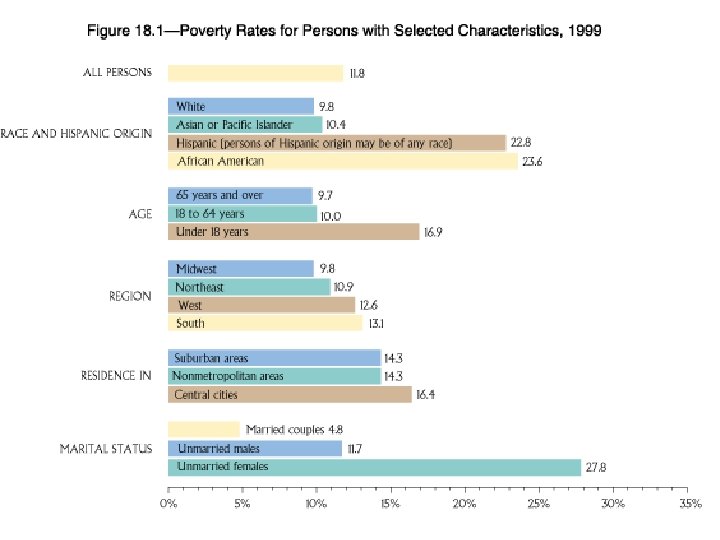
Poverty Line • Income threshold below which people are considered poor • 1 person = 11, 170 • 4 persons = 23, 050 • 43. 6 million, about 14. 3%, officially poor in 2009 • ‘Feminization of Poverty’: increasing concentration of poverty among women
Gov’t. ’s Affect on Income • Government can affect income via two ways: –Taxation & Expenditures
TAXATION • • Progressive Tax: bigger % from rich Proportional Tax: same % from all Regressive Tax: bigger % from poor Earned Income Tax Credit (EITC): refundable credit for working people who earn low incomes
EXPENDITURES • Transfer Payments: benefits directly to individuals – cash, food stamps, low % loans
Evolution of “Welfare State” • 1789 -1935: parents care for children who take care of parents as they age • 1935: Social Security Act created as part of FDR’s New Deal – $ for retired, disabled – Aid for Families with Dependent Children (AFDC) • 1964: LBJ’s “War on Poverty” – Medicare/Medicaid
• 1980’s: De-funding of social welfare programs under Reagan • 1996: Welfare Reform Act, WJ Clinton – Must find work within 2 years – Total of 5 years welfare – AFDC changes to TANF (“Temporary Assistance for Needy Families”)
Political Conflict • Social Darwinism/dependency (“Deserving Poor”) vs. Cyclical/Structural Poverty (“Undeserving Poor”)
• Americans tend to see welfare recipients as overwhelmingly African-American, lazy, and undeserving • Feelings on race affect feelings on welfare • Media portrays recipients as minority when majority are White
Source: Census Bureau - Table H-3, 2010
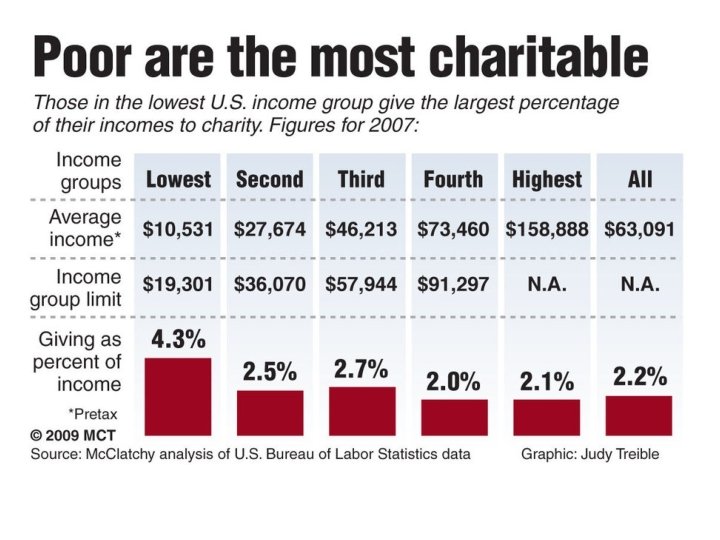
What percent in taxes does each pay after paying for basic necessities like food and shelter, rather than total income?
If you subtract this $2, 000 a month or $24, 000 per year from the various quintiles' incomes, the following pretax disposable incomes result:
And here are the actual average taxes paid by quintile:
And so, here are the tax percentages that each quintile actually pays as a percent of their true disposable incomes, assuming everyone needs at least $2, 000 a month just to get by:
SOCIAL SECURITY • • Trust Fund: $ in to pay current recipients 12. 4% tax up to $102, 000 6. 2% paid by employee 6. 2% paid by employer
INSOLVENCY • Life expectancy: 1935 = < 65; 2009 = >78 • Baby Boom = fewer workers-to-recipients ratio • Fund has been ‘raided’ over the years to pay for other programs
SOLUTION(S)? • • Increase Payroll Taxes Decrease benefits for recipients Increase age at which benefits are received Means-Testing recipients
Efficacy of Groups re: Social Welfare Policymaking • Elderly: well-organized with a high amount of resources = effective • Poor: vote less, less money, fewer organizations = less effective