Development and Application of Geostatistical Methods to Modeling


 linear model deterministic component = m(x) stochastic component")
 = m(x) + e(x)")
 • • • Elevation Slope Radiation Shelter Drift = m(x) +")

? trend model variogram model unknowns")


 Variogram model 1 (exponential variogram) Trend model")
 = m(x) + e(x) Optimized Coefficients")
![Deterministic Snow Depth Maps Constant Snow depth [m] 0 Linear 5 Nonlinear 10](https://slidetodoc.com/presentation_image/33c3e266c9943db2646f8c8ef9ad71a0/image-20.jpg "Deterministic Snow Depth Maps Constant Snow depth [m] 0 Linear 5 Nonlinear 10")
 = m(x) + e(x)")


 Regression Tree Model Winstral et al. (2002)")

- Slides: 25
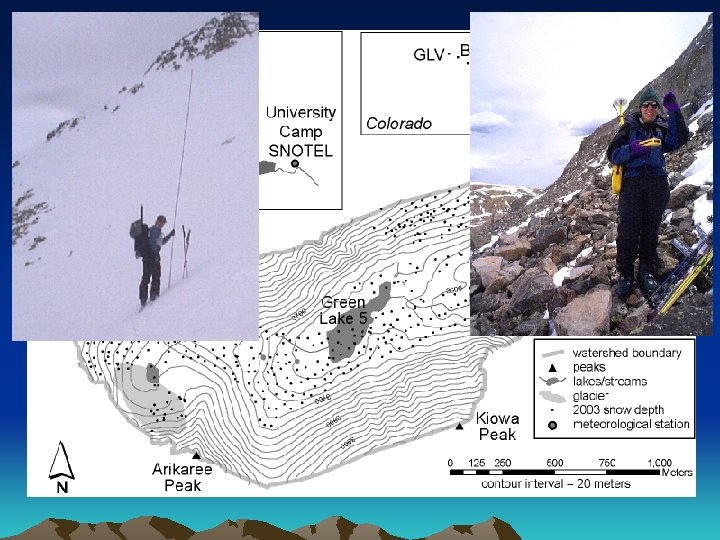
Development and Application of Geostatistical Methods to Modeling Spatial Variation in Snowpack Properties, Front Range, Colorado Tyler Erickson and Mark Williams Department of Geography Institute of Arctic and Alpine Research University of Colorado, Boulder
Mountain Snowpacks • Water source • Recreation • Habitat
Empirical Model Physically-based Model redistribution precipitation sublimation snowpack infiltration snowmelt
Snowpack Distribution • Physically-based models require spatially-distributed model inputs • Snow properties are typically measured at only a few locations (1 site per 1650 km 2) • How can we infer snow properties over large areas from limited measurements?
Spatial Correlation • Measurements in close proximity to each other generally exhibit less variability than measurements taken farther apart. • Assuming independence, when the data are spatial-correlated may lead to: 1. Biased estimates of model parameters 2. Biased statistical testing of model parameters • Spatial correlation can be accounted for by using geostatistical techniques
Snow Depth in Green Lakes Valley
Objectives • Identify significant auxiliary variables for predicting snow depth in an alpine valley • Estimate snow depth distributions at unsampled locations and/or times
Methodology Overview Linear Regression - Incorporates auxiliary variables - Significance testing Geostatistics - Spatial estimates - Incorporates spatial correlation Geostatistical with a Complex Mean
Regionalized Variable Modeling regionalized variable z(x) linear model deterministic component = m(x) stochastic component + e(x) variogram model
Spatial Modeling of Snow z(x) = m(x) + e(x)
Auxiliary Parameters z(x) • • • Elevation Slope Radiation Shelter Drift = m(x) + e(x)
“Linear” Model # of base functions base function coefficients Constant mean: Linear trend: Nonlinear trend: Base function coefficients (β) are optimized by solving a kriging system
Kriging System How do we determine the coefficients (b)? trend model variogram model unknowns measured data
Variogram Model • Used to describe spatial correlation 1 2 3 4 Variogram parameters (σ2 and L) are optimized by Restricted Maximum Likelihood
Significance Testing Compact model: Augmented model: H 0: β 2 = 0 Is β 2 significantly different from zero? • Sampling snow depth – length = 1000 m Is elevation a significant predictor of – spacing = 50 m snow depth? – # points = 21
Example cont… H 0 is TRUE 5% H 0 Rejected! H 0 H 5% 0 Not Rejected 5% H 0 rejected
Methodology Flowchart Measured data 7 (annual surveys) Variogram model 1 (exponential variogram) Trend model 3 (constant, linear, nonlinear) Auxiliary data 5 (elevation, slope, radiation, wind shelter, wind drifting) Variogram optimization (RML) Base function optimization (kriging) Estimate or simulation maps
z(x) = m(x) + e(x) Optimized Coefficients
Deterministic Snow Depth Maps Constant Snow depth [m] 0 Linear 5 Nonlinear 10
Model Error Variograms z(x) = m(x) + e(x)
Snow Depth Maps 1999 best conditioned estimate of stochastic best estimate component 1999 best estimate of deterministic component snow depth [m] 0 5 model residual [m] 10 -5 0 5
Correlation to SNOTEL β 1 = 231 cm Developed Remaining from βs are ’ 98, ’ 00, ’ 01, obtained from’ 02, ’ 03 data (excludes ’ 99) multiyear modeling (’ 98, ’ 00, ’ 01, ’ 02, ’ 03) 111 m 2. 4 m 2 564 mm
Comparison to Regression Tree (1999 Dataset) Regression Tree Model Winstral et al. (2002)
GLV Summary • Used a spatially continuous, nonlinear model of the mean snow depth • Identified topographic parameters that are significant predictors of snow depth • Used external data (SNOTEL) to make a prediction without snow depth sampling