DALLAS FORT WORTH WELCOMES FINNISH COMPANIES London Ottawa
- Slides: 35
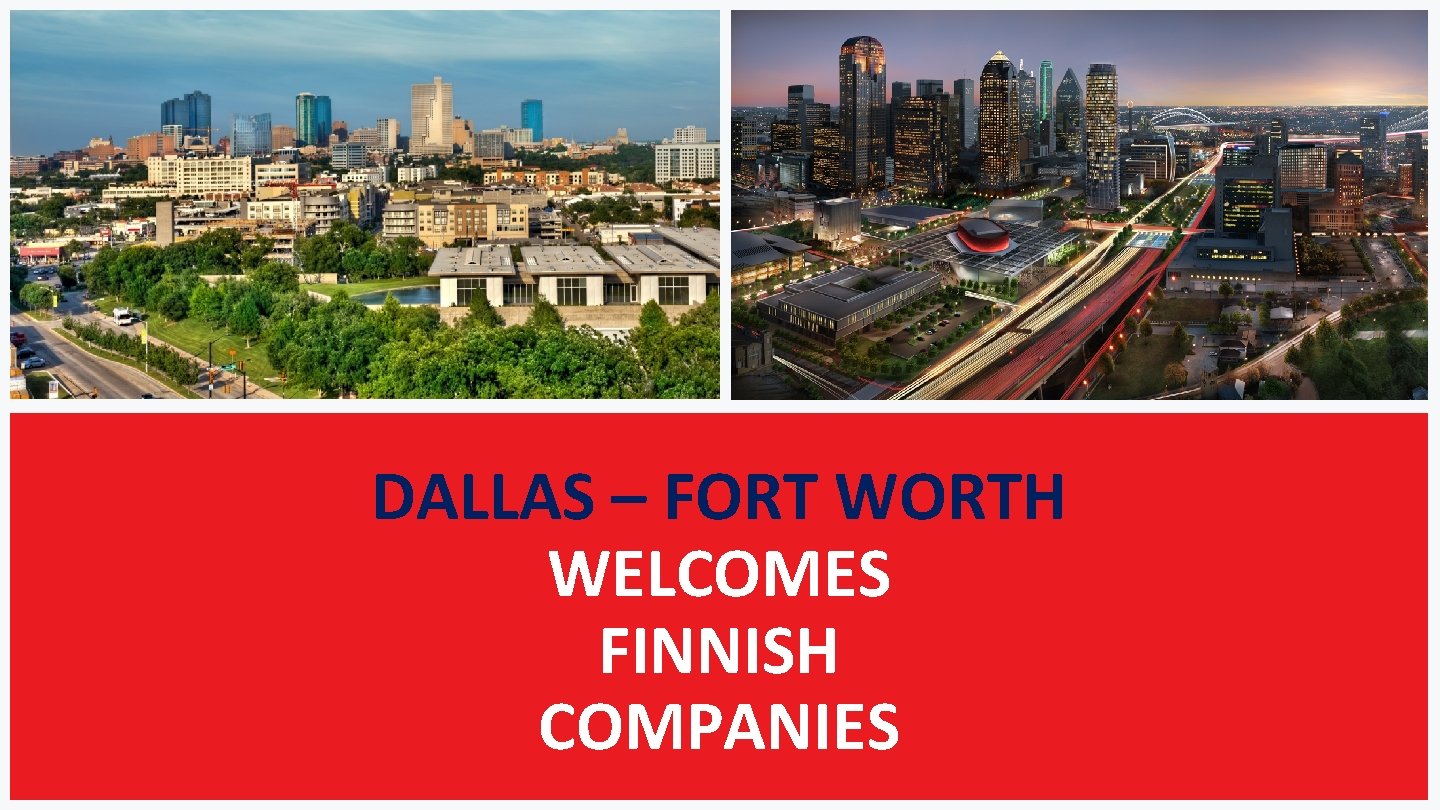
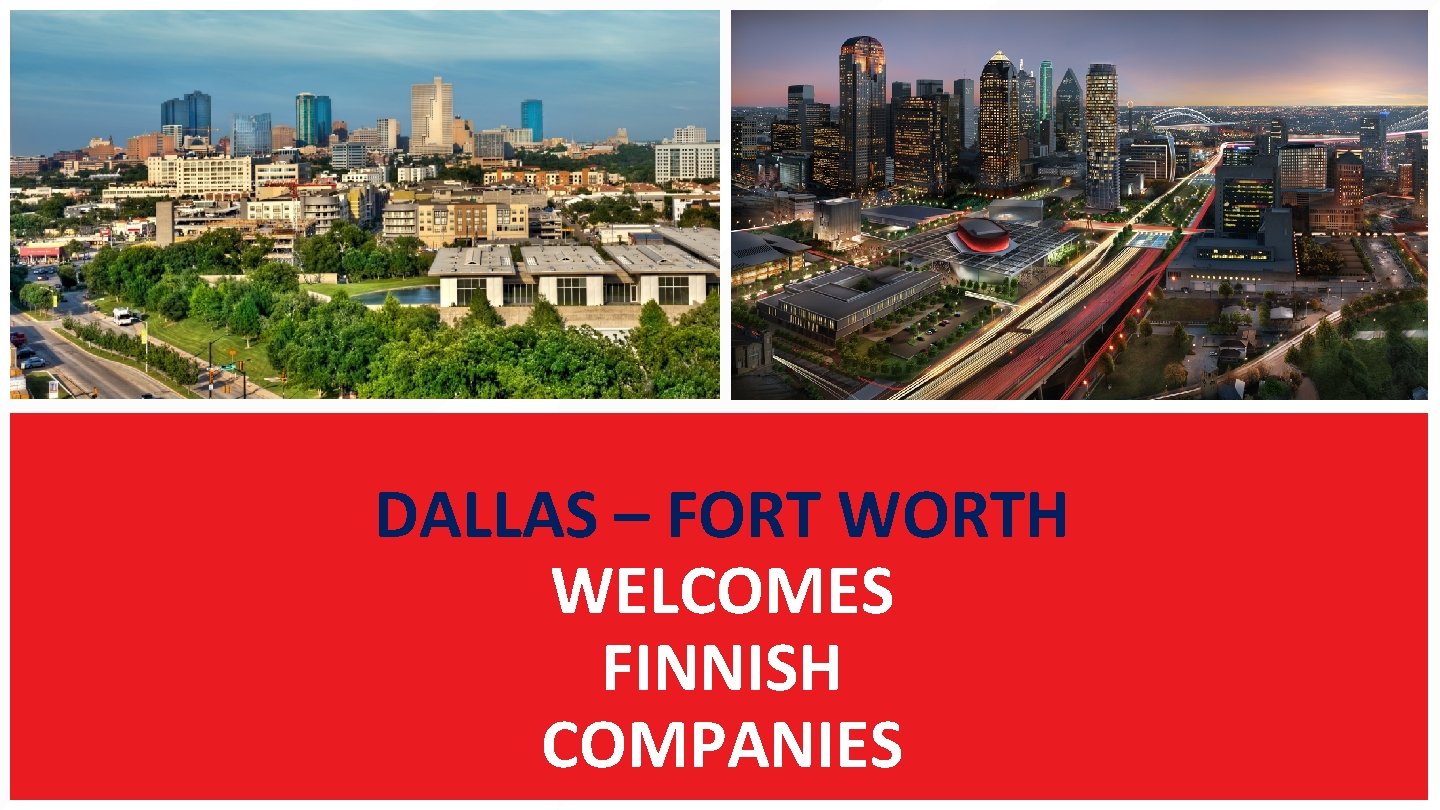
DALLAS – FORT WORTH WELCOMES FINNISH COMPANIES
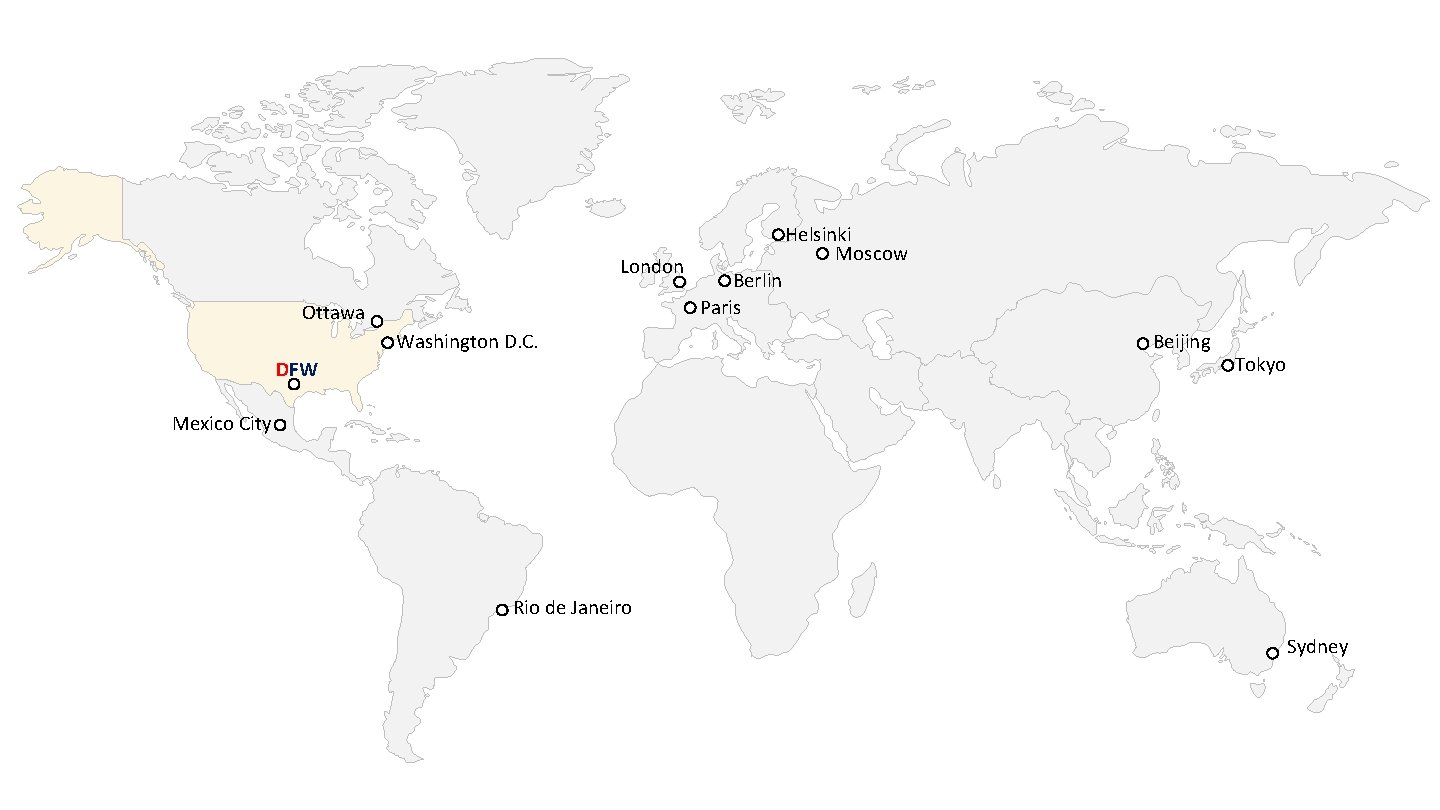
London Ottawa Washington D. C. DFW Helsinki Moscow Berlin Paris Beijing Tokyo Mexico City Rio de Janeiro Sydney
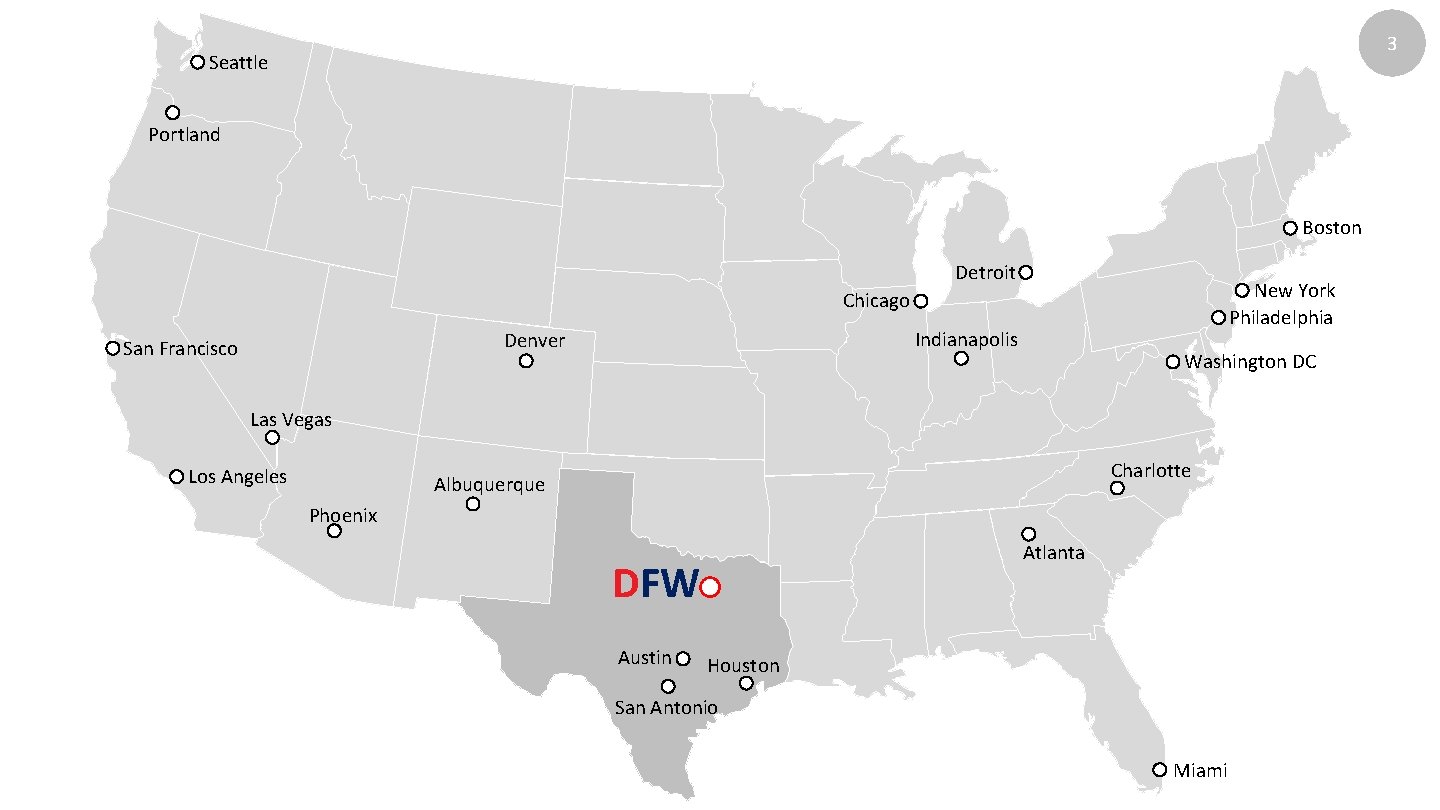
3 Seattle Portland Boston Detroit New York Philadelphia Chicago Indianapolis Denver San Francisco Washington DC Las Vegas Los Angeles Charlotte Albuquerque Phoenix Atlanta DFW Austin Houston San Antonio Miami
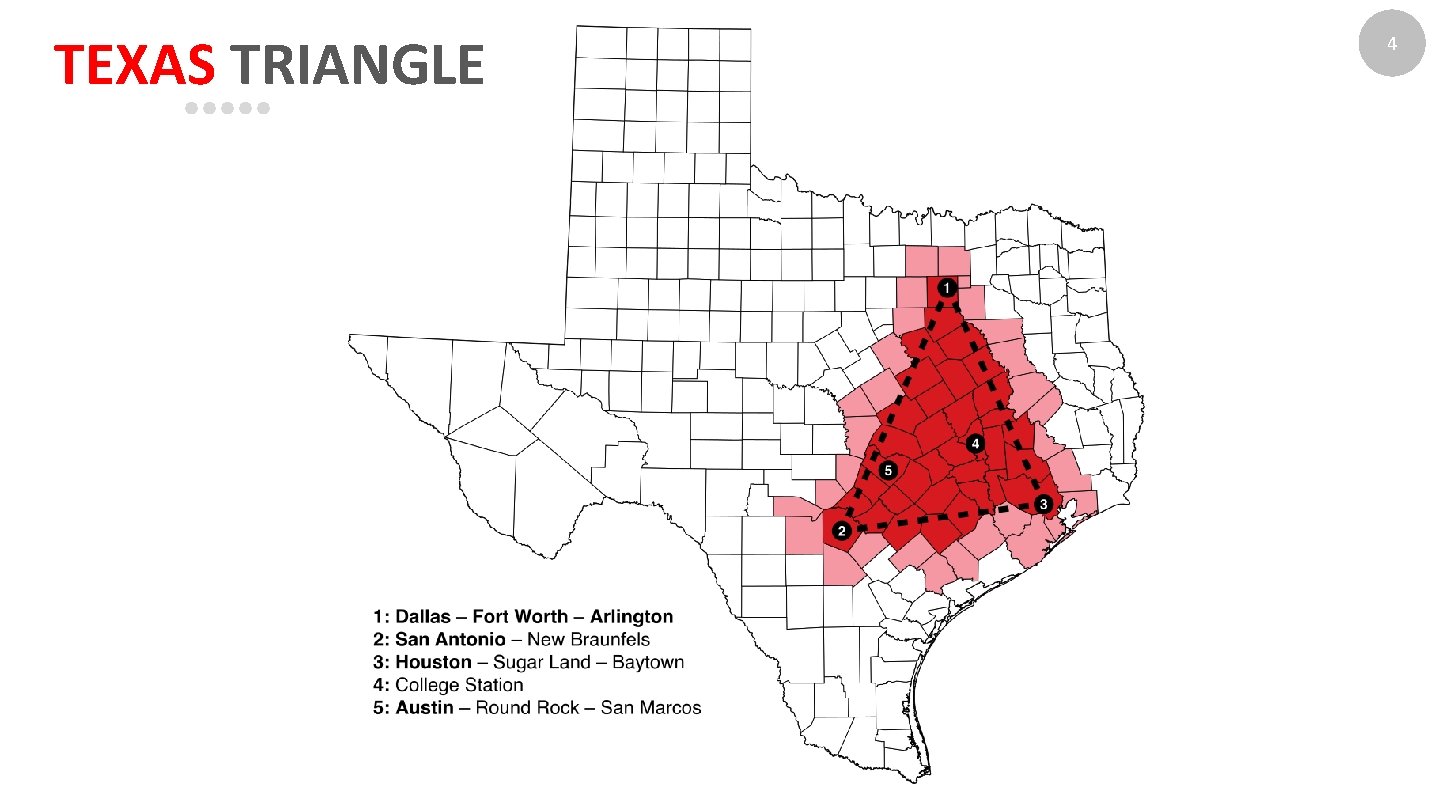
TEXAS TRIANGLE 4
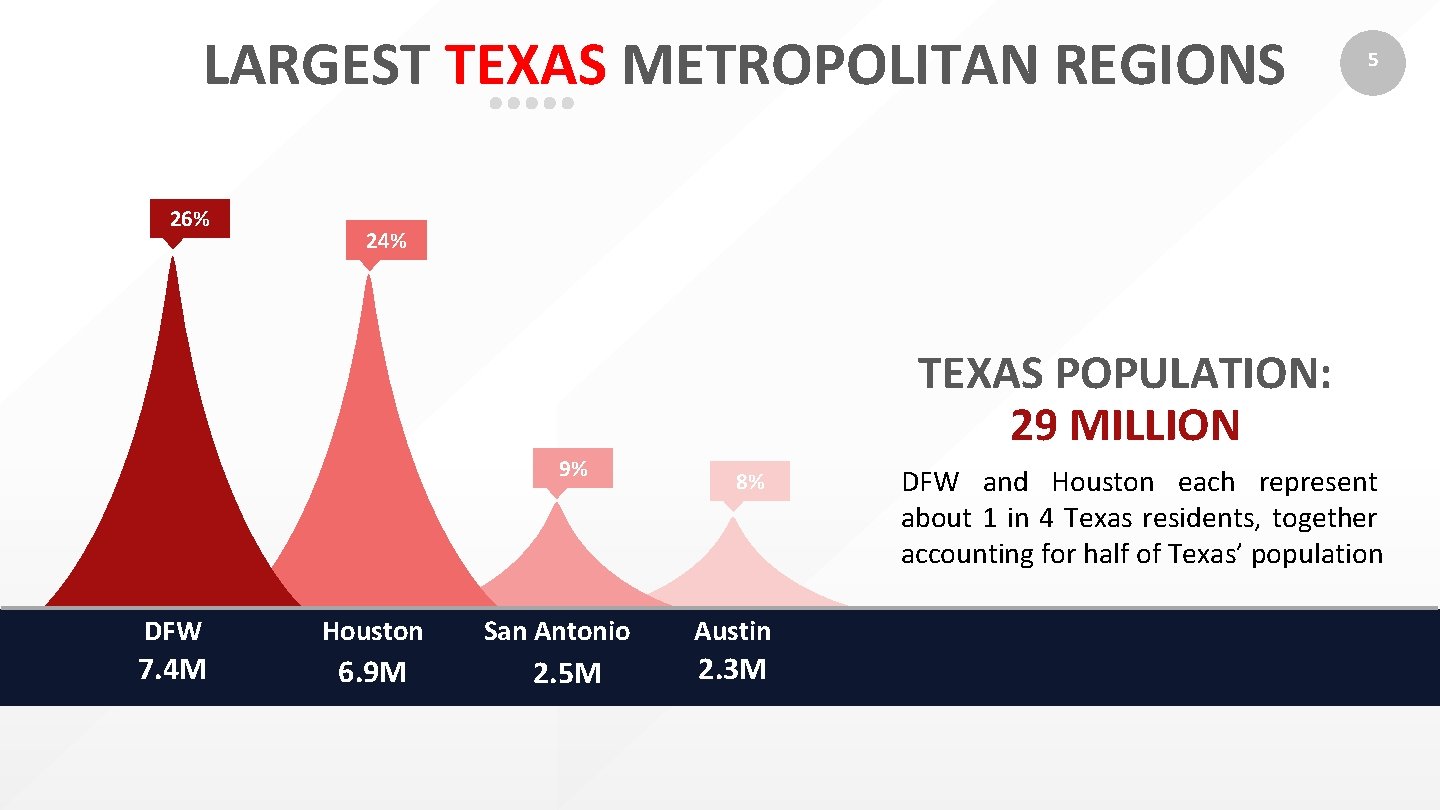
LARGEST TEXAS METROPOLITAN REGIONS 26% 5 24% TEXAS POPULATION: 29 MILLION 9% DFW Houston 7. 4 M 6. 9 M San Antonio 2. 5 M 8% Austin 2. 3 M DFW and Houston each represent about 1 in 4 Texas residents, together accounting for half of Texas’ population
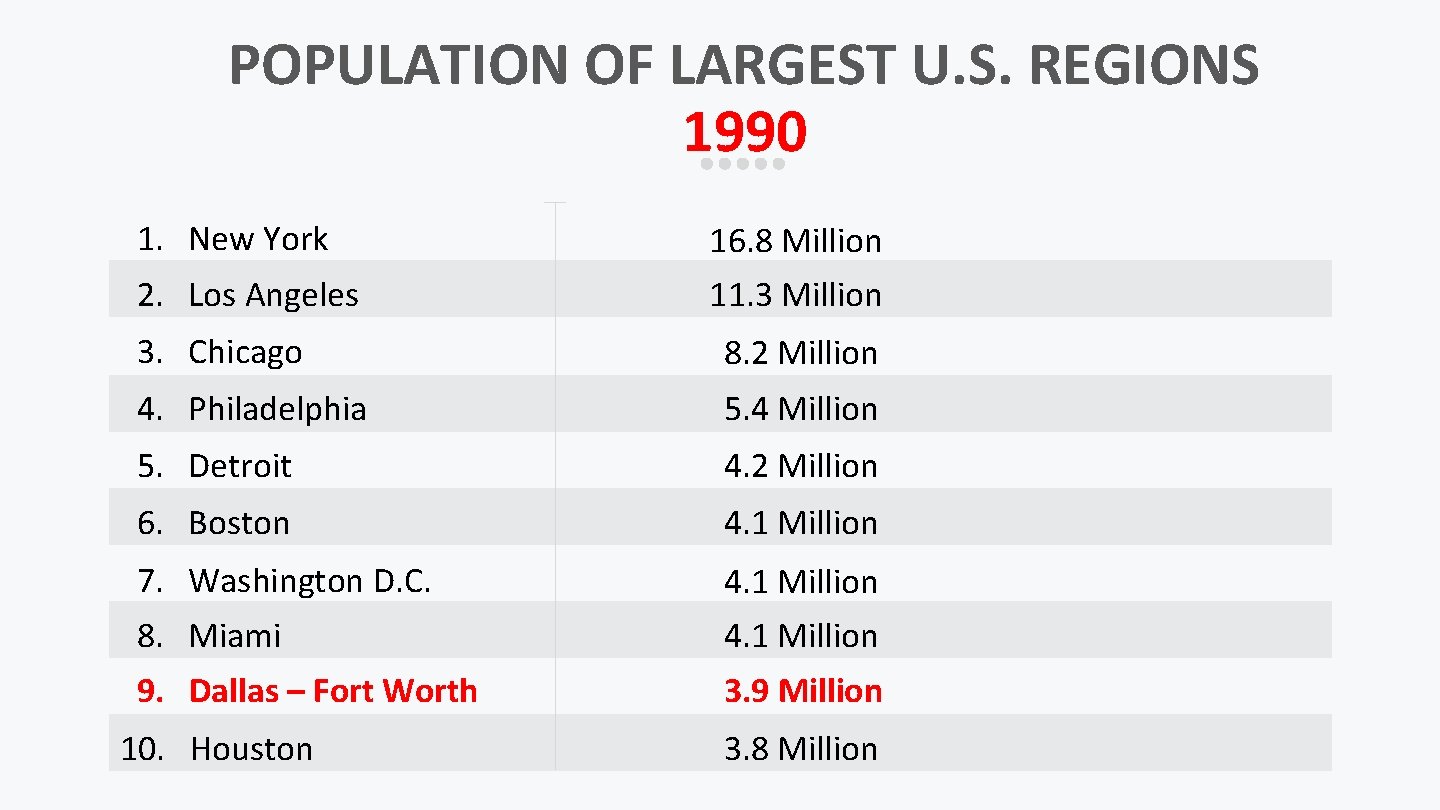
POPULATION OF LARGEST U. S. REGIONS 1990 1. New York 16. 8 Million 2. Los Angeles 11. 3 Million 3. Chicago 8. 2 Million 4. Philadelphia 5. 4 Million 5. Detroit 4. 2 Million 6. Boston 4. 1 Million 7. Washington D. C. 4. 1 Million 8. Miami 4. 1 Million 9. Dallas – Fort Worth 3. 9 Million 10. Houston 3. 8 Million
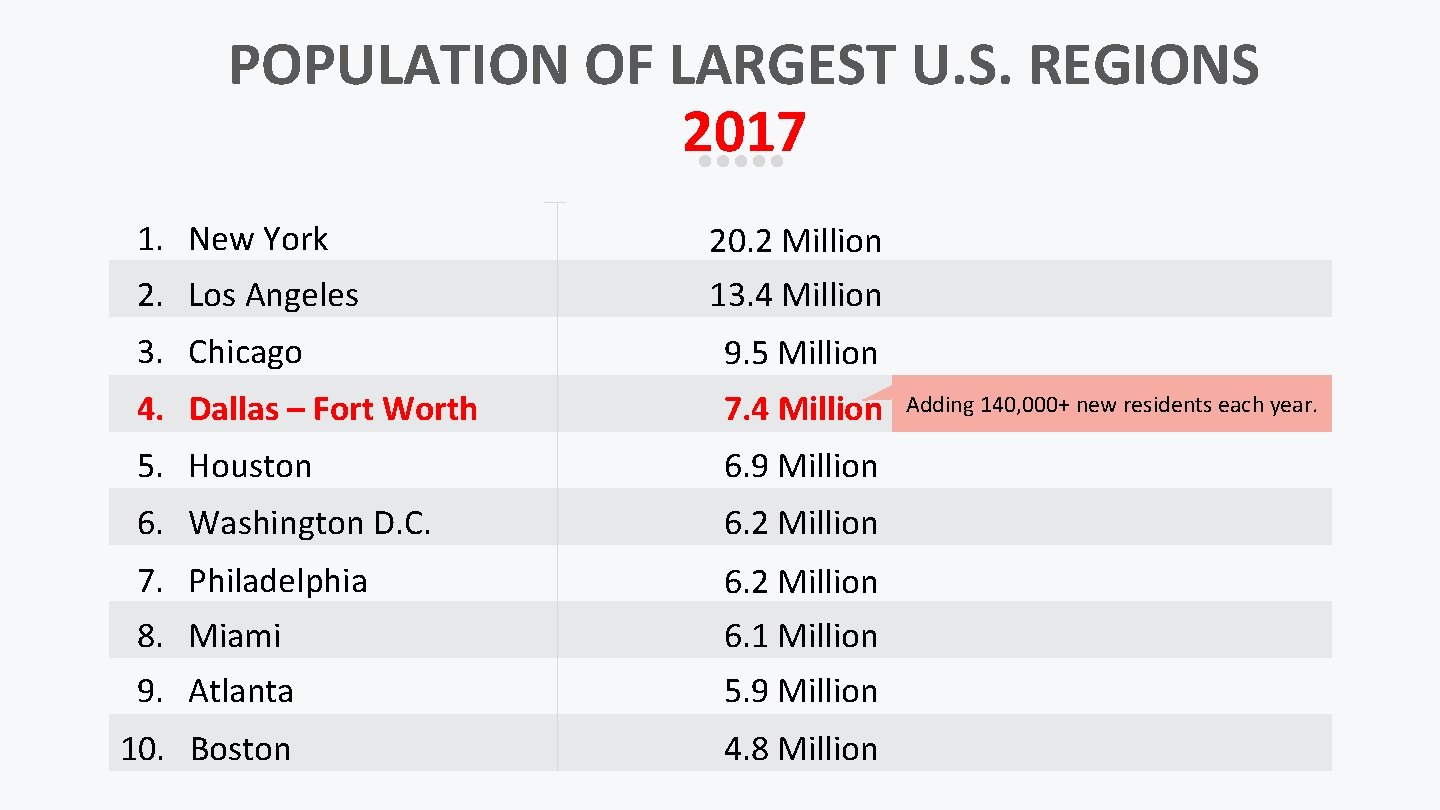
POPULATION OF LARGEST U. S. REGIONS 2017 1. New York 20. 2 Million 2. Los Angeles 13. 4 Million 3. Chicago 9. 5 Million 4. Dallas – Fort Worth 7. 4 Million 5. Houston 6. 9 Million 6. Washington D. C. 6. 2 Million 7. Philadelphia 6. 2 Million 8. Miami 6. 1 Million 9. Atlanta 5. 9 Million 10. Boston 4. 8 Million Adding 140, 000+ new residents each year.
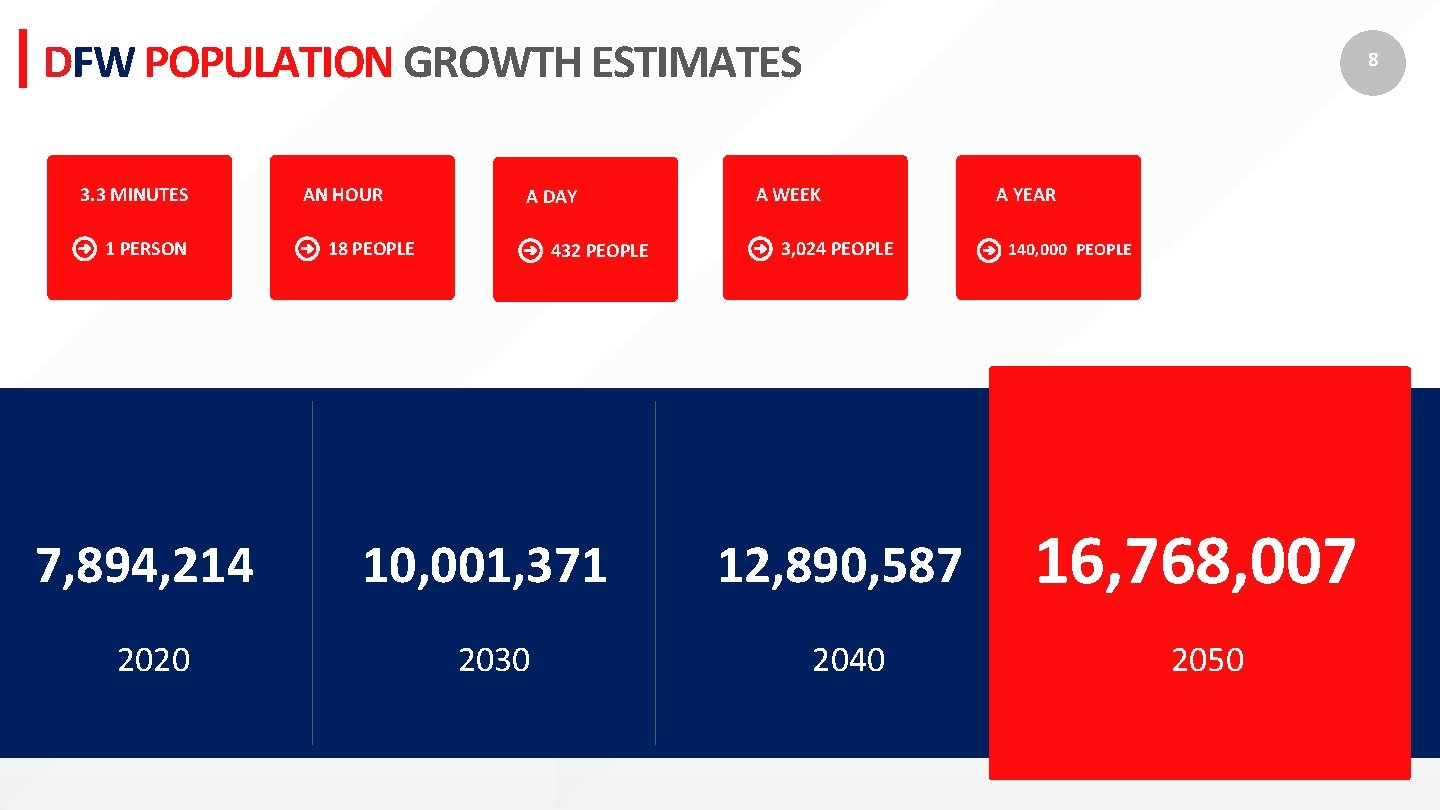
DFW POPULATION GROWTH ESTIMATES 3. 3 MINUTES 1 PERSON AN HOUR A DAY 18 PEOPLE 432 PEOPLE 8 A WEEK 3, 024 PEOPLE 7, 894, 214 10, 001, 371 12, 890, 587 2020 2030 2040 A YEAR 140, 000 PEOPLE 16, 768, 007 2050
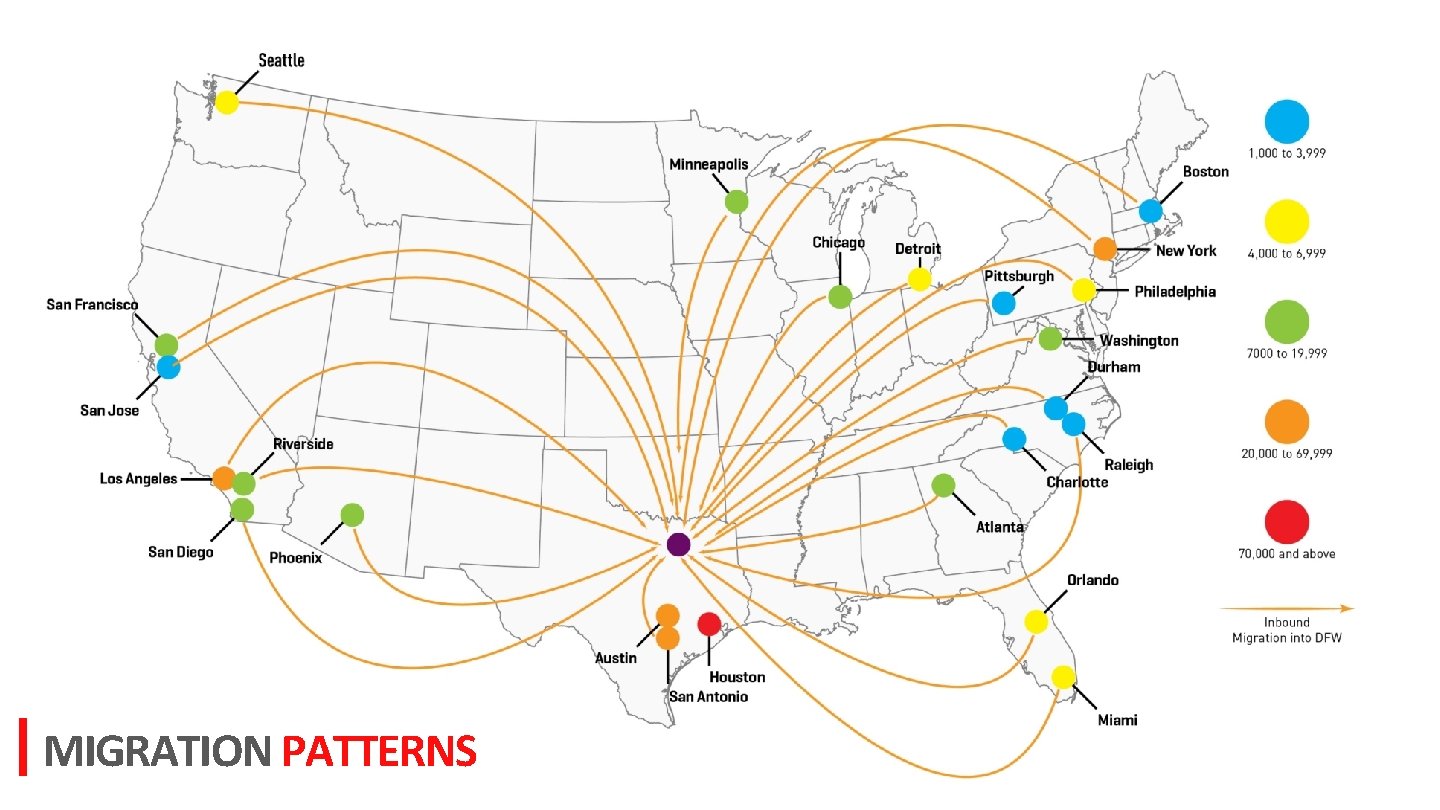
MIGRATION PATTERNS
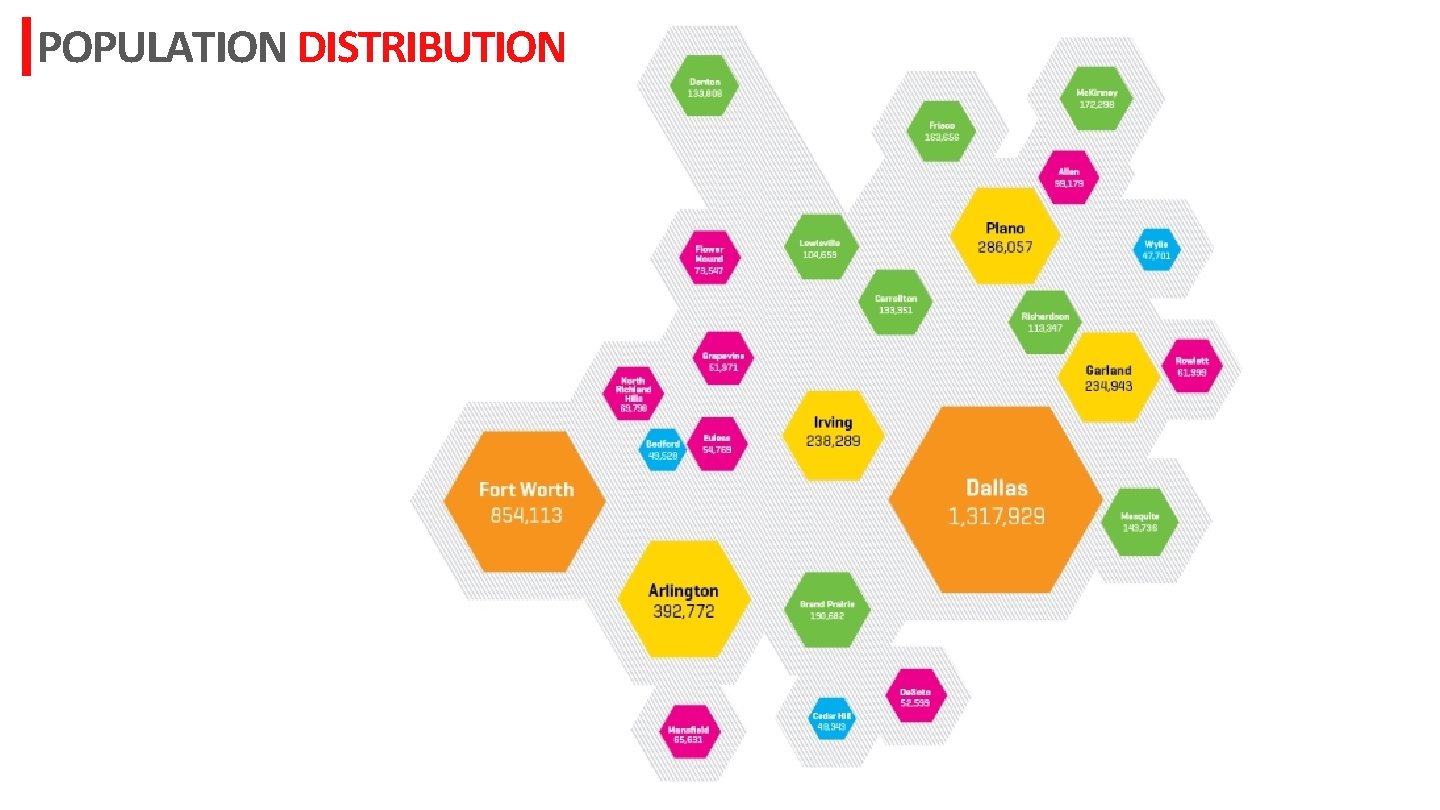
POPULATION DISTRIBUTION
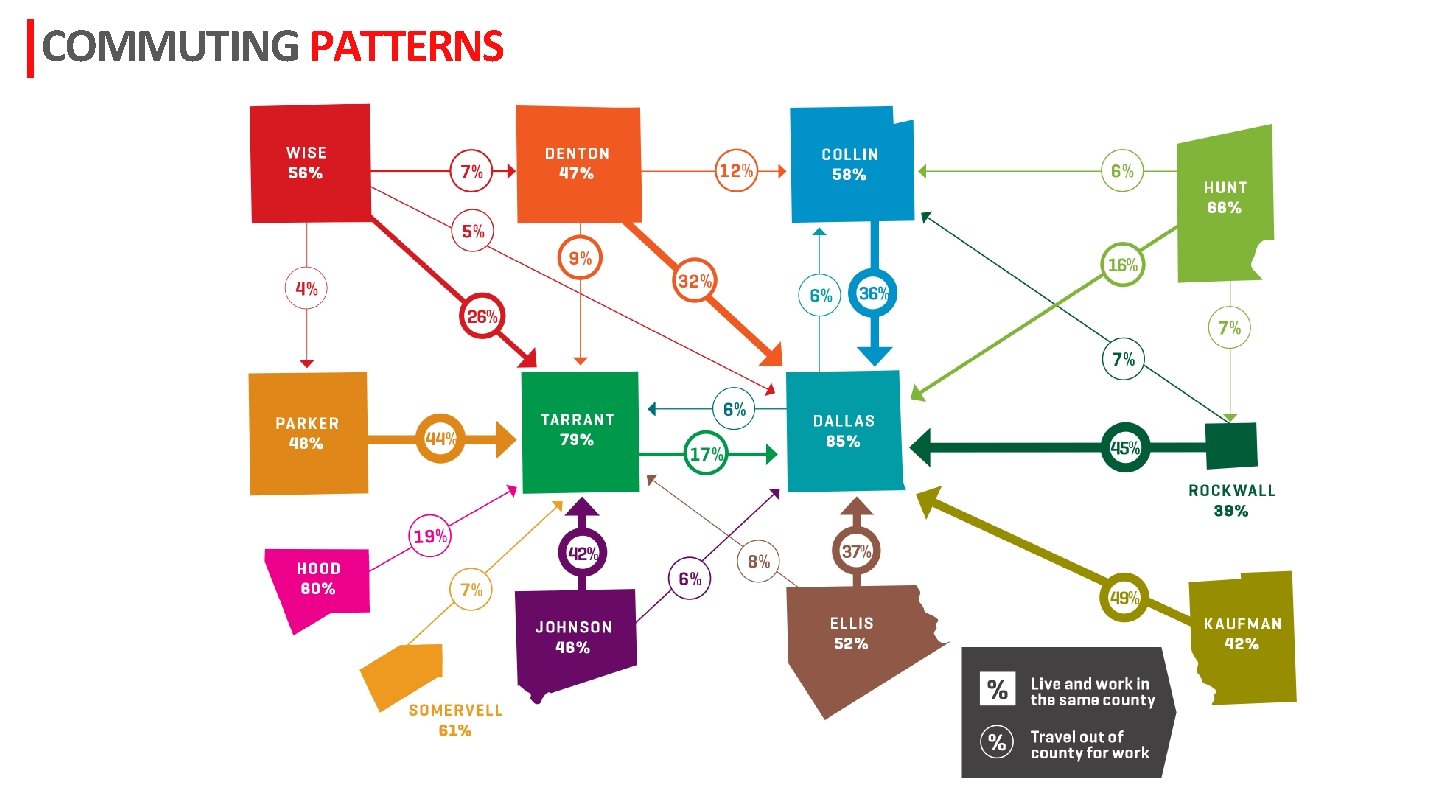
COMMUTING PATTERNS
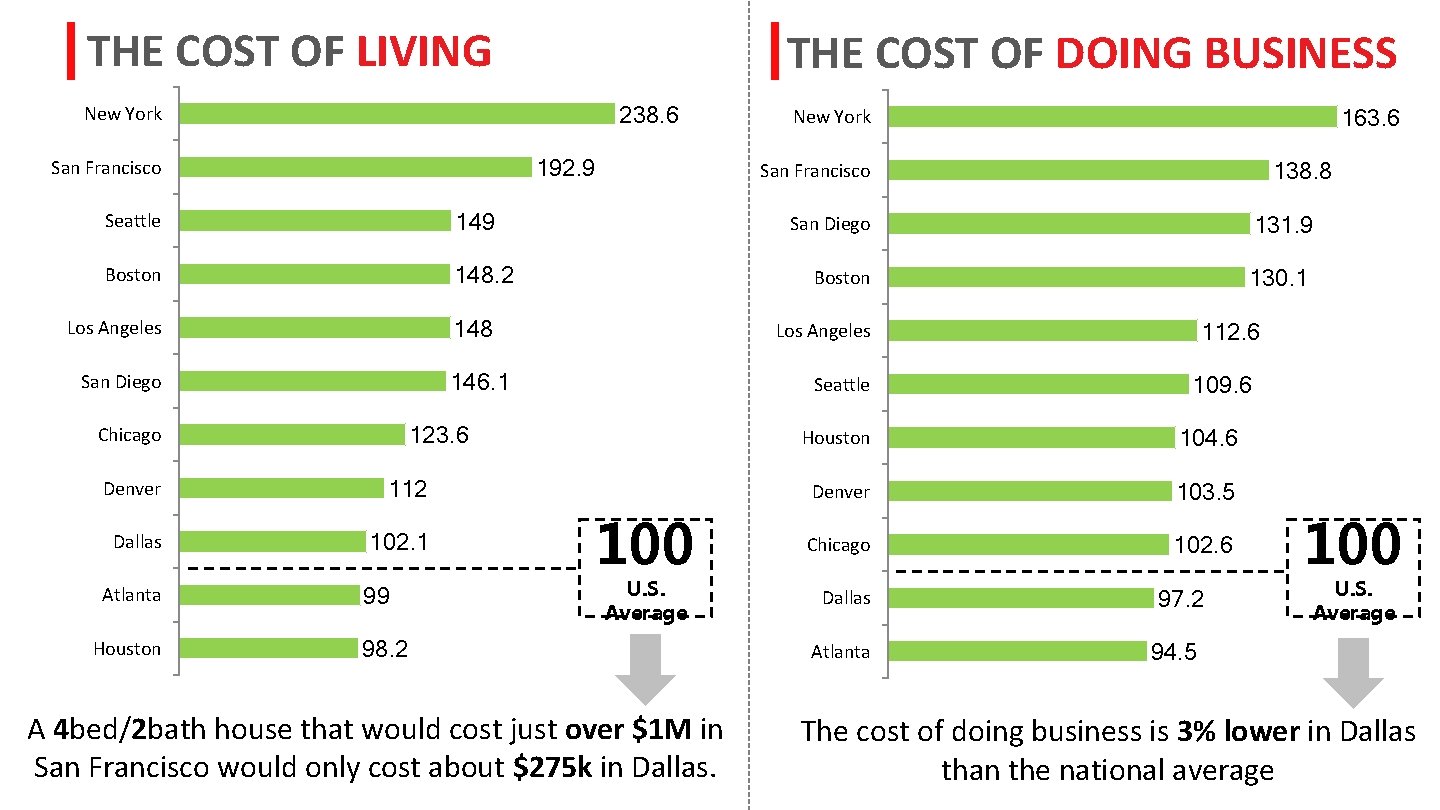
DFW Economy THE COST OF LIVING THE COST OF DOING BUSINESS 238. 6 New York 192. 9 San Francisco Seattle 149 Boston 148. 2 Denver 112 Dallas 102. 1 Atlanta Houston 99 131. 9 Boston 130. 1 Seattle 123. 6 Chicago San Diego 112. 6 Los Angeles 146. 1 San Diego 138. 8 San Francisco 148 Los Angeles 163. 6 New York 100 U. S. Average 98. 2 A 4 bed/2 bath house that would cost just over $1 M in San Francisco would only cost about $275 k in Dallas. 109. 6 Houston 104. 6 Denver 103. 5 Chicago 102. 6 Dallas Atlanta 97. 2 100 U. S. Average 94. 5 The cost of doing business is 3% lower in Dallas than the national average
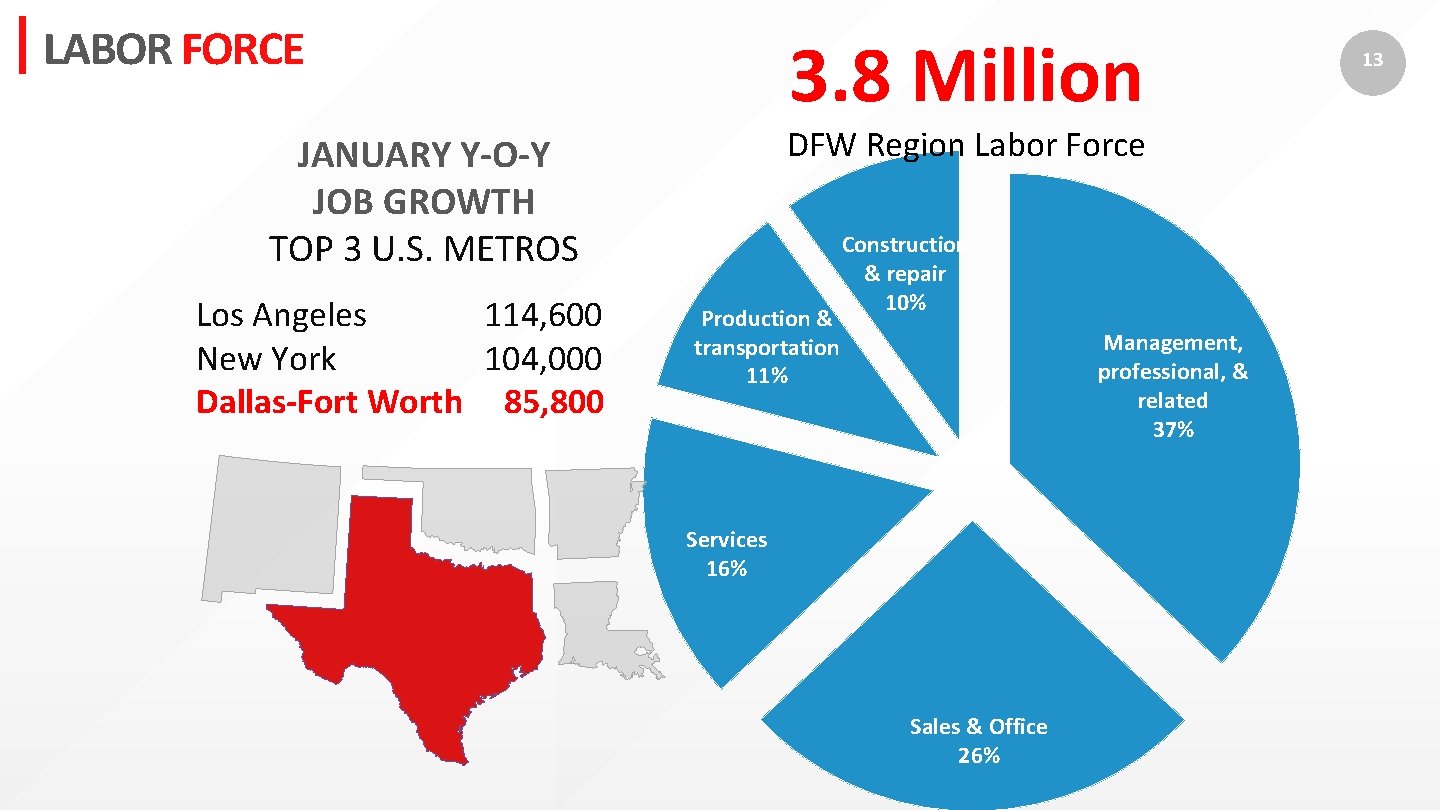
DFW Economy LABOR FORCE 3. 8 Million DFW Region Labor Force JANUARY Y-O-Y JOB GROWTH TOP 3 U. S. METROS Los Angeles 114, 600 New York 104, 000 Dallas-Fort Worth 85, 800 Production & transportation 11% Construction & repair 10% Management, professional, & related 37% Services 16% Sales & Office 26% 13
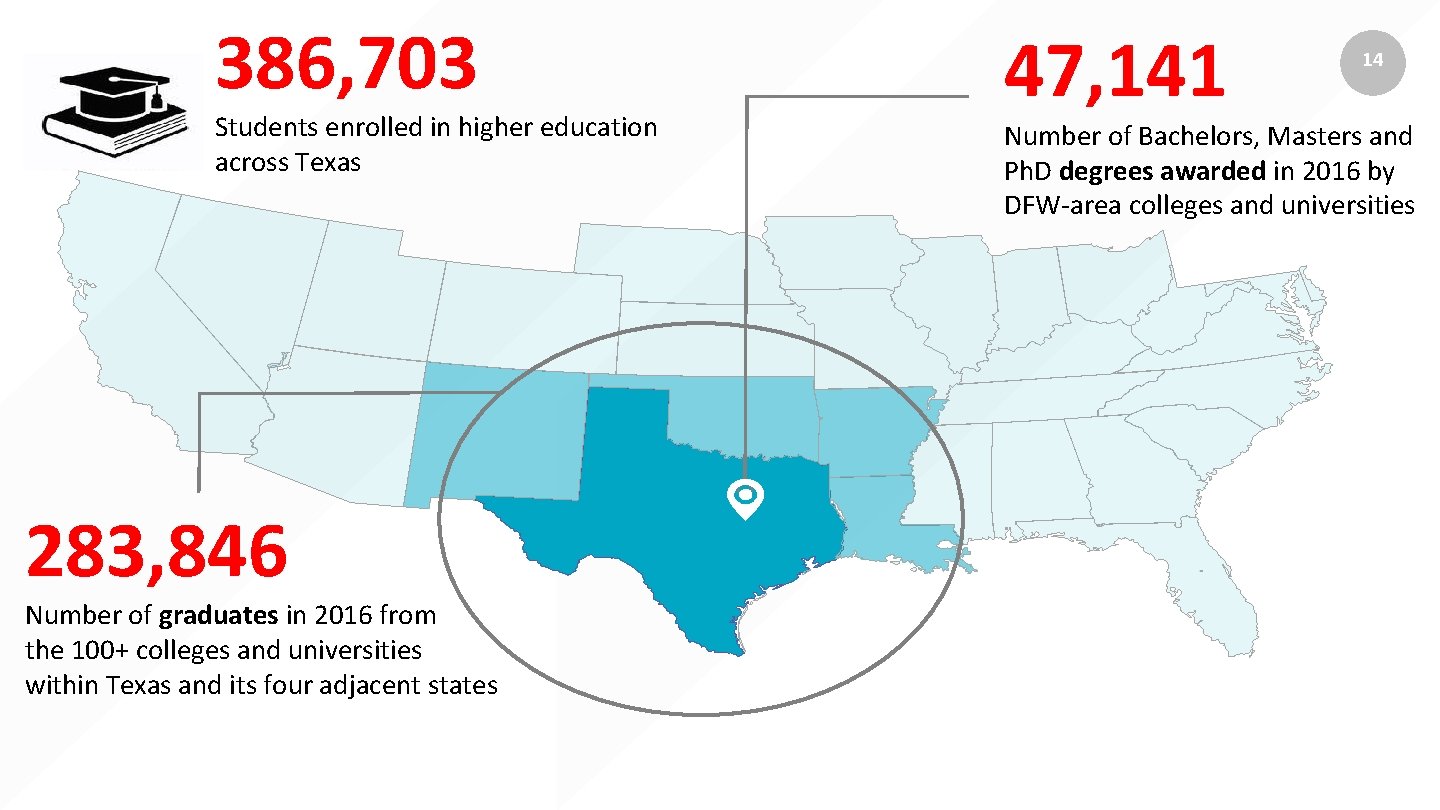
386, 703 Students enrolled in higher education across Texas 283, 846 Number of graduates in 2016 from the 100+ colleges and universities within Texas and its four adjacent states 47, 141 14 Number of Bachelors, Masters and Ph. D degrees awarded in 2016 by DFW-area colleges and universities
TEXAS AND BUSINESS CLIMATE 15
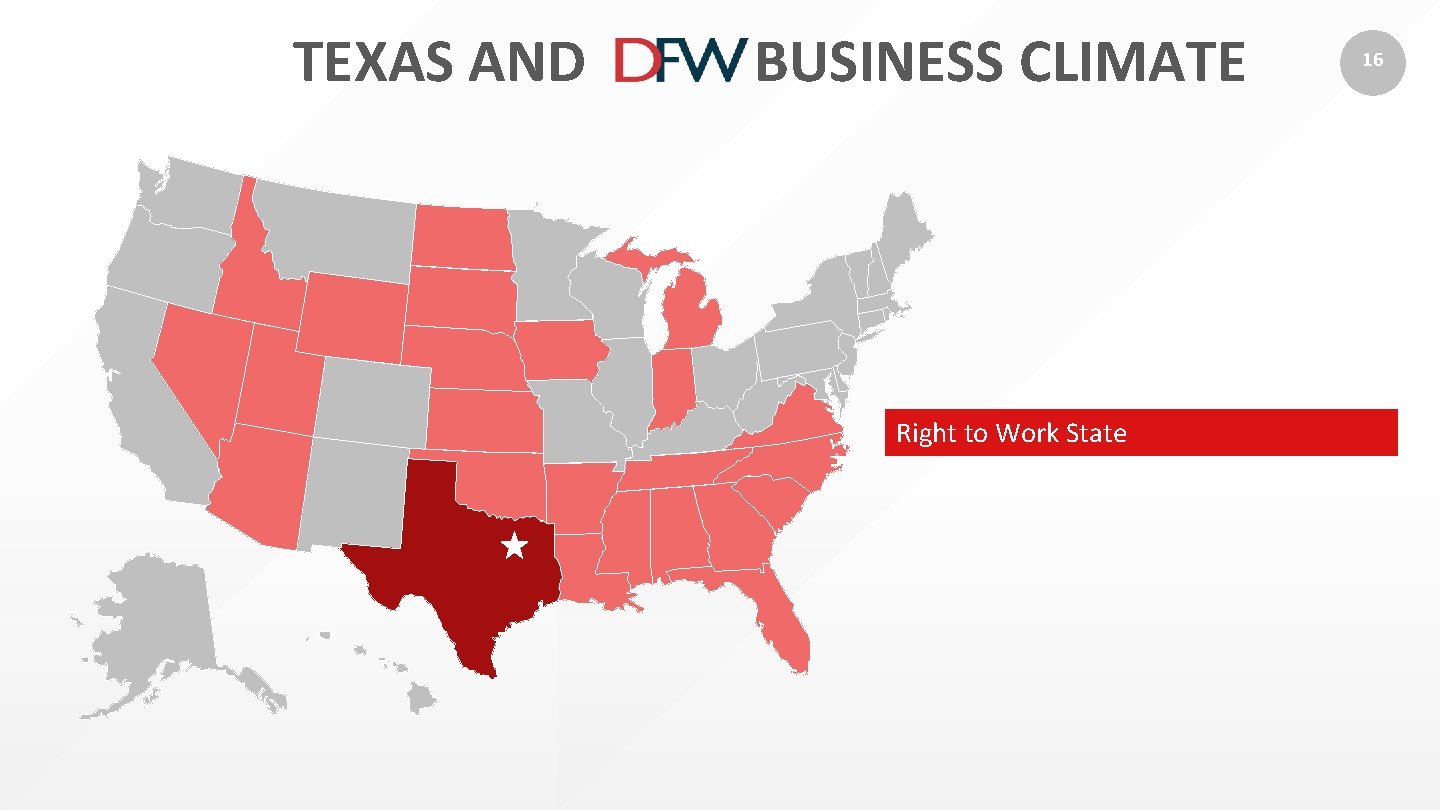
TEXAS AND BUSINESS CLIMATE Right to Work State 16
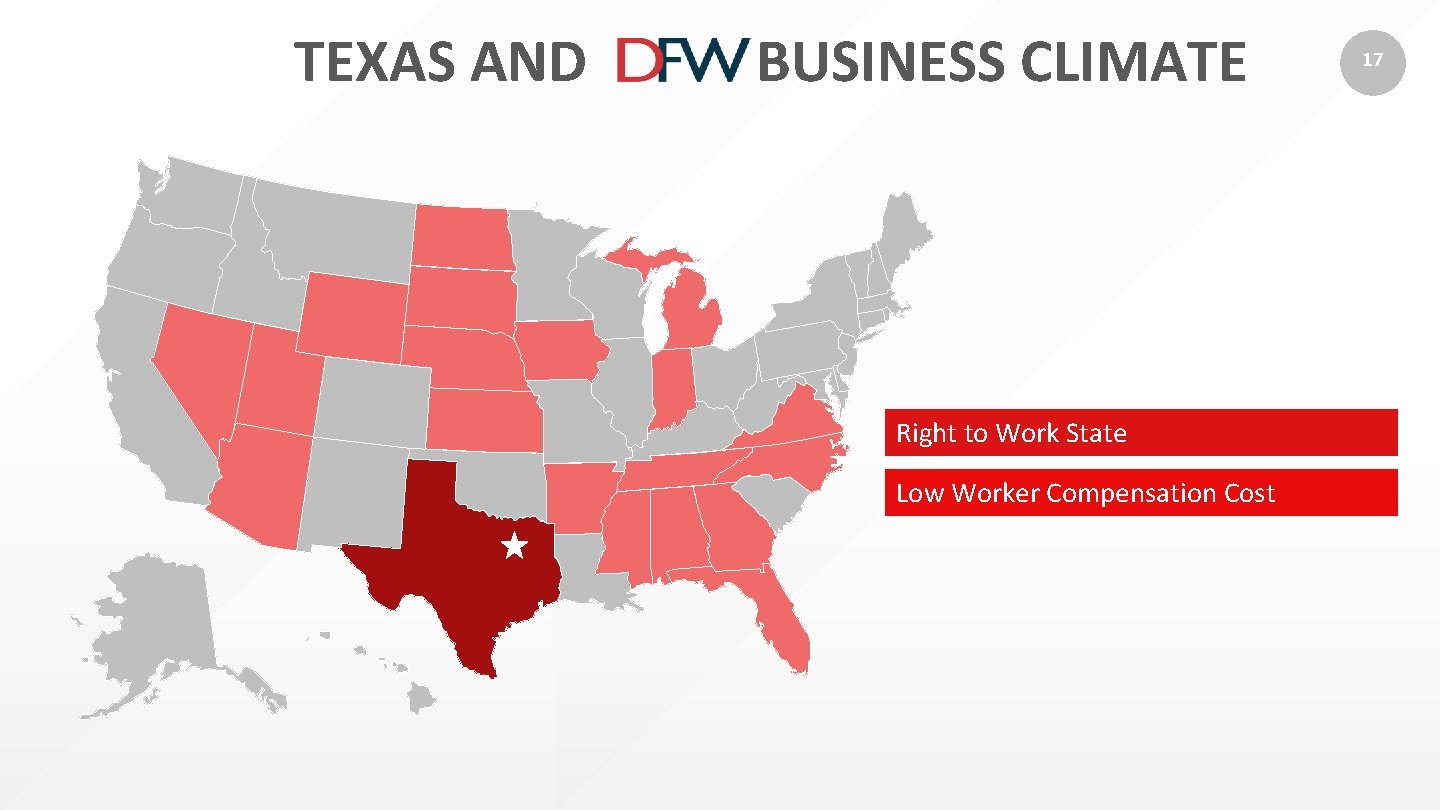
TEXAS AND BUSINESS CLIMATE Right to Work State Low Worker Compensation Cost 17
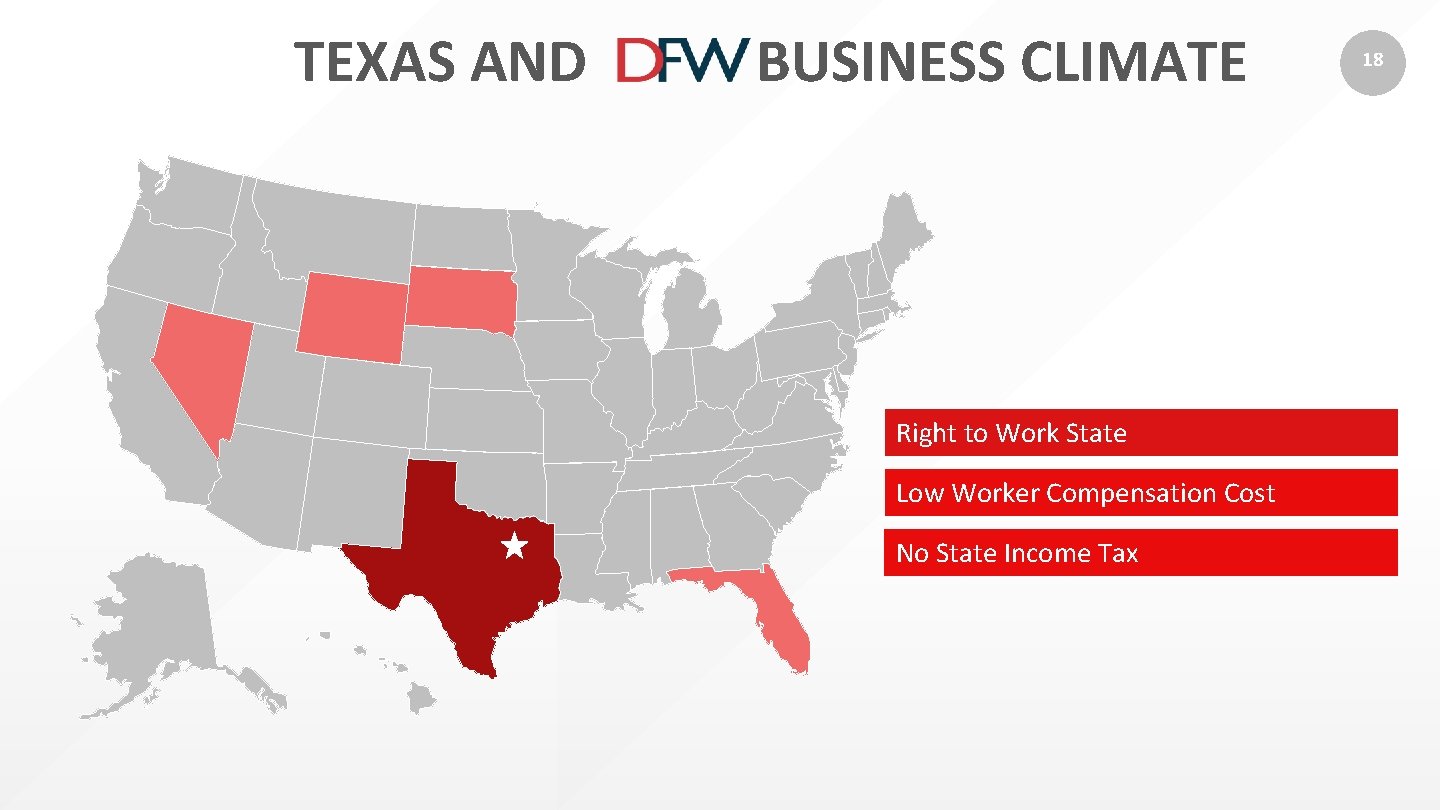
TEXAS AND BUSINESS CLIMATE Right to Work State Low Worker Compensation Cost No State Income Tax 18
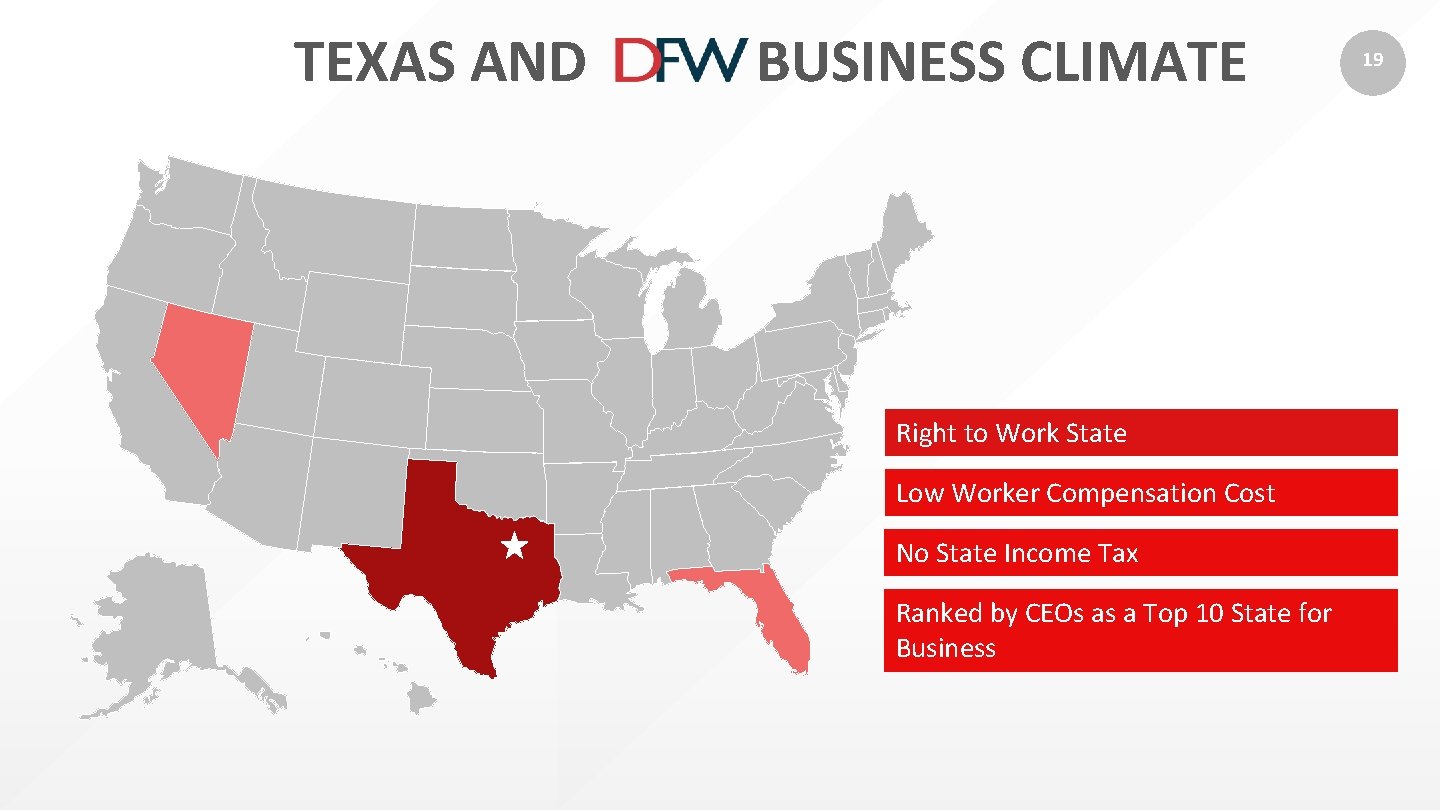
TEXAS AND BUSINESS CLIMATE Right to Work State Low Worker Compensation Cost No State Income Tax Ranked by CEOs as a Top 10 State for Business 19
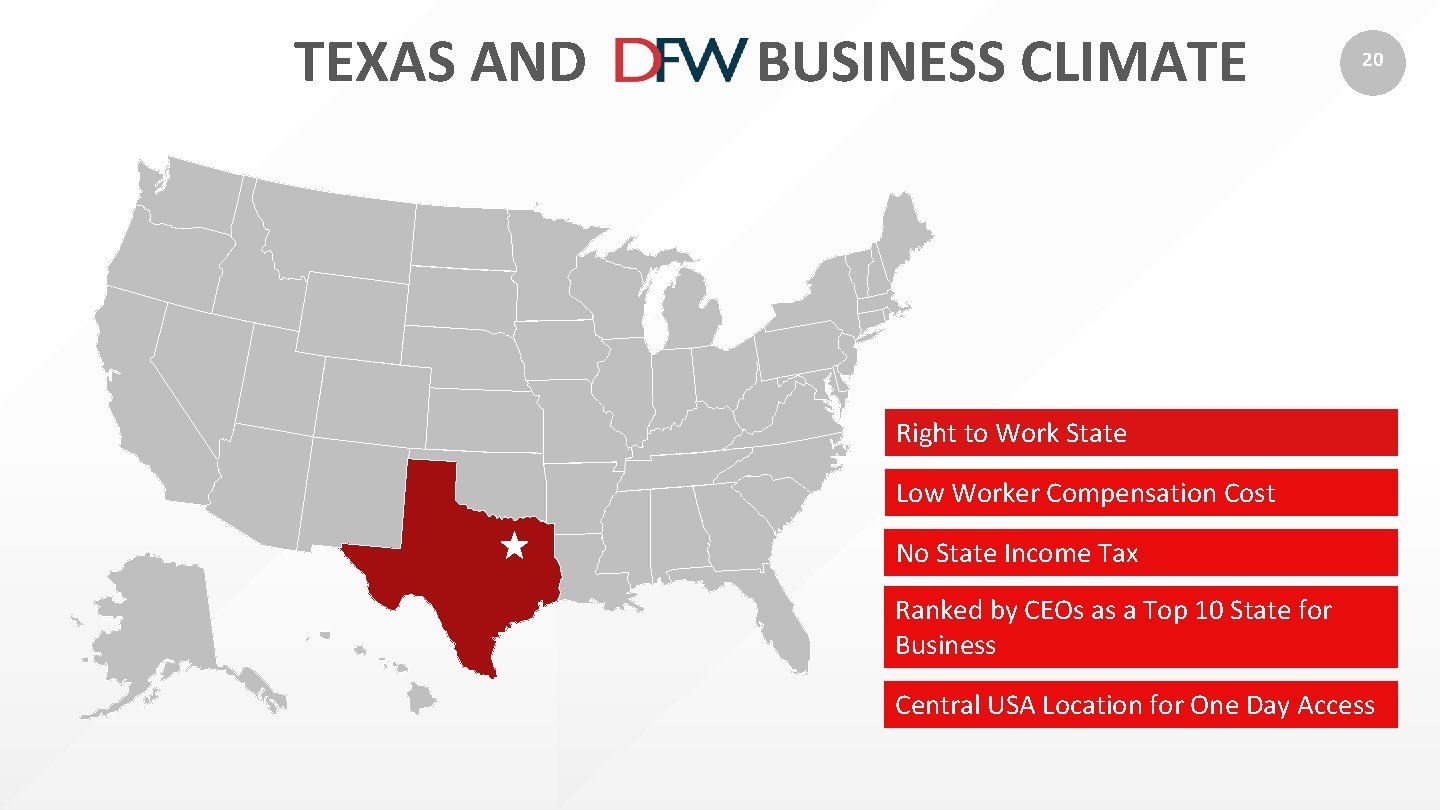
TEXAS AND BUSINESS CLIMATE 20 Right to Work State Low Worker Compensation Cost No State Income Tax Ranked by CEOs as a Top 10 State for Business Central USA Location for One Day Access
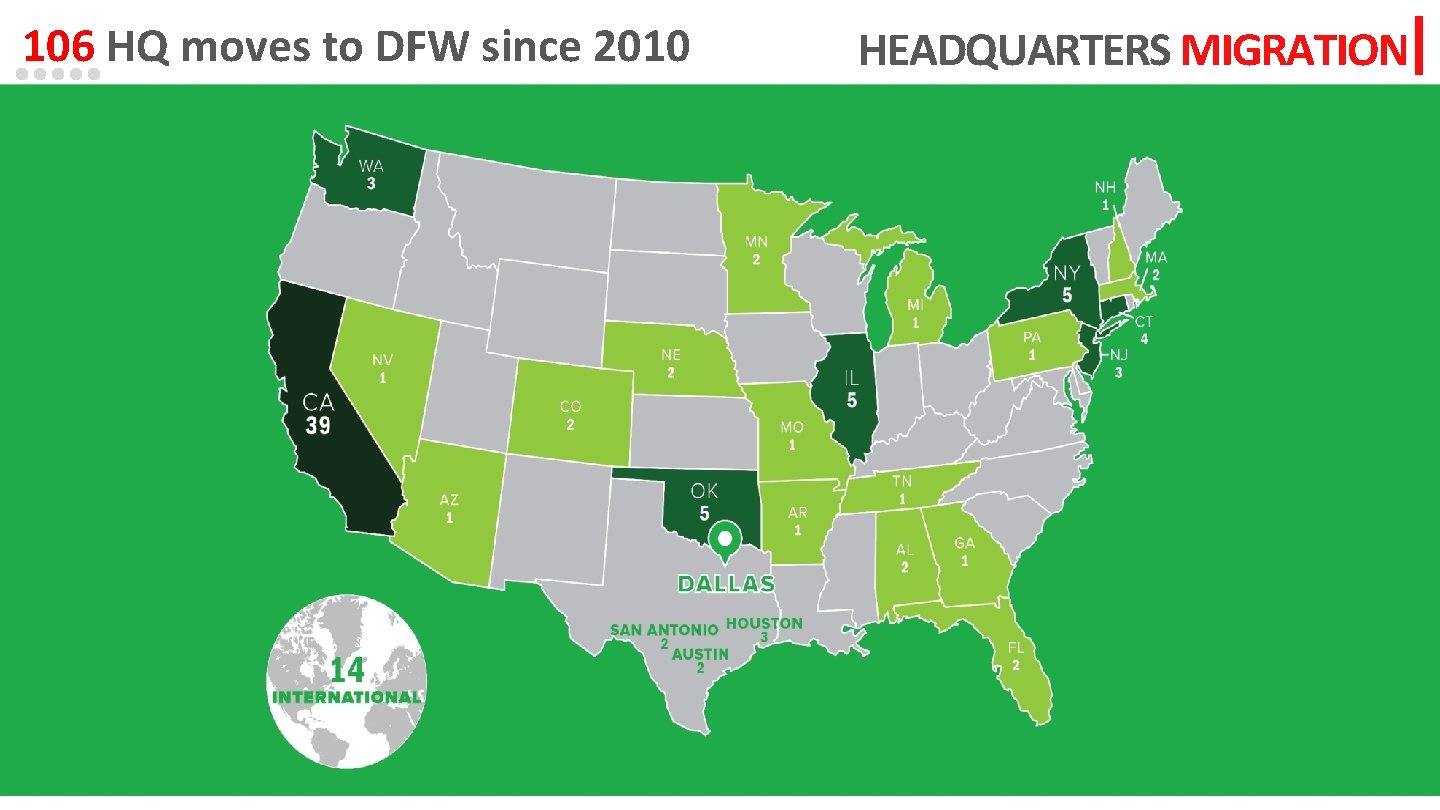
106 HQ moves to DFW since 2010 HEADQUARTERS MIGRATION
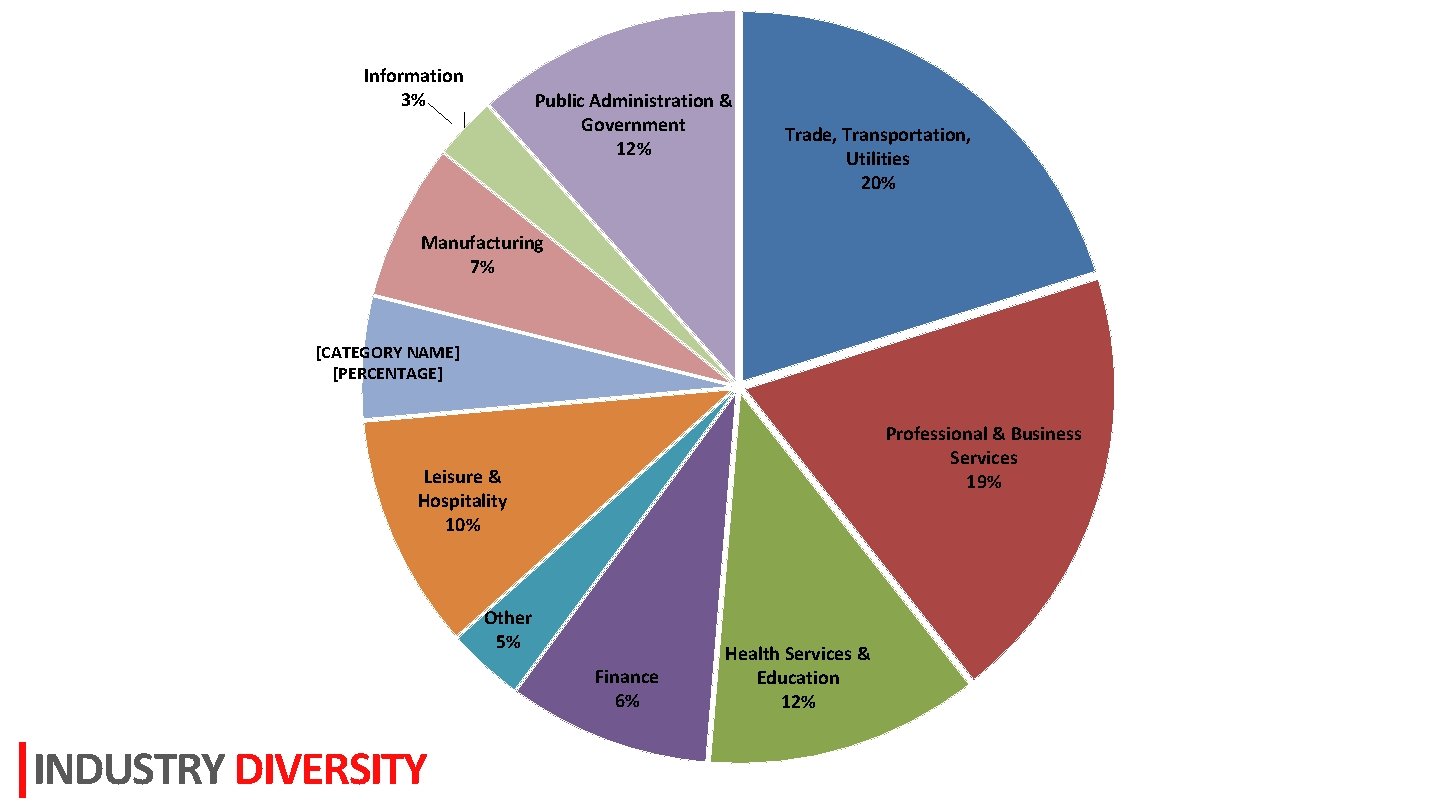
DFW Economy Information 3% Public Administration & Government 12% Trade, Transportation, Utilities 20% Manufacturing 7% [CATEGORY NAME] [PERCENTAGE] Professional & Business Services 19% Leisure & Hospitality 10% Other 5% Finance 6% INDUSTRY DIVERSITY Health Services & Education 12%
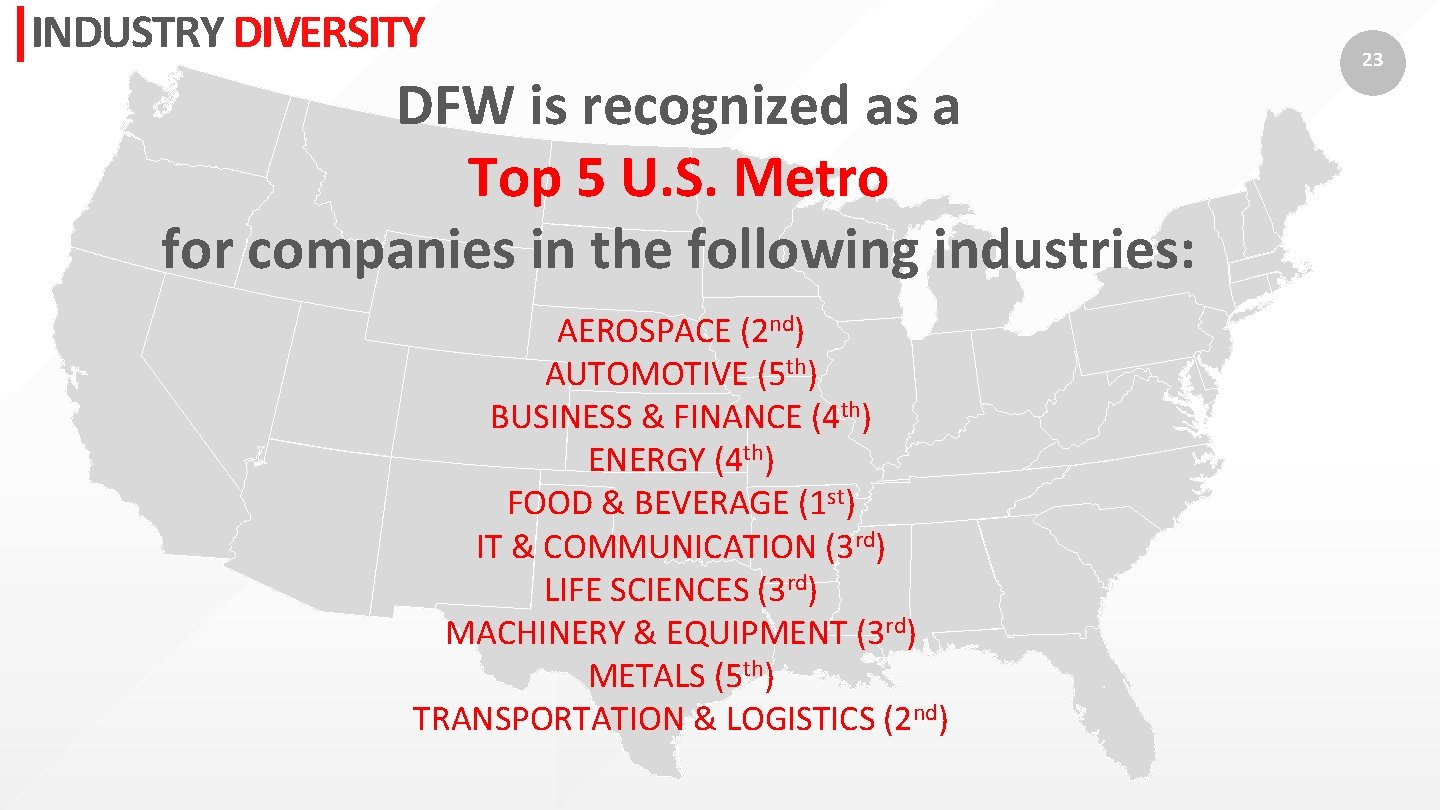
INDUSTRY DIVERSITY DFW is recognized as a Top 5 U. S. Metro for companies in the following industries: AEROSPACE (2 nd) AUTOMOTIVE (5 th) BUSINESS & FINANCE (4 th) ENERGY (4 th) FOOD & BEVERAGE (1 st) IT & COMMUNICATION (3 rd) LIFE SCIENCES (3 rd) MACHINERY & EQUIPMENT (3 rd) METALS (5 th) TRANSPORTATION & LOGISTICS (2 nd) 23
FORTUNE 1000 24
INTERNATIONAL COMPANIES 25
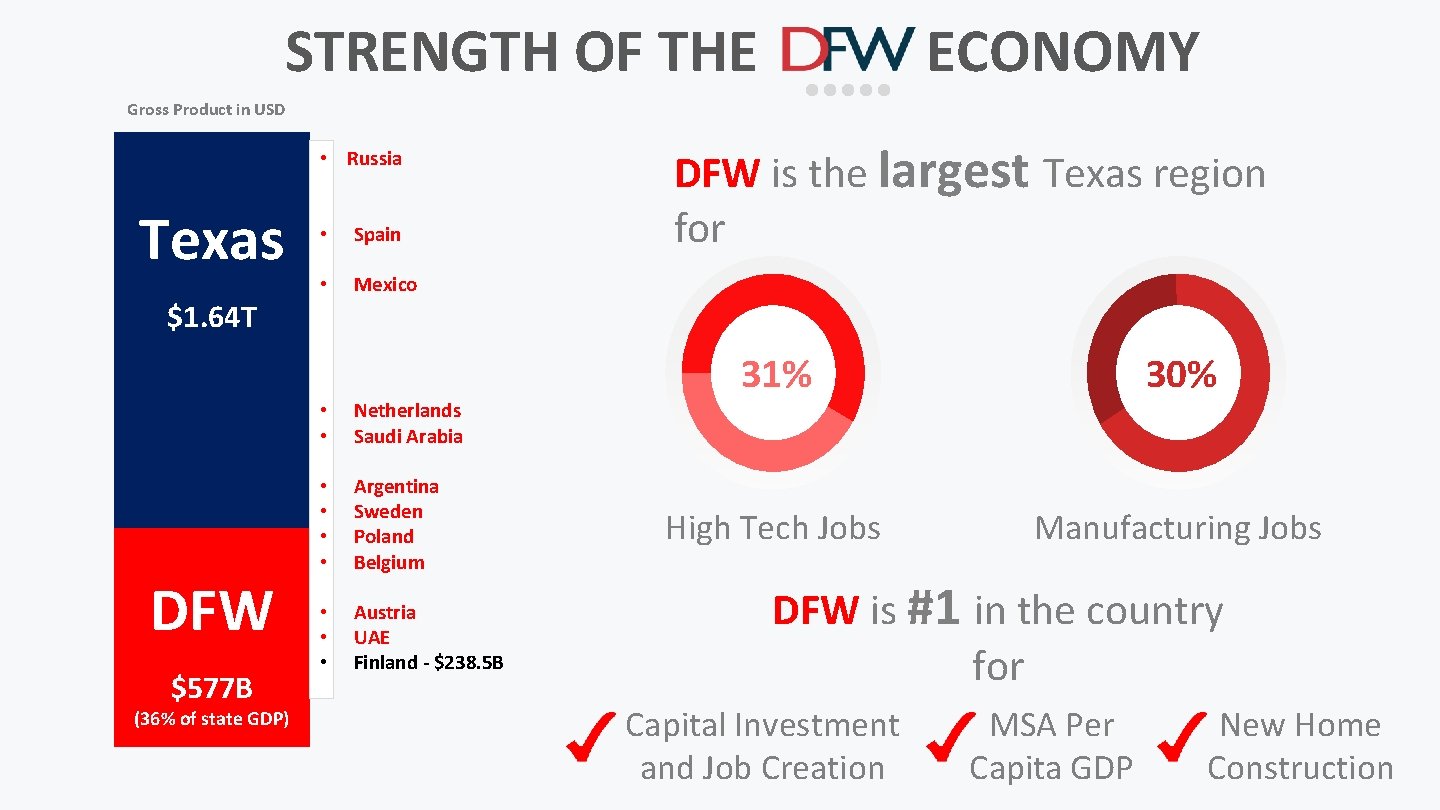
STRENGTH OF THE ECONOMY Gross Product in USD • Russia Texas • Spain • Mexico $1. 64 T DFW $577 B (36% of state GDP) • • Netherlands Saudi Arabia • • Argentina Sweden Poland Belgium • • • Austria UAE Finland - $238. 5 B DFW is the largest Texas region for 31% 30% High Tech Jobs Manufacturing Jobs DFW is #1 in the country for Capital Investment and Job Creation MSA Per Capita GDP New Home Construction
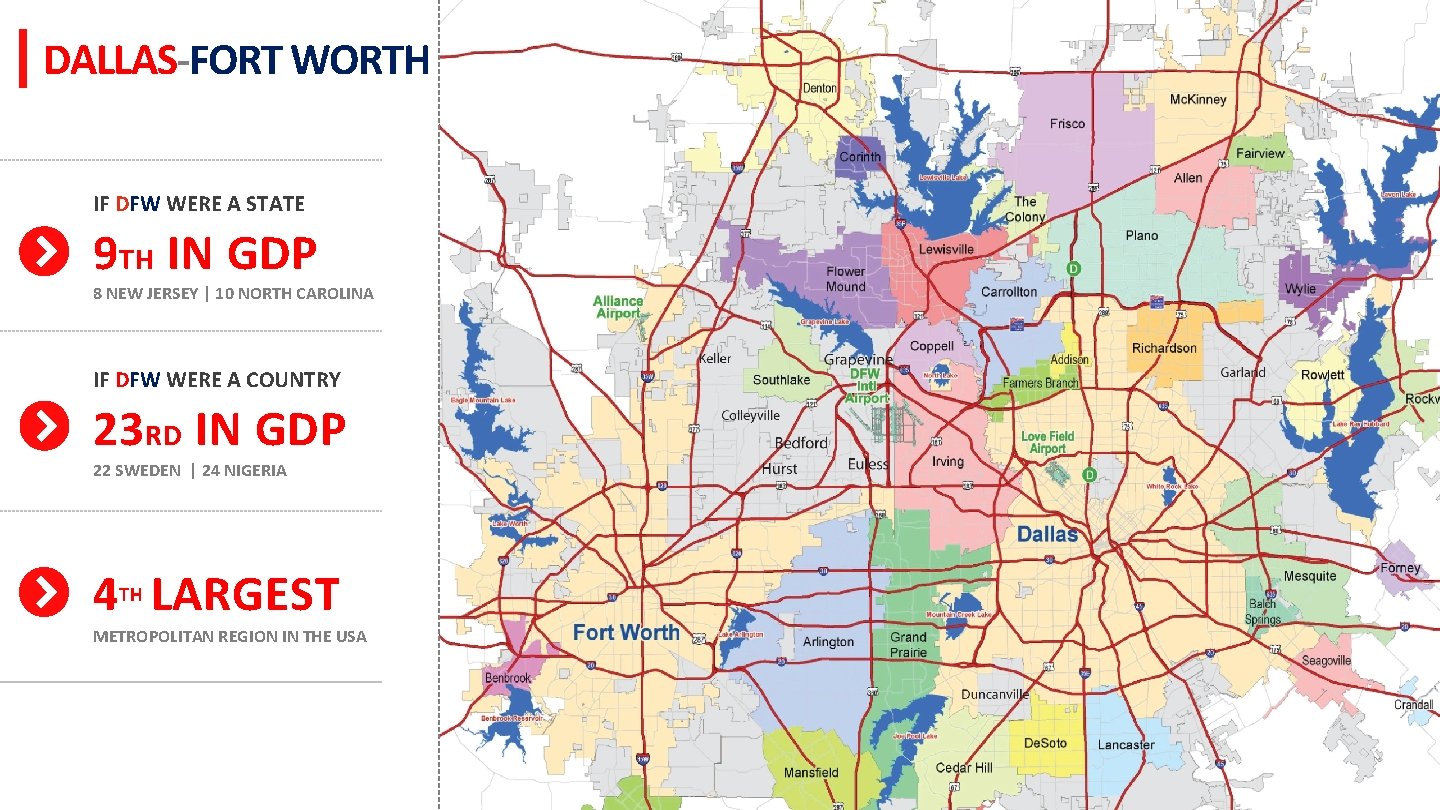
DALLAS-FORT WORTH IF DFW WERE A STATE 9 TH IN GDP 8 NEW JERSEY | 10 NORTH CAROLINA IF DFW WERE A COUNTRY 23 RD IN GDP 22 SWEDEN | 24 NIGERIA 4 LARGEST TH METROPOLITAN REGION IN THE USA
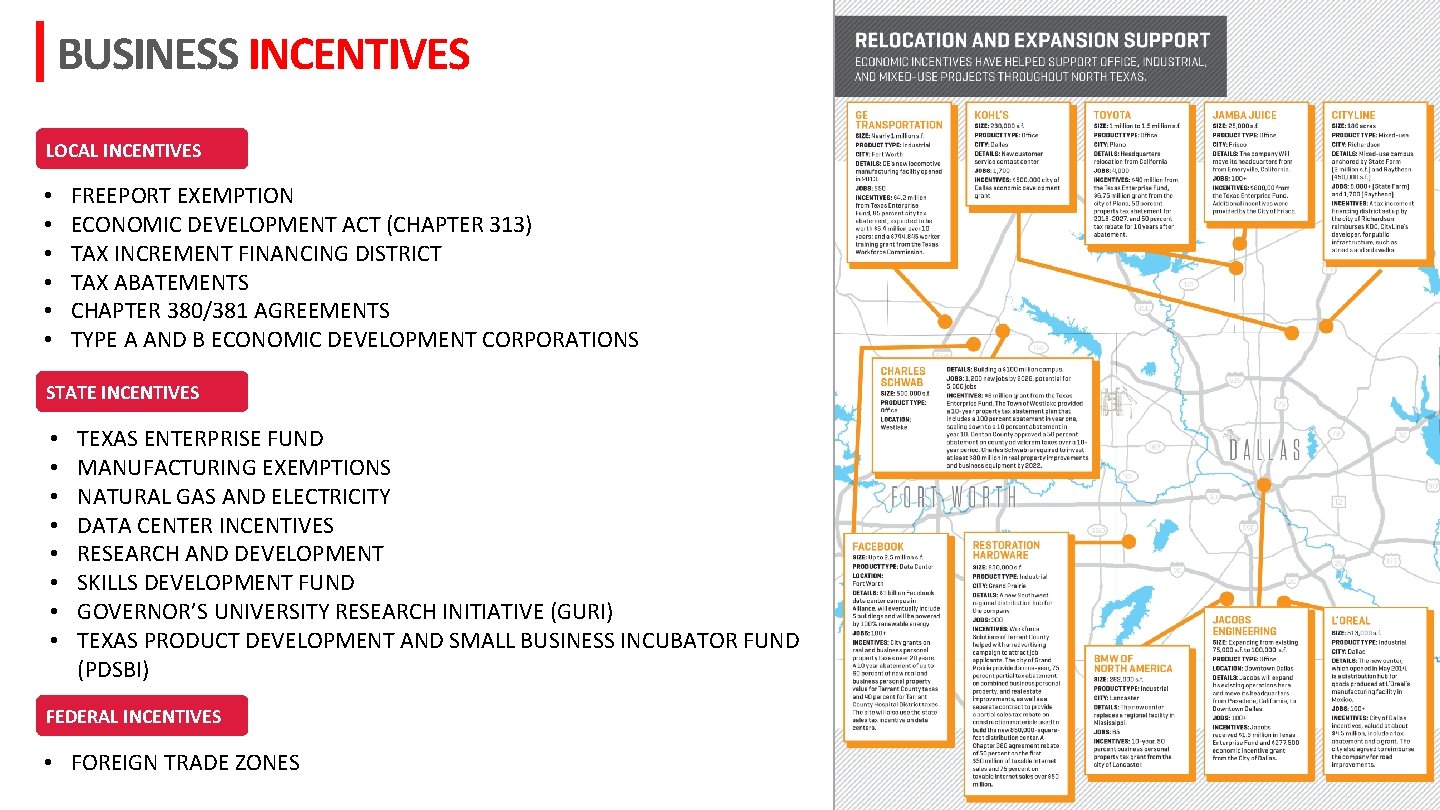
BUSINESS INCENTIVES LOCAL INCENTIVES • • • FREEPORT EXEMPTION ECONOMIC DEVELOPMENT ACT (CHAPTER 313) TAX INCREMENT FINANCING DISTRICT TAX ABATEMENTS CHAPTER 380/381 AGREEMENTS TYPE A AND B ECONOMIC DEVELOPMENT CORPORATIONS STATE INCENTIVES • • TEXAS ENTERPRISE FUND MANUFACTURING EXEMPTIONS NATURAL GAS AND ELECTRICITY DATA CENTER INCENTIVES RESEARCH AND DEVELOPMENT SKILLS DEVELOPMENT FUND GOVERNOR’S UNIVERSITY RESEARCH INITIATIVE (GURI) TEXAS PRODUCT DEVELOPMENT AND SMALL BUSINESS INCUBATOR FUND (PDSBI) FEDERAL INCENTIVES • FOREIGN TRADE ZONES
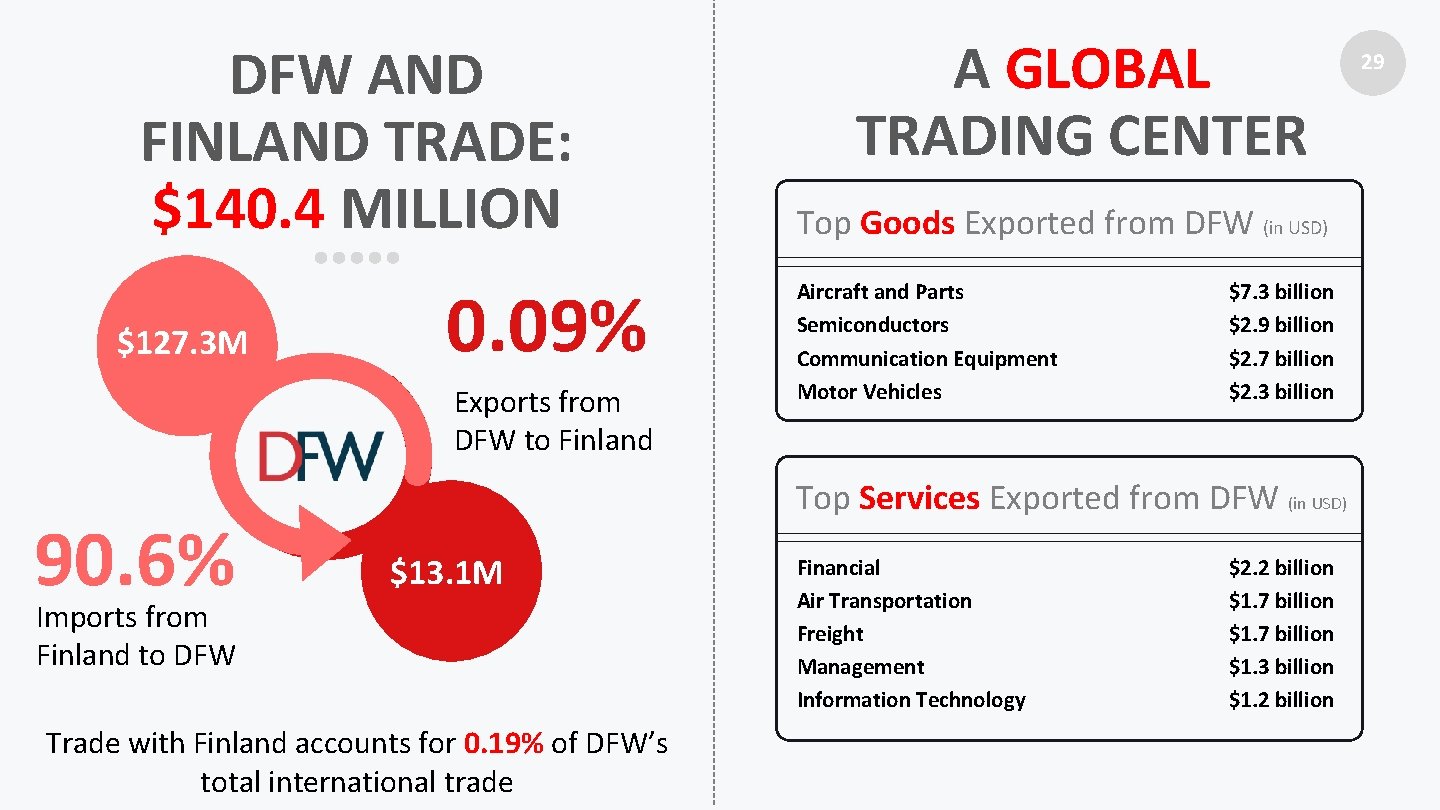
DFW AND FINLAND TRADE: $140. 4 MILLION $127. 3 M 0. 09% Exports from DFW to Finland 90. 6% A GLOBAL TRADING CENTER Top Goods Exported from DFW (in USD) Aircraft and Parts Semiconductors Communication Equipment Motor Vehicles $7. 3 billion $2. 9 billion $2. 7 billion $2. 3 billion Top Services Exported from DFW (in USD) $13. 1 M Imports from Finland to DFW Trade with Finland accounts for 0. 19% of DFW’s total international trade Financial Air Transportation Freight Management Information Technology $2. 2 billion $1. 7 billion $1. 3 billion $1. 2 billion 29
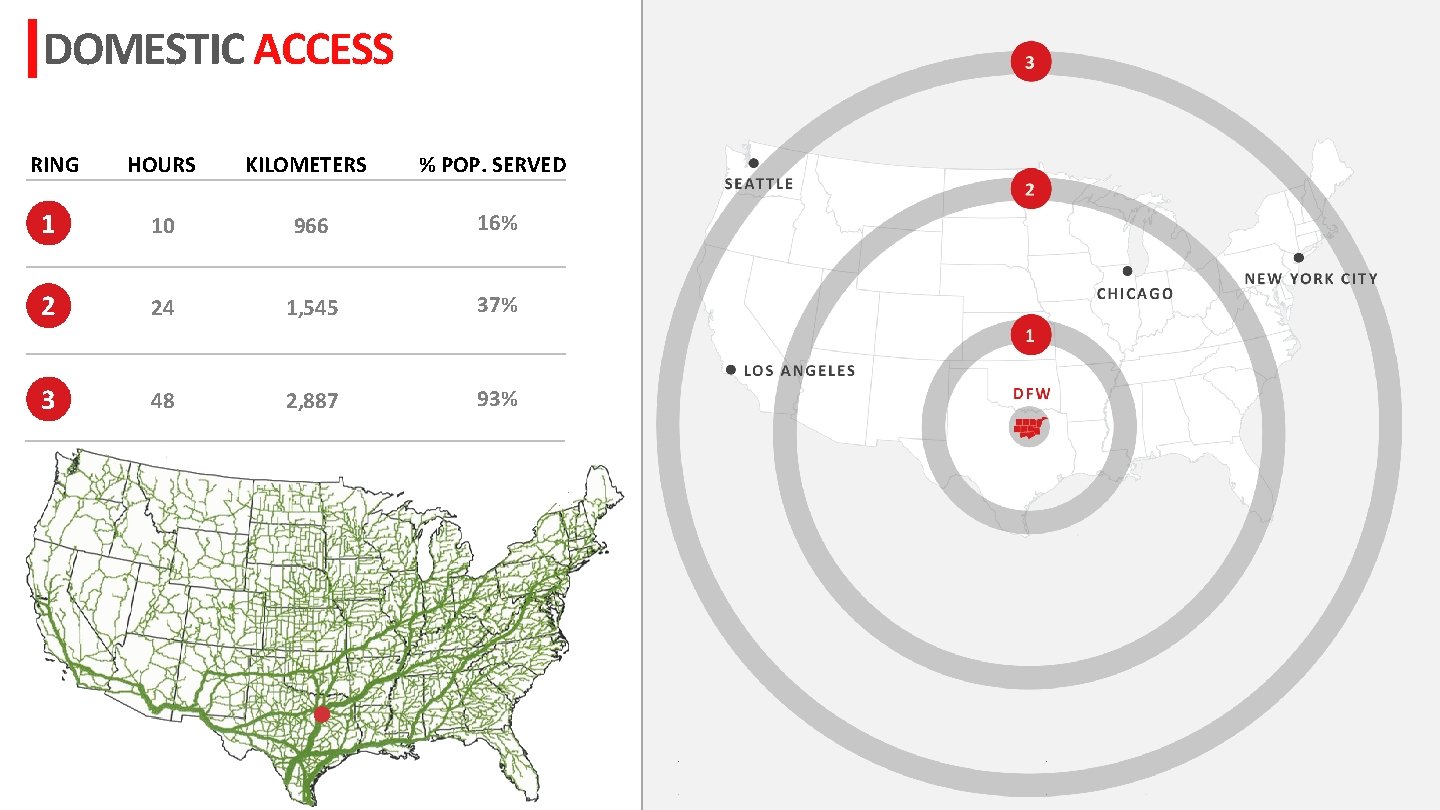
DOMESTIC ACCESS RING HOURS KILOMETERS % POP. SERVED 1 10 966 16% 2 24 1, 545 37% 3 48 2, 887 93%
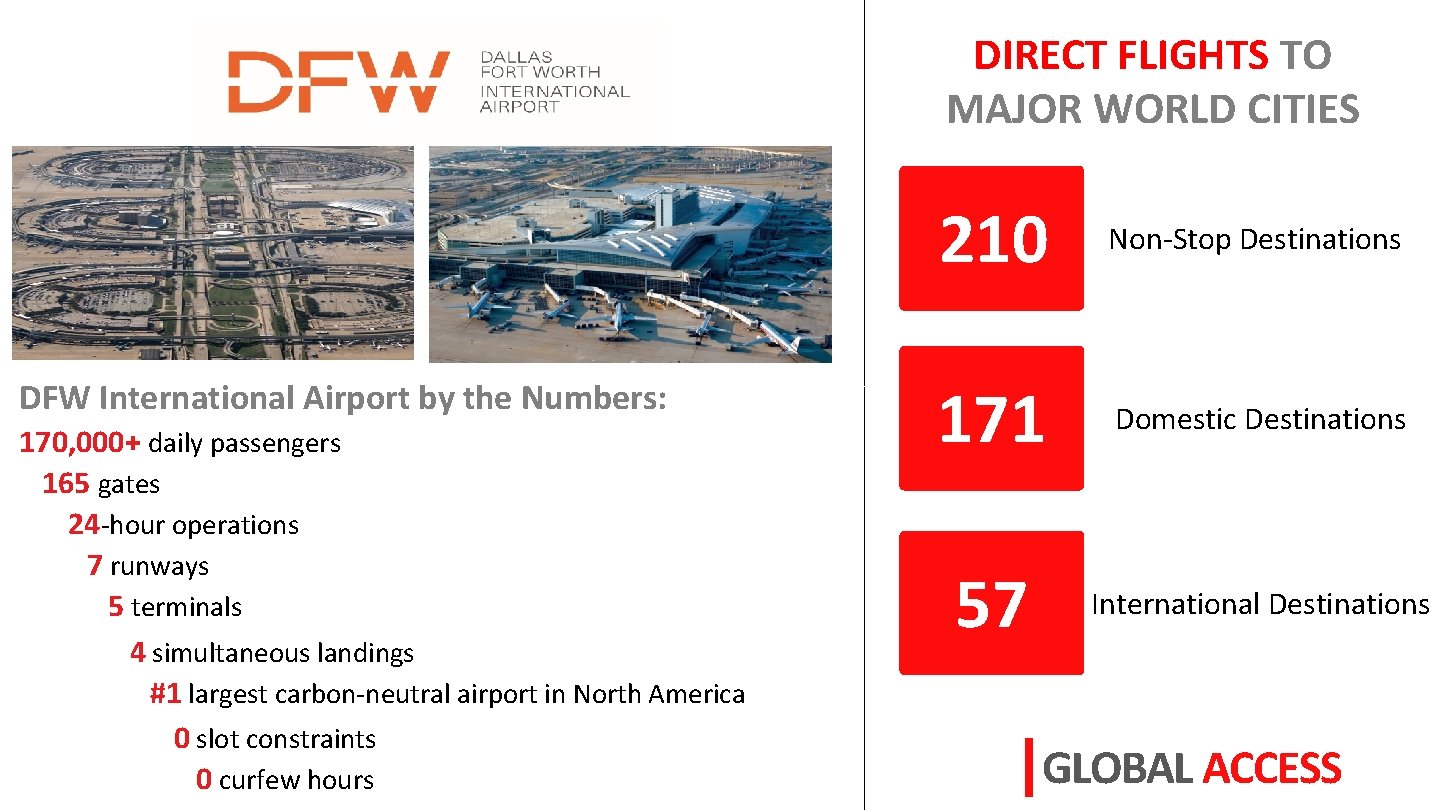
DIRECT FLIGHTS TO MAJOR WORLD CITIES DFW International Airport by the Numbers: 170, 000+ daily passengers 165 gates 24 -hour operations 7 runways 5 terminals 4 simultaneous landings #1 largest carbon-neutral airport in North America 0 slot constraints 0 curfew hours 210 Non-Stop Destinations 171 Domestic Destinations 57 International Destinations GLOBAL ACCESS
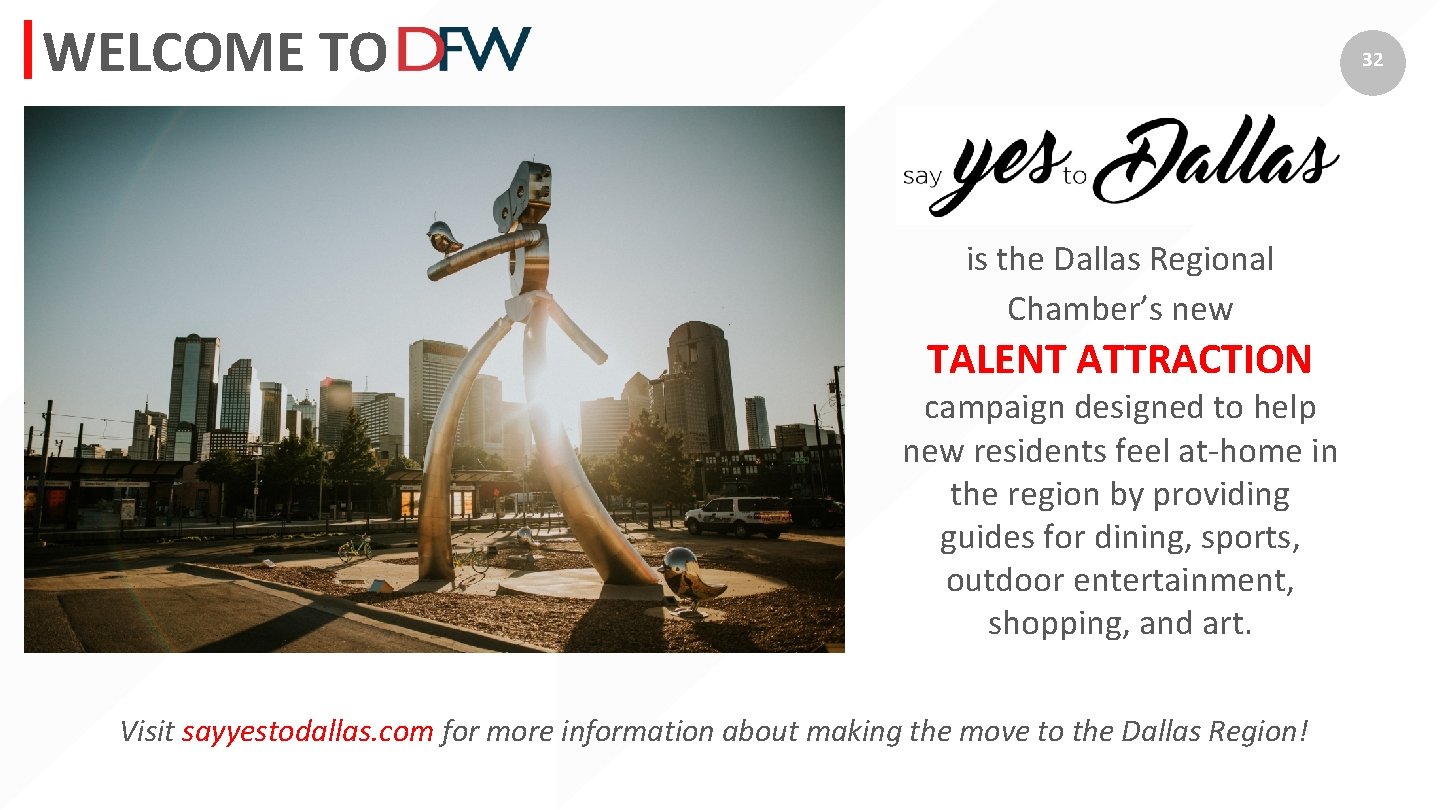
WELCOME TO 32 is the Dallas Regional Chamber’s new TALENT ATTRACTION campaign designed to help new residents feel at-home in the region by providing guides for dining, sports, outdoor entertainment, shopping, and art. Visit sayyestodallas. com for more information about making the move to the Dallas Region!
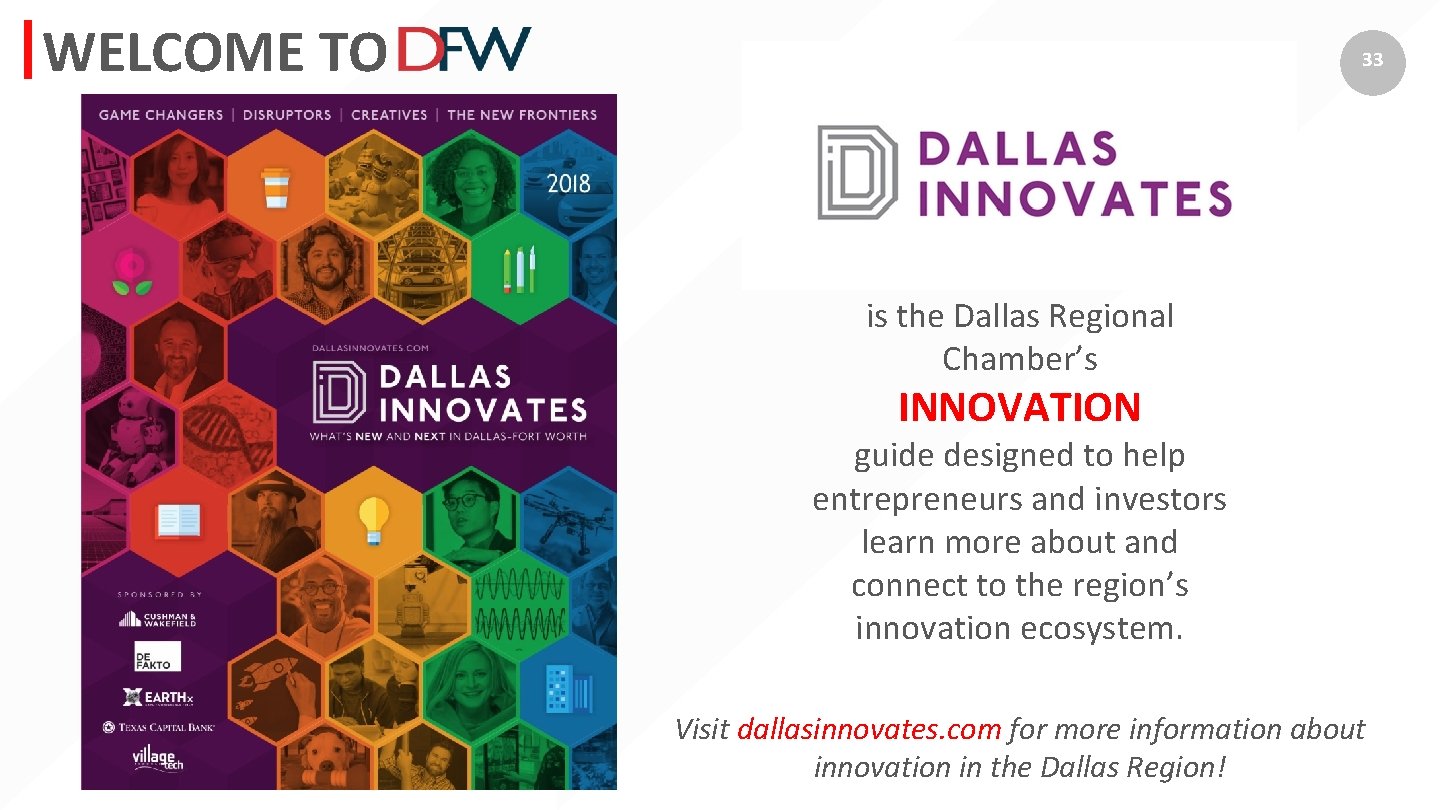
WELCOME TO 33 is the Dallas Regional Chamber’s INNOVATION guide designed to help entrepreneurs and investors learn more about and connect to the region’s innovation ecosystem. Visit dallasinnovates. com for more information about innovation in the Dallas Region!
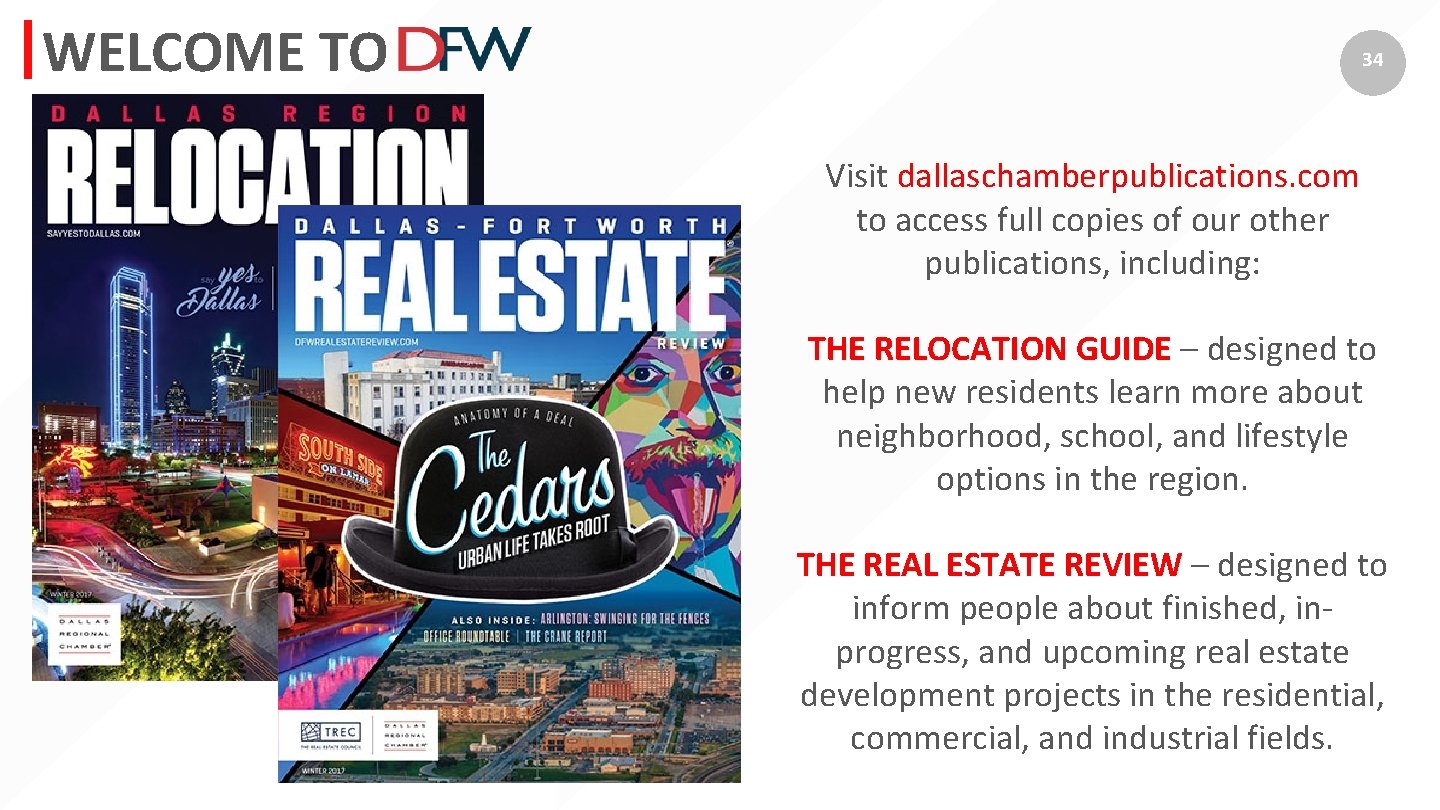
WELCOME TO 34 Visit dallaschamberpublications. com to access full copies of our other publications, including: THE RELOCATION GUIDE – designed to help new residents learn more about neighborhood, school, and lifestyle options in the region. THE REAL ESTATE REVIEW – designed to inform people about finished, inprogress, and upcoming real estate development projects in the residential, commercial, and industrial fields.
35 DALLAS – FORT WORTH WELCOMES FINNISH COMPANIES