Confidence Interval for a Population mean known ZInterval
- Slides: 17
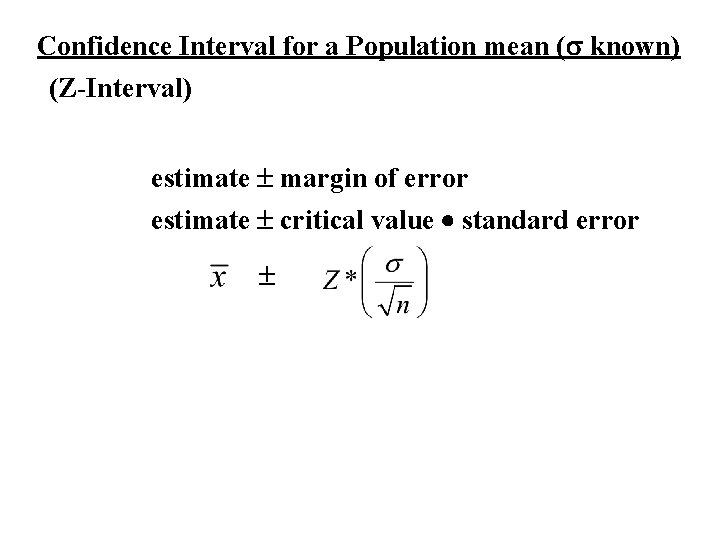
Confidence Interval for a Population mean ( known) (Z-Interval) estimate margin of error estimate critical value standard error
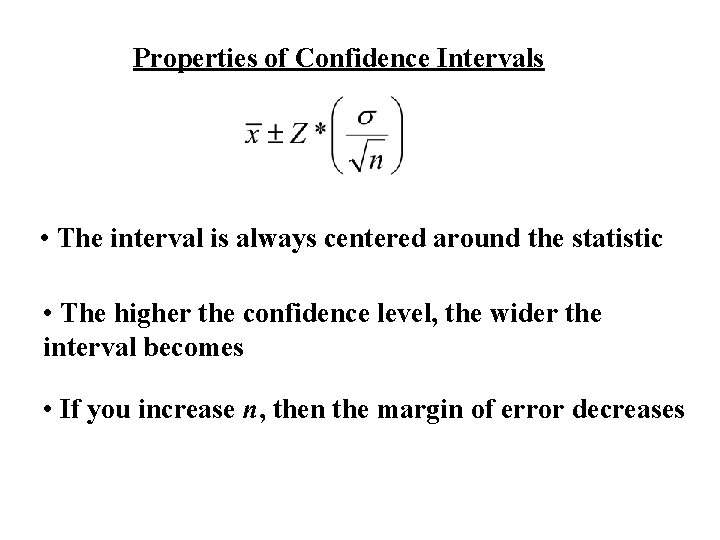
Properties of Confidence Intervals • The interval is always centered around the statistic • The higher the confidence level, the wider the interval becomes • If you increase n, then the margin of error decreases
Calculator Tip: Z-Interval Stat – Tests – ZInterval Data: If given actual values Stats: If given summary of values
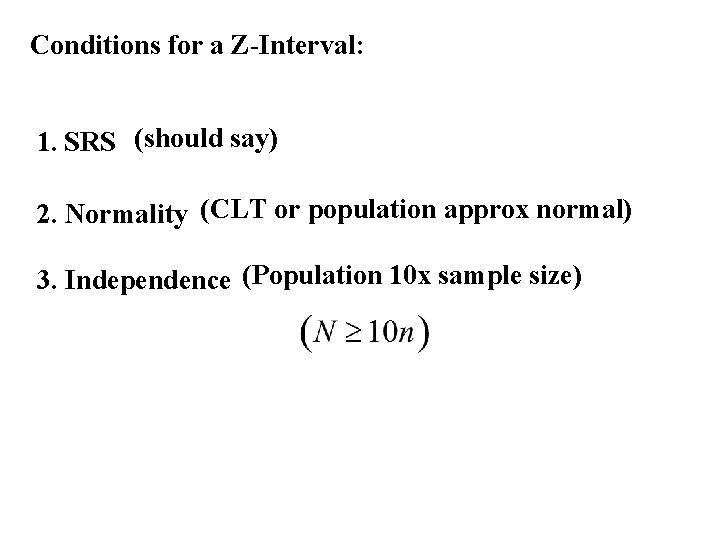
Conditions for a Z-Interval: 1. SRS (should say) 2. Normality (CLT or population approx normal) 3. Independence (Population 10 x sample size)
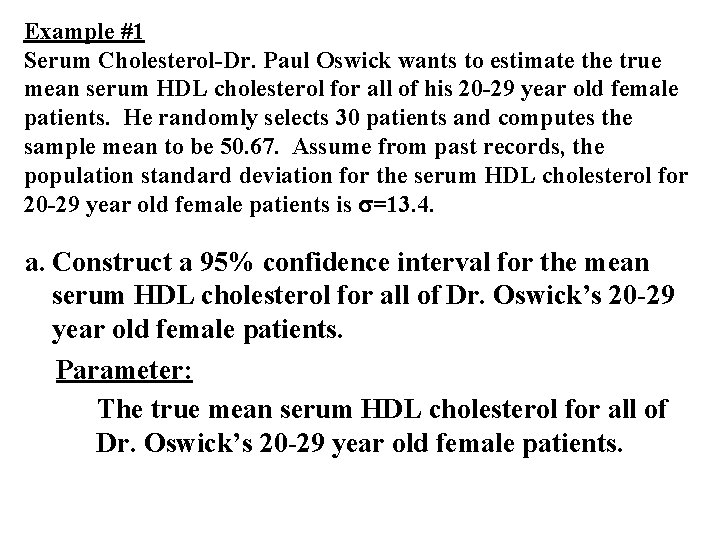
Example #1 Serum Cholesterol-Dr. Paul Oswick wants to estimate the true mean serum HDL cholesterol for all of his 20 -29 year old female patients. He randomly selects 30 patients and computes the sample mean to be 50. 67. Assume from past records, the population standard deviation for the serum HDL cholesterol for 20 -29 year old female patients is =13. 4. a. Construct a 95% confidence interval for the mean serum HDL cholesterol for all of Dr. Oswick’s 20 -29 year old female patients. Parameter: The true mean serum HDL cholesterol for all of Dr. Oswick’s 20 -29 year old female patients.
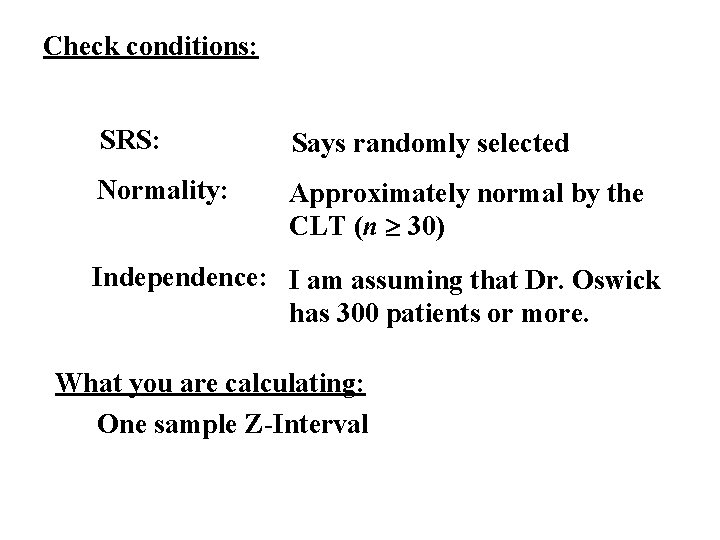
Check conditions: SRS: Says randomly selected Normality: Approximately normal by the CLT (n 30) Independence: I am assuming that Dr. Oswick has 300 patients or more. What you are calculating: One sample Z-Interval
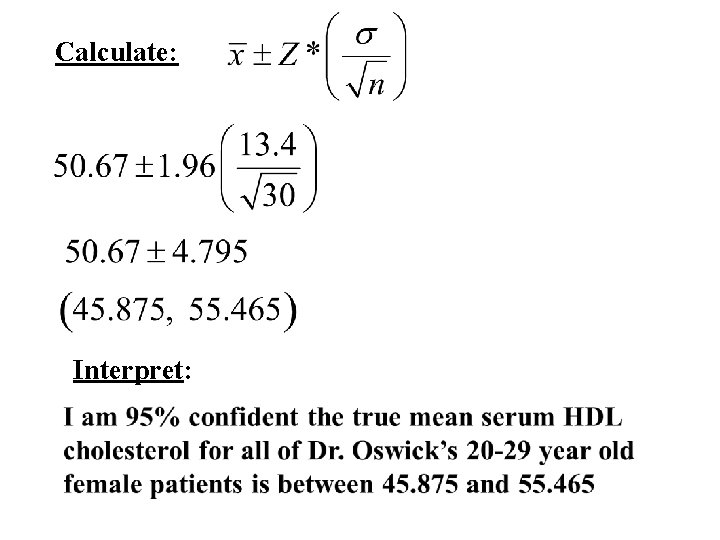
Calculate: Interpret:
Example #1 Serum Cholesterol-Dr. Paul Oswick wants to estimate the true mean serum HDL cholesterol for all of his 20 -29 year old female patients. He randomly selects 30 patients and computes the sample mean to be 50. 67. Assume from past records, the population standard deviation for the serum HDL cholesterol for 20 -29 year old female patients is =13. 4. b. If the US National Center for Health Statistics reports the mean serum HDL cholesterol for females between 20 -29 years old to be = 53, do Dr. Oswick’s patients appear to have a different serum level compared to the general population? Explain. No, 53 is contained in the interval.
Example #1 Serum Cholesterol-Dr. Paul Oswick wants to estimate the true mean serum HDL cholesterol for all of his 20 -29 year old female patients. He randomly selects 30 patients and computes the sample mean to be 50. 67. Assume from past records, the population standard deviation for the serum HDL cholesterol for 20 -29 year old female patients is =13. 4. c. What two things could you do to decrease your margin of error? Increase n Lower confidence level
Example #2 Suppose your class is investigating the weights of Snickers 1 ounce Fun-Size candy bars to see if customers are getting full value for their money. Assume that the weights are Normally distributed with standard deviation = 0. 05 ounces. Several candy bars are randomly selected and weighed with sensitive balances borrowed from the physics lab. The weights are 0. 95 1. 02 0. 98 0. 97 1. 05 1. 01 0. 98 1. 00 ounces. Determine a 90% confidence interval for the true mean, µ. Can you say that the bars weigh 1 oz on average? Parameter: The true mean weight of Snickers 1 -oz Fun-size candy bars
Check conditions: SRS: Says randomly selected Normality: Approximately normal because the population is approximately normal Independence: I am assuming that Snickers has 80 bars or more in the 1 -oz size What you are calculating: One sample Z-Interval
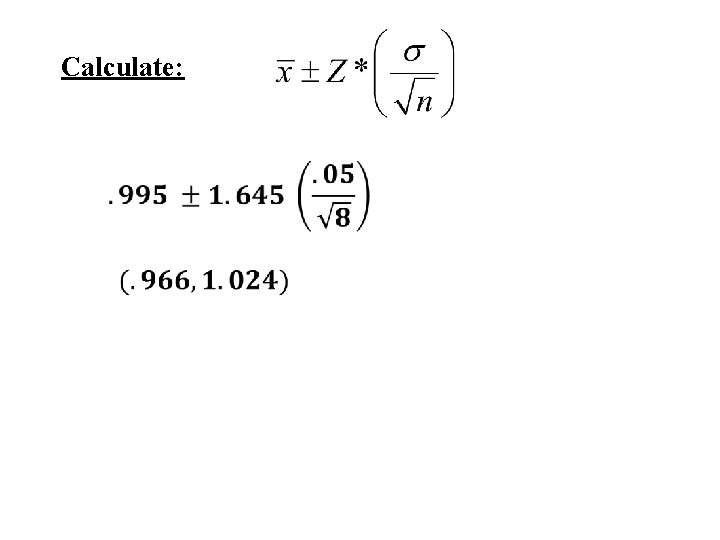
Calculate:
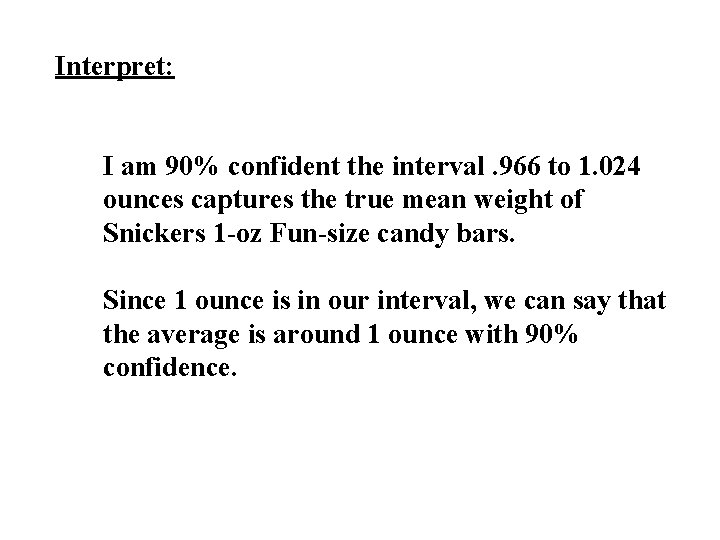
Interpret: I am 90% confident the interval. 966 to 1. 024 ounces captures the true mean weight of Snickers 1 -oz Fun-size candy bars. Since 1 ounce is in our interval, we can say that the average is around 1 ounce with 90% confidence.
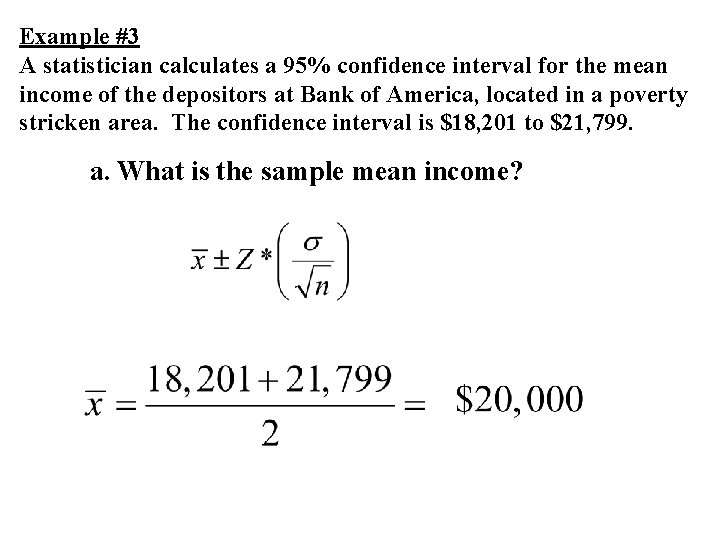
Example #3 A statistician calculates a 95% confidence interval for the mean income of the depositors at Bank of America, located in a poverty stricken area. The confidence interval is $18, 201 to $21, 799. a. What is the sample mean income?
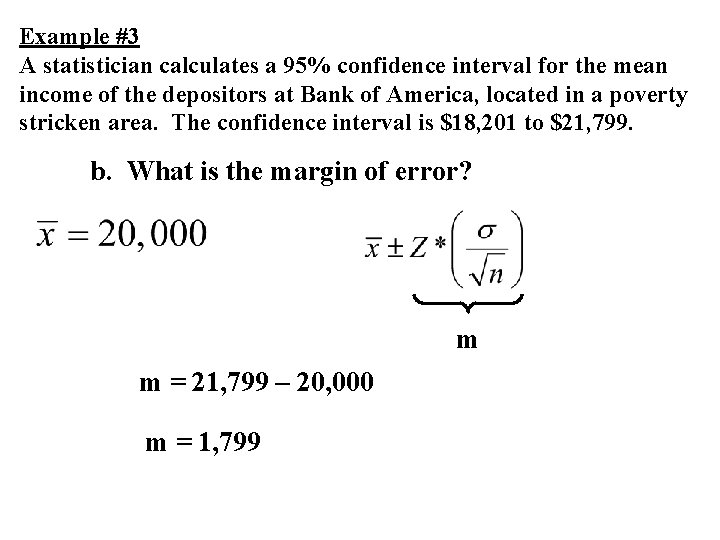
Example #3 A statistician calculates a 95% confidence interval for the mean income of the depositors at Bank of America, located in a poverty stricken area. The confidence interval is $18, 201 to $21, 799. b. What is the margin of error? m m = 21, 799 – 20, 000 m = 1, 799
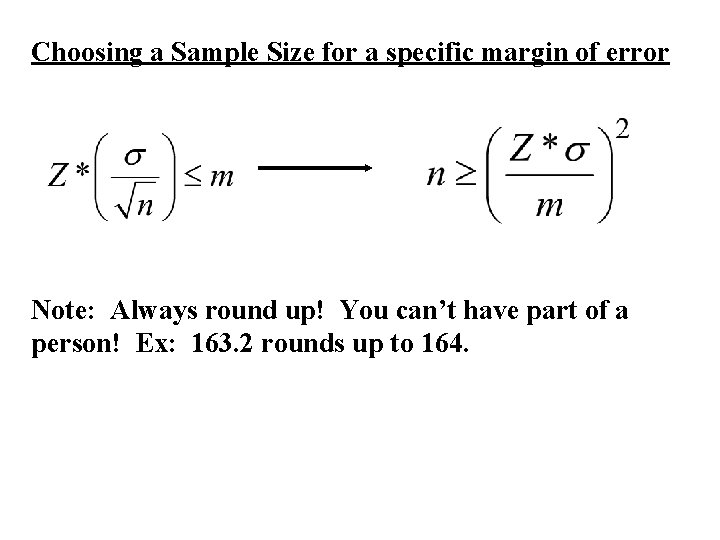
Choosing a Sample Size for a specific margin of error Note: Always round up! You can’t have part of a person! Ex: 163. 2 rounds up to 164.
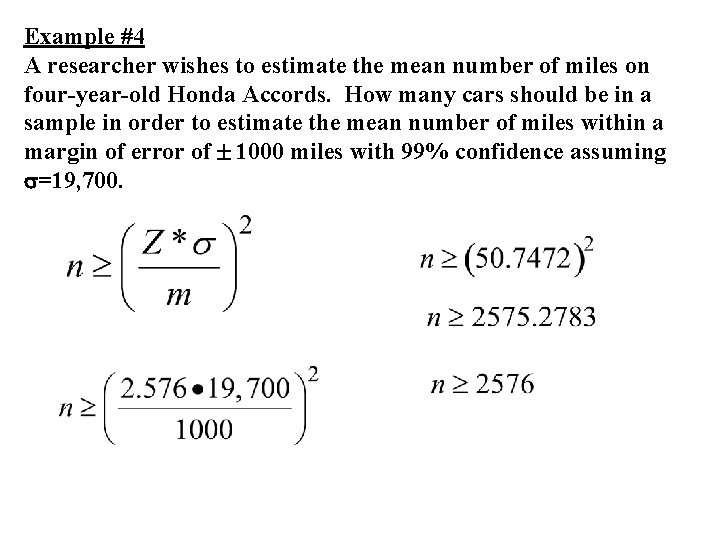
Example #4 A researcher wishes to estimate the mean number of miles on four-year-old Honda Accords. How many cars should be in a sample in order to estimate the mean number of miles within a margin of error of 1000 miles with 99% confidence assuming =19, 700.