Computing Spreadsheets Computing Year 56 Spreadsheets Ordering and


- Slides: 14
Computing Spreadsheets Computing | Year 5/6 | Spreadsheets | Ordering and Presenting | Lesson 2 Year One
• I can order and present data based on calculations. • I can enter a formula for a specific purpose. • I can use the fill tool to copy formulas. • I can insert a bar/column graph. • I can format aspects of a bar/column graph.
What could spreadsheets be used for? Number Calculations Creating Graphs Budget/Event Planning Scores Any other ideas? League Tables
Now that we know how to enter a formula, we can put it to use for a specific purpose. We will be looking at a spreadsheet for a league table. It could be for any sport such as Football, Rugby or in this case Hockey. Some information has been entered into this spreadsheet, based on a set of results, but the remaining columns need to be calculated.
What formulas may be needed to calculate these cells?
When you have completed your data, it can be presented as a graph. Click Insert, then choose Column Chart/Graph. Highlight the table from teams to points, including all rows. The Move Chart button on the Chart Design toolbar can then be used to position the chart as a New Sheet.
If you have time, you can format your graph in lots of ways using toolbar buttons such as Chart Layout or Chart Format, including: titles for axis; chart title; colours and gridlines. Always check that the chart makes sense. What is it showing? To remove unwanted data/columns from the graph (e. g. Matches, Won, Drawn, Lost) right click on any bar in the graph and choose ‘Select Data’. Here, columns can be added or removed as you wish.
Using the Hockey League Spreadsheet, try to complete the correct formula for the remaining cells. Insert and format a Column Graph to present the data.
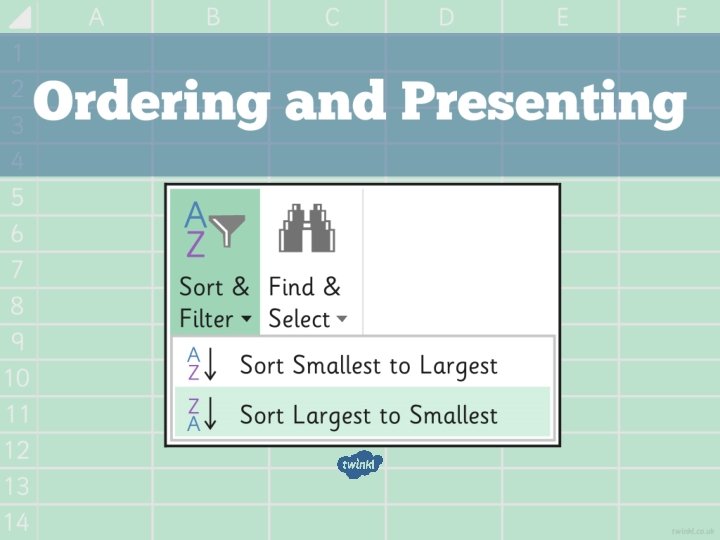
What is wrong with the order that the teams now appear? Here, they are alphabetical but usually they would be in order of performance in a league table. We can order data by highlighting and using a Sort tool. Watch how it is done, then try this with your spreadsheet.
First select your table of data, including column headings. In the drop down menu, select ‘Custom Sort’. Click on Sort & Filter. Choose how to sort your data and the Order.
What formula did you use in each column? Did everyone do the same? Be ready to answer the below questions, using your completed spreadsheet. Which team has the most/least points? Which team has the best/worst goal difference? Which team is currently in third place? How many points behind… are…?
• I can order and present data based on calculations. • I can enter a formula for a specific purpose. • I can use the fill tool to copy formulas. • I can insert a bar/column graph. • I can format aspects of a bar/column graph.