Comparative analysis of parameters of human senescence Natalia






- Slides: 31
Comparative analysis of parameters of human senescence Natalia S. Gavrilova Leonid A. Gavrilov Center on Aging, NORC/University of Chicago, 1155 East 60 th Street, Chicago, IL 60637
The idea of this study has been suggested by Fedor Severin in order to test whether aging is programmed or not.
The idea of this study is to compare variability for traits, which are known to be determined by the developmental program (such as ages at sexual maturity) with variability of traits related to aging (such as ages at menopause and death).
One of the arguments used by the opponents of programmed aging is a too high variation in individual lifespans compared to the observed variation of programmed events (such as the age of sexual maturation). n The main goal of this study was to test the validity of this argument.
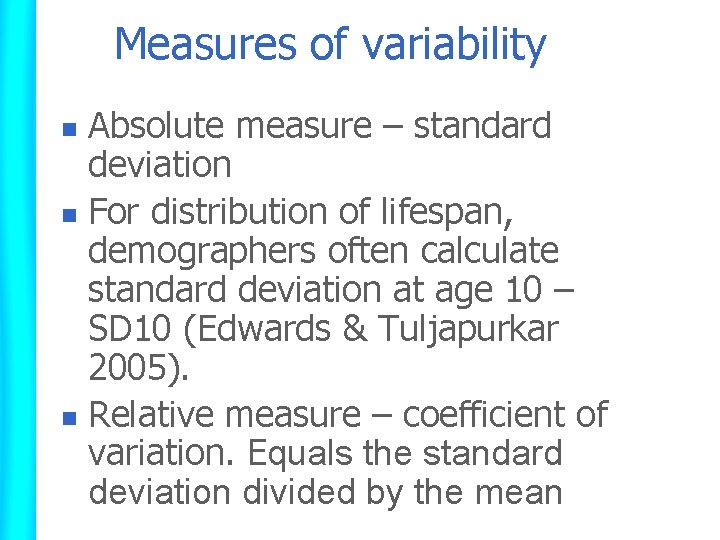
Measures of variability Absolute measure – standard deviation n For distribution of lifespan, demographers often calculate standard deviation at age 10 – SD 10 (Edwards & Tuljapurkar 2005). n Relative measure – coefficient of variation. Equals the standard deviation divided by the mean n
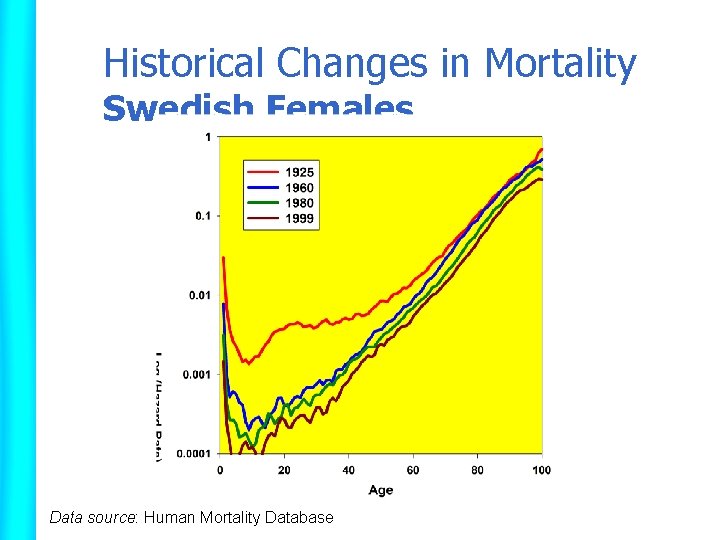
Historical Changes in Mortality Swedish Females Data source: Human Mortality Database
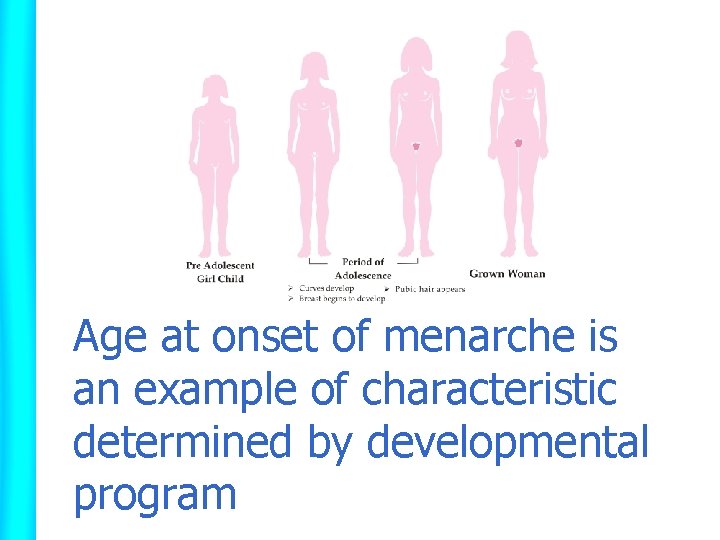
Age at onset of menarche is an example of characteristic determined by developmental program
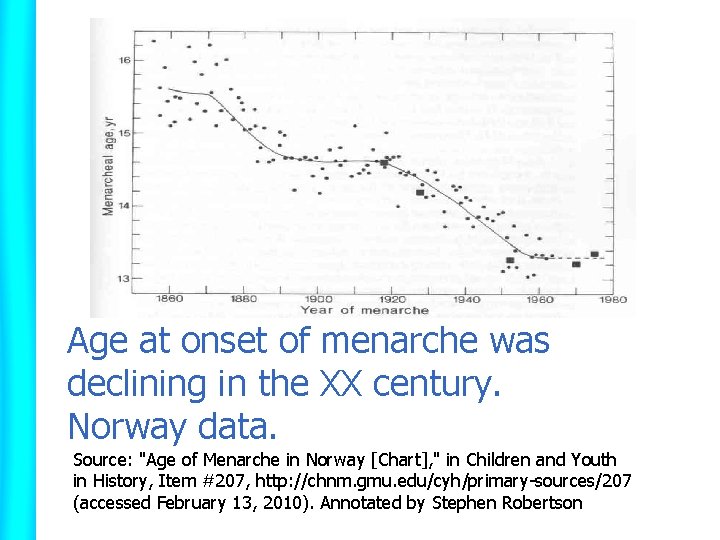
Age at onset of menarche was declining in the XX century. Norway data. Source: "Age of Menarche in Norway [Chart], " in Children and Youth in History, Item #207, http: //chnm. gmu. edu/cyh/primary-sources/207 (accessed February 13, 2010). Annotated by Stephen Robertson
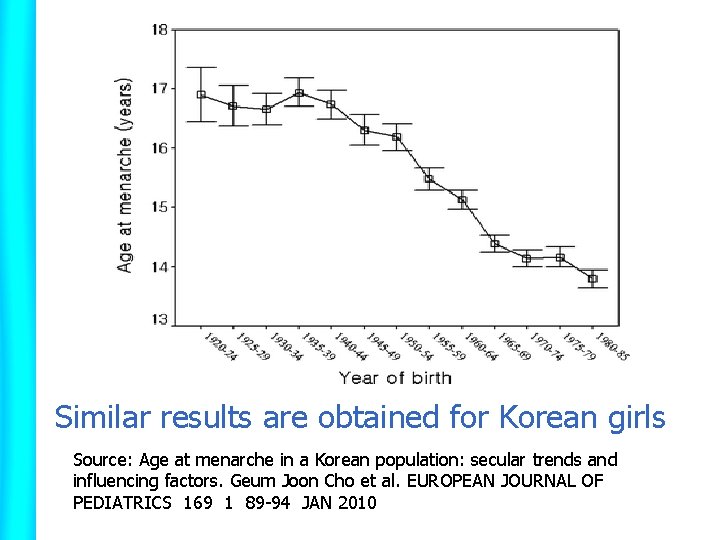
Similar results are obtained for Korean girls Source: Age at menarche in a Korean population: secular trends and influencing factors. Geum Joon Cho et al. EUROPEAN JOURNAL OF PEDIATRICS 169 1 89 -94 JAN 2010
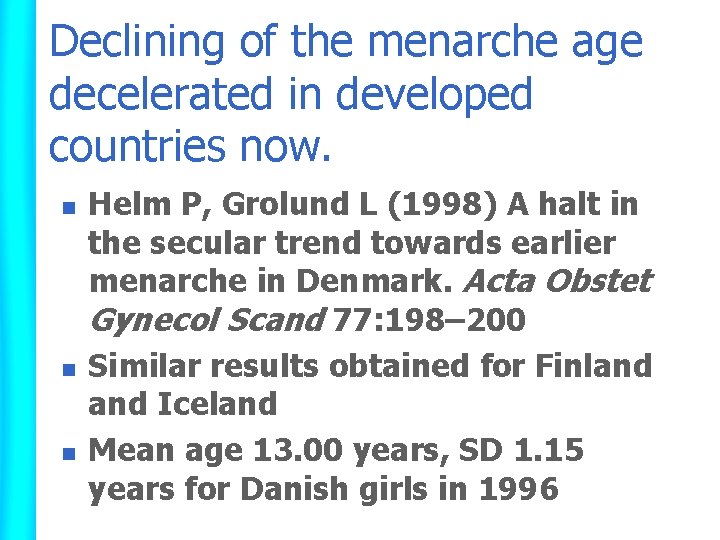
Declining of the menarche age decelerated in developed countries now. n n n Helm P, Grolund L (1998) A halt in the secular trend towards earlier menarche in Denmark. Acta Obstet Gynecol Scand 77: 198– 200 Similar results obtained for Finland Iceland Mean age 13. 00 years, SD 1. 15 years for Danish girls in 1996
What studies tell us about the variation of menarche age?
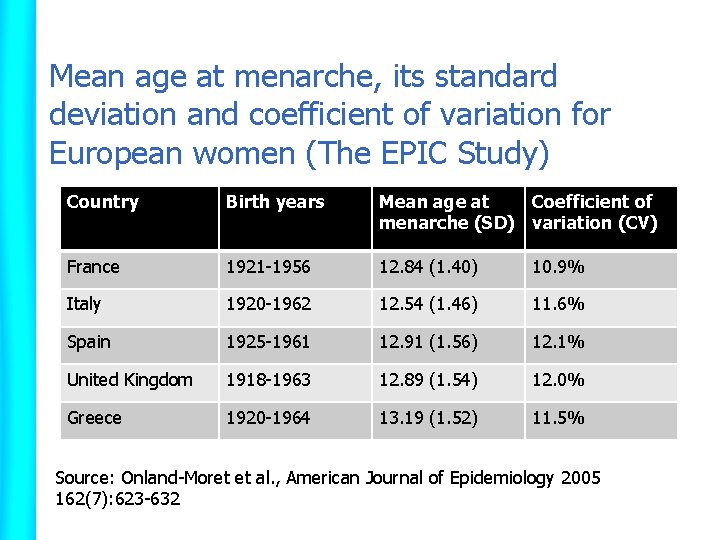
Mean age at menarche, its standard deviation and coefficient of variation for European women (The EPIC Study) Country Birth years Mean age at Coefficient of menarche (SD) variation (CV) France 1921 -1956 12. 84 (1. 40) 10. 9% Italy 1920 -1962 12. 54 (1. 46) 11. 6% Spain 1925 -1961 12. 91 (1. 56) 12. 1% United Kingdom 1918 -1963 12. 89 (1. 54) 12. 0% Greece 1920 -1964 13. 19 (1. 52) 11. 5% Source: Onland-Moret et al. , American Journal of Epidemiology 2005 162(7): 623 -632
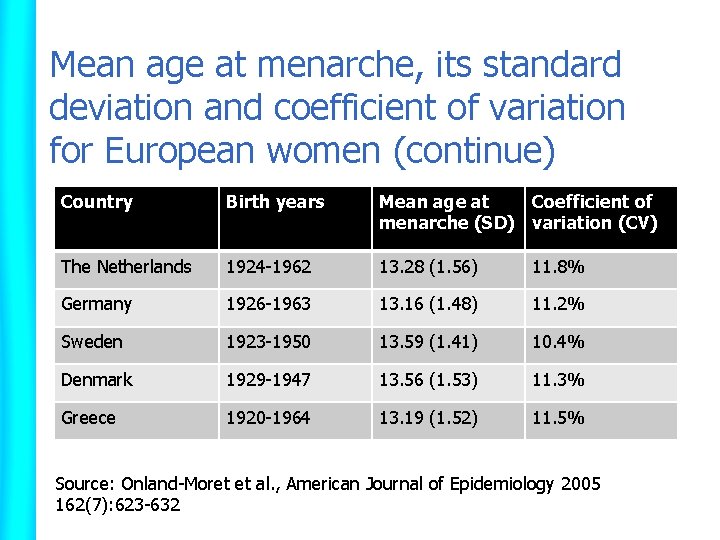
Mean age at menarche, its standard deviation and coefficient of variation for European women (continue) Country Birth years Mean age at Coefficient of menarche (SD) variation (CV) The Netherlands 1924 -1962 13. 28 (1. 56) 11. 8% Germany 1926 -1963 13. 16 (1. 48) 11. 2% Sweden 1923 -1950 13. 59 (1. 41) 10. 4% Denmark 1929 -1947 13. 56 (1. 53) 11. 3% Greece 1920 -1964 13. 19 (1. 52) 11. 5% Source: Onland-Moret et al. , American Journal of Epidemiology 2005 162(7): 623 -632
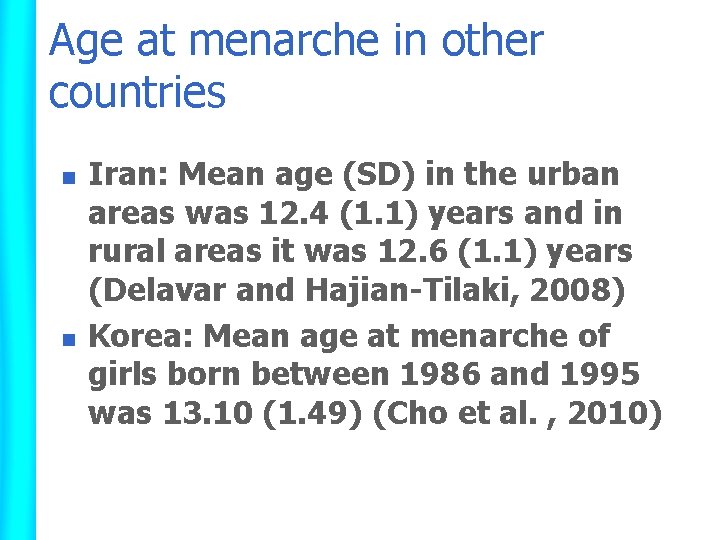
Age at menarche in other countries n n Iran: Mean age (SD) in the urban areas was 12. 4 (1. 1) years and in rural areas it was 12. 6 (1. 1) years (Delavar and Hajian-Tilaki, 2008) Korea: Mean age at menarche of girls born between 1986 and 1995 was 13. 10 (1. 49) (Cho et al. , 2010)
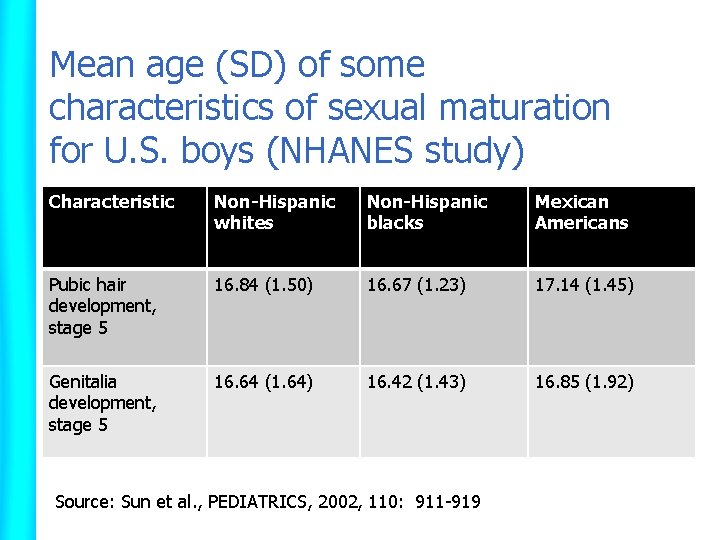
What about boys? n n Third National Health and Nutrition Examination Survey (NHANES III) Sexual maturity stages based on the recommendations of Tanner were assigned to each maturity indicator Pubic hair development using stages from 1 (immaturity) to 5 (complete maturity) Genitalia development using stages from 1 (immaturity) to 5 (complete maturity)
Mean age (SD) of some characteristics of sexual maturation for U. S. boys (NHANES study) Characteristic Non-Hispanic whites Non-Hispanic blacks Mexican Americans Pubic hair development, stage 5 16. 84 (1. 50) 16. 67 (1. 23) 17. 14 (1. 45) Genitalia development, stage 5 16. 64 (1. 64) 16. 42 (1. 43) 16. 85 (1. 92) Source: Sun et al. , PEDIATRICS, 2002, 110: 911 -919
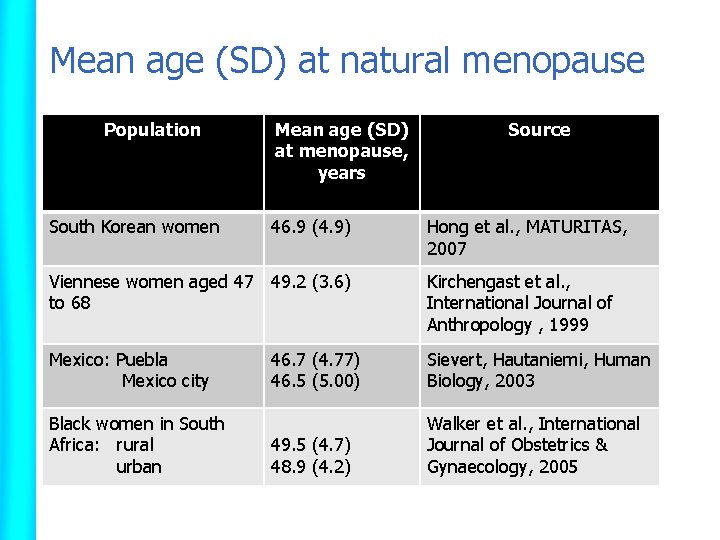
Age at natural menopause as a marker of reproductive aging
Mean age (SD) at natural menopause Population South Korean women Mean age (SD) at menopause, years 46. 9 (4. 9) Source Hong et al. , MATURITAS, 2007 Viennese women aged 47 49. 2 (3. 6) to 68 Kirchengast et al. , International Journal of Anthropology , 1999 Mexico: Puebla Mexico city 46. 7 (4. 77) 46. 5 (5. 00) Sievert, Hautaniemi, Human Biology, 2003 49. 5 (4. 7) 48. 9 (4. 2) Walker et al. , International Journal of Obstetrics & Gynaecology, 2005 Black women in South Africa: rural urban
Our results using the MIDUS study
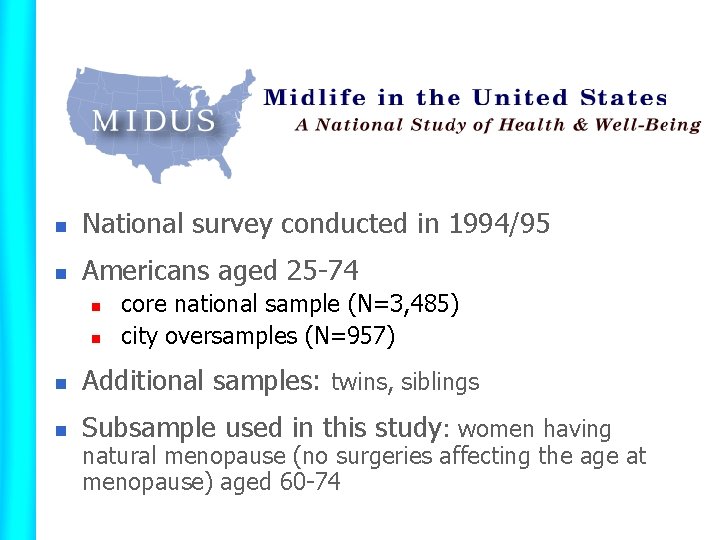
n National survey conducted in 1994/95 n Americans aged 25 -74 n n core national sample (N=3, 485) city oversamples (N=957) n Additional samples: twins, siblings n Subsample used in this study: women having natural menopause (no surgeries affecting the age at menopause) aged 60 -74
A 30 -40 minute telephone survey Number of respondents: 4, 242 A 114 page mail Number of respondents: 3, 690
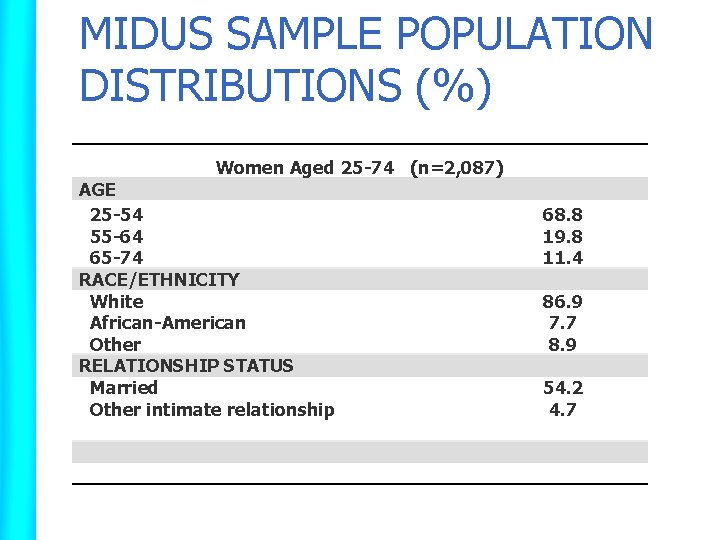
MIDUS SAMPLE POPULATION DISTRIBUTIONS (%) Women Aged 25 -74 (n=2, 087) AGE 25 -54 55 -64 65 -74 RACE/ETHNICITY White African-American Other RELATIONSHIP STATUS Married Other intimate relationship 68. 8 19. 8 11. 4 86. 9 7. 7 8. 9 54. 2 4. 7
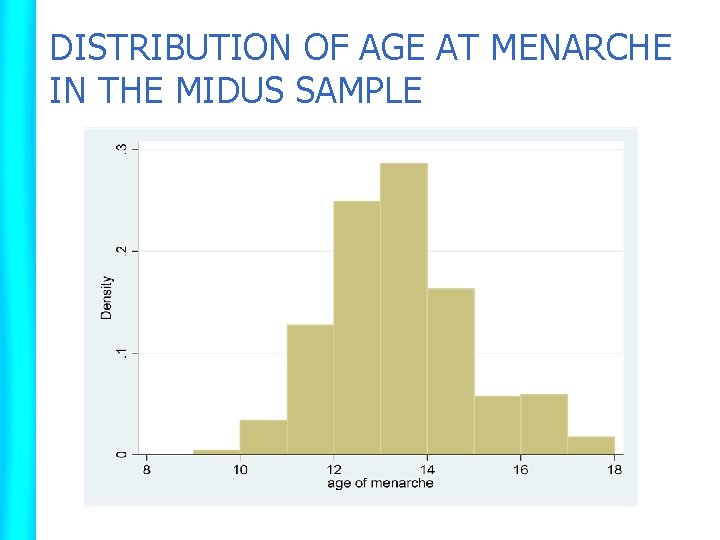
DISTRIBUTION OF AGE AT MENARCHE IN THE MIDUS SAMPLE
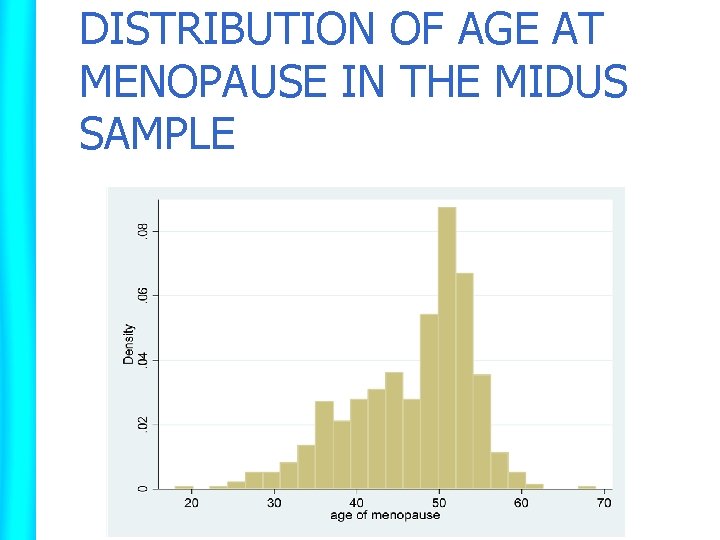
DISTRIBUTION OF AGE AT MENOPAUSE IN THE MIDUS SAMPLE
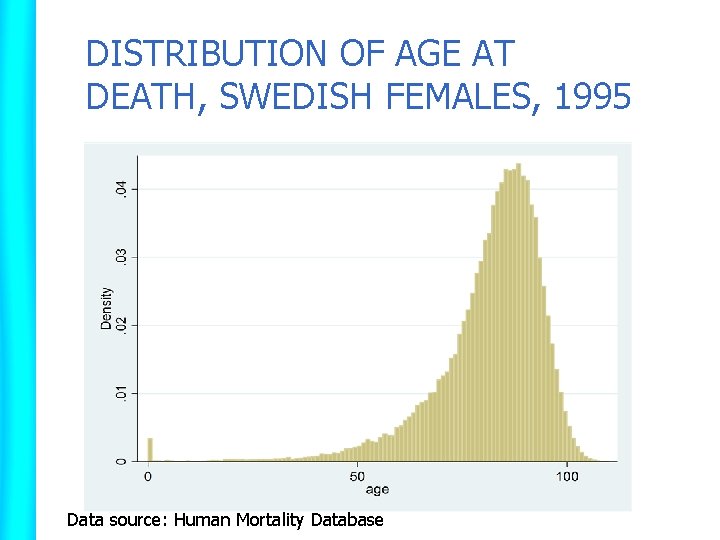
DISTRIBUTION OF AGE AT DEATH, SWEDISH FEMALES, 1995 Data source: Human Mortality Database
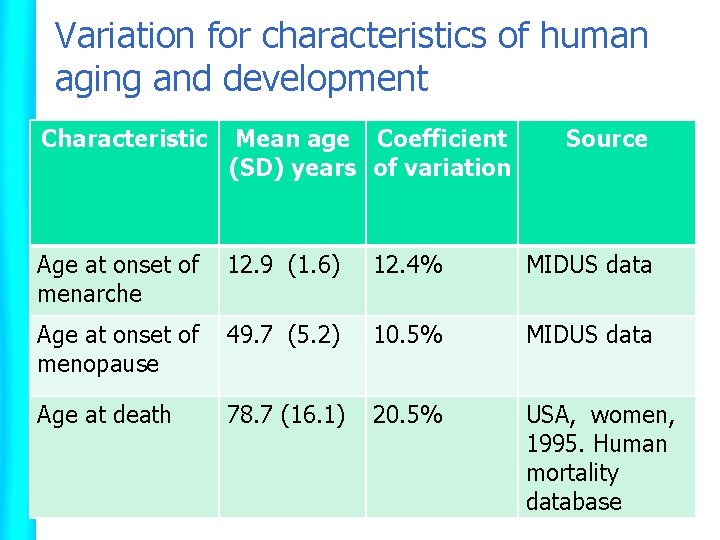
Variation for characteristics of human aging and development Characteristic Mean age Coefficient (SD) years of variation Source Age at onset of menarche 12. 9 (1. 6) 12. 4% MIDUS data Age at onset of menopause 49. 7 (5. 2) 10. 5% MIDUS data Age at death 78. 7 (16. 1) 20. 5% USA, women, 1995. Human mortality database
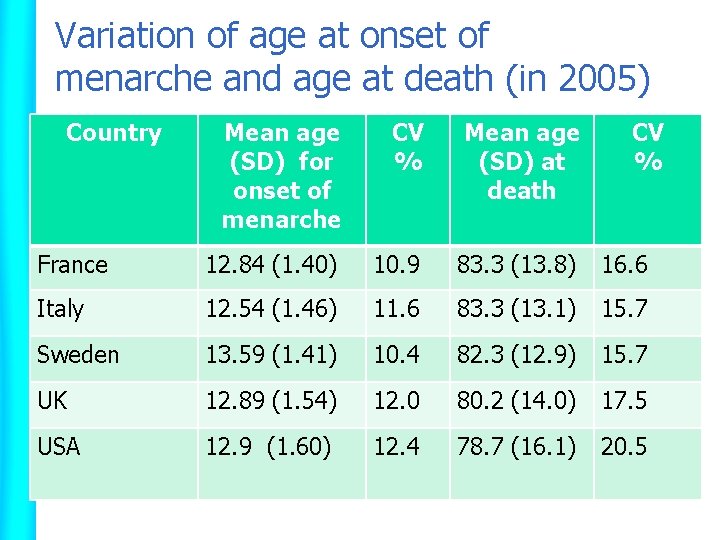
Variation of age at onset of menarche and age at death (in 2005) Country Mean age (SD) for onset of menarche CV % Mean age (SD) at death CV % France 12. 84 (1. 40) 10. 9 83. 3 (13. 8) 16. 6 Italy 12. 54 (1. 46) 11. 6 83. 3 (13. 1) 15. 7 Sweden 13. 59 (1. 41) 10. 4 82. 3 (12. 9) 15. 7 UK 12. 89 (1. 54) 12. 0 80. 2 (14. 0) 17. 5 USA 12. 9 (1. 60) 12. 4 78. 7 (16. 1) 20. 5
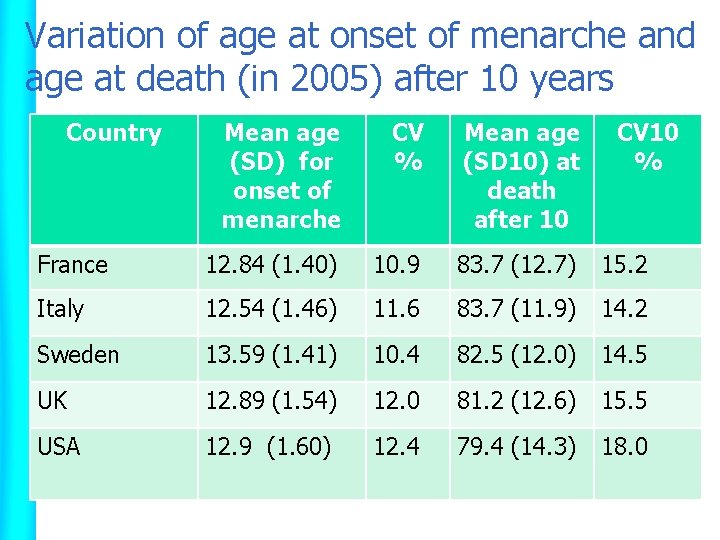
Variation of age at onset of menarche and age at death (in 2005) after 10 years Country Mean age (SD) for onset of menarche CV % Mean age (SD 10) at death after 10 CV 10 % France 12. 84 (1. 40) 10. 9 83. 7 (12. 7) 15. 2 Italy 12. 54 (1. 46) 11. 6 83. 7 (11. 9) 14. 2 Sweden 13. 59 (1. 41) 10. 4 82. 5 (12. 0) 14. 5 UK 12. 89 (1. 54) 12. 0 81. 2 (12. 6) 15. 5 USA 12. 9 (1. 60) 12. 4 79. 4 (14. 3) 18. 0
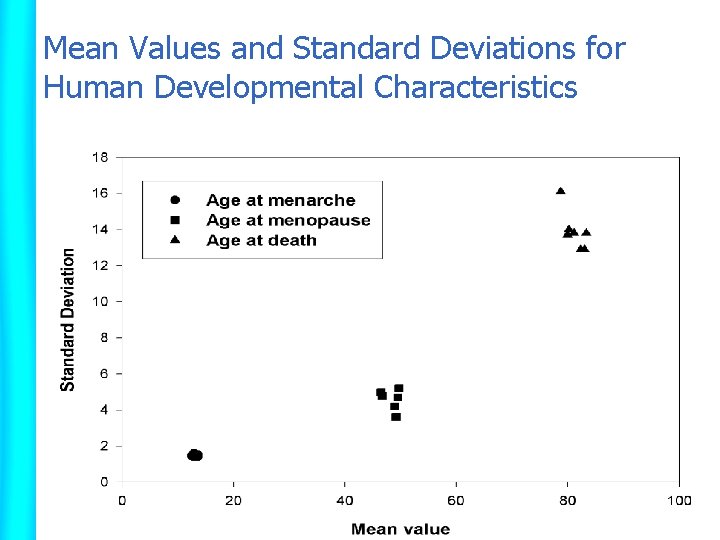
Mean Values and Standard Deviations for Human Developmental Characteristics
Conclusions n n Standard deviations for age at onset of menarche are about 10 times lower than standard deviations for ages at death Coefficients of variation for ages at onset of menarche and ages at death for contemporary populations are of the same order of magnitude
For More Information and Updates Visit Our Website: http: //longevity-science. org You are Welcome to Post Your Comments at our Blog: http: //longevity-science. blogspot. com/