CHAPTER 3 ANALYZING FINANCIAL STATEMENTS M Finance 3

- Slides: 39
CHAPTER 3 ANALYZING FINANCIAL STATEMENTS M: Finance 3 rd Edition Cornett, Adair, and Nofsinger Copyright © 2016 by Mc. Graw-Hill Education. All rights reserved.
Introduction • Financial Statement Use • Analyze firm performance • Develop plans to improve performance • Ratio Analysis • Used to assess firm’s performance
Five Groups of Financial Ratios • Liquidity • Asset management • Debt management • Profitability • Market value
Ratios Used to Make Comparisons • Trend • Comparison to the same firm over time • Competitors • Comparison to other firms in the same industry
Liquidity Ratios • Relationship between firm’s liquid (current) assets and current liabilities • Commonly-used liquidity ratios • Current ratio • Quick (or acid-test) ratio • Cash ratio
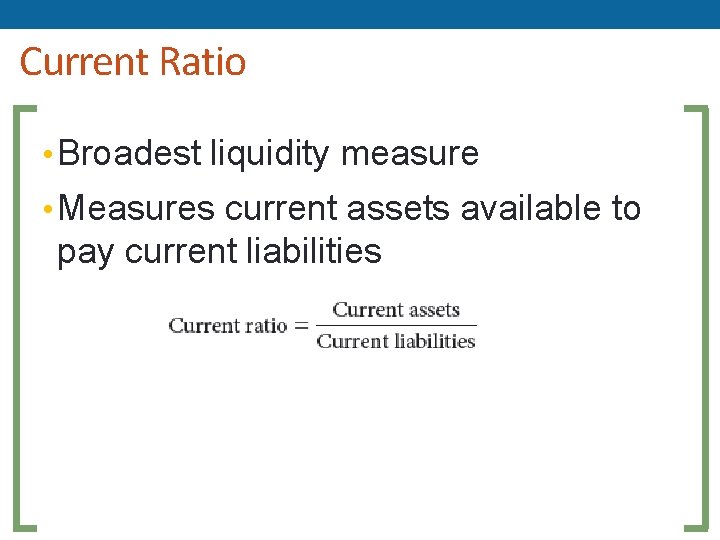
Current Ratio • Broadest liquidity measure • Measures current assets available to pay current liabilities
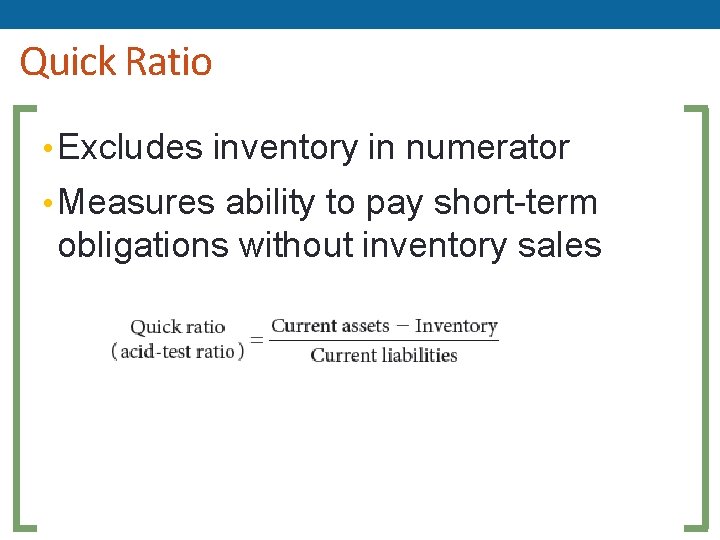
Quick Ratio • Excludes inventory in numerator • Measures ability to pay short-term obligations without inventory sales
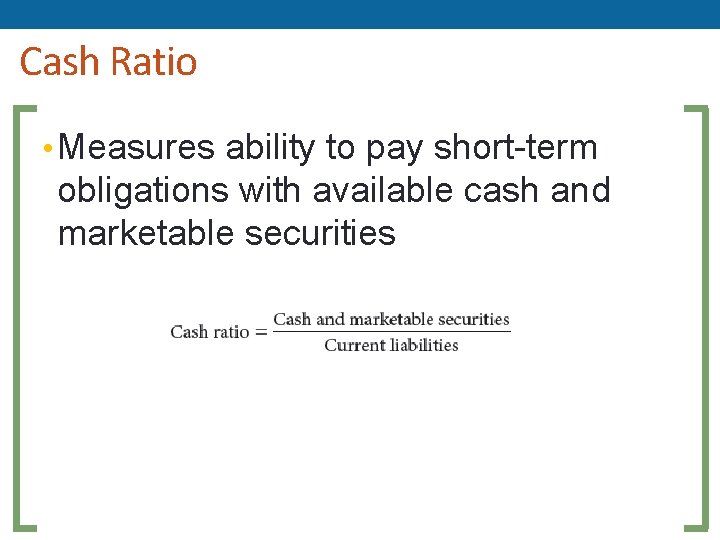
Cash Ratio • Measures ability to pay short-term obligations with available cash and marketable securities
Asset Management Ratios • Measure efficiency of firm’s asset use • Inventory • Accounts receivable • Fixed assets • Accounts payable management
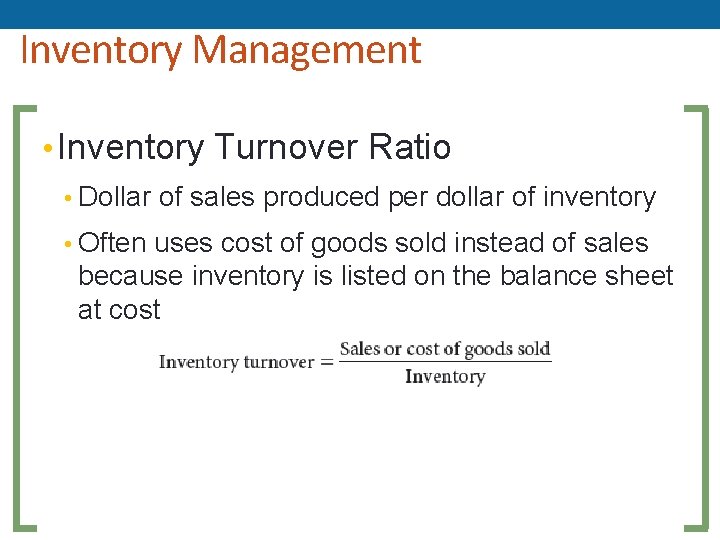
Inventory Management • Inventory Turnover Ratio • Dollar of sales produced per dollar of inventory • Often uses cost of goods sold instead of sales because inventory is listed on the balance sheet at cost
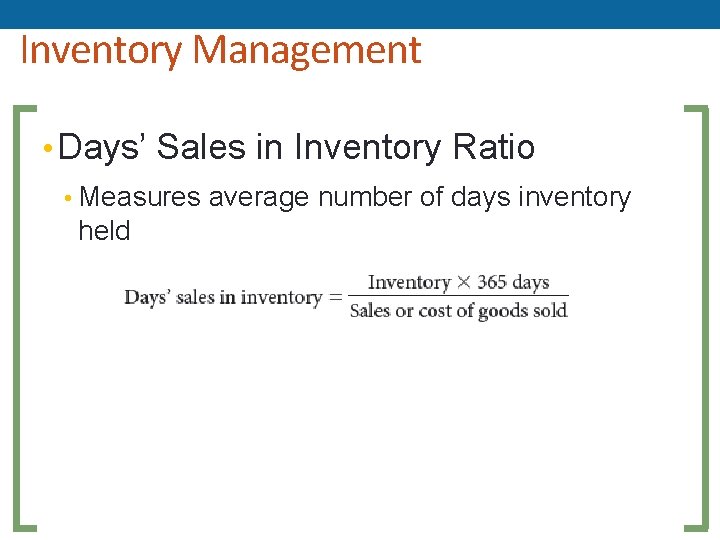
Inventory Management • Days’ Sales in Inventory Ratio • Measures average number of days inventory held
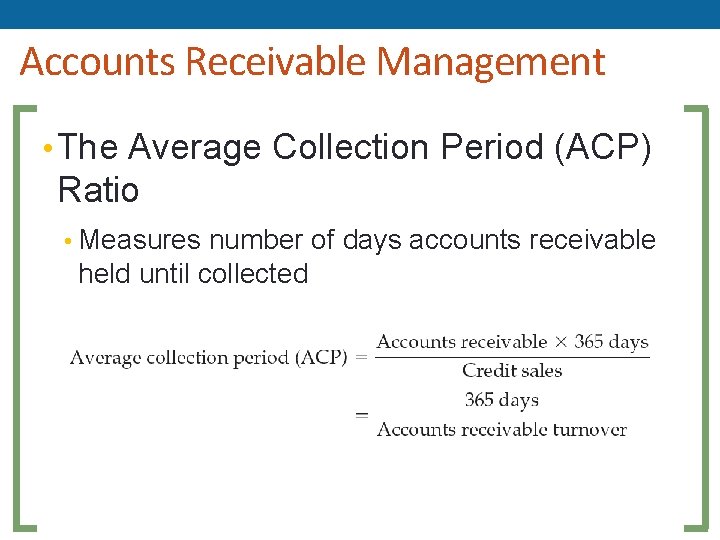
Accounts Receivable Management • The Average Collection Period (ACP) Ratio • Measures number of days accounts receivable held until collected
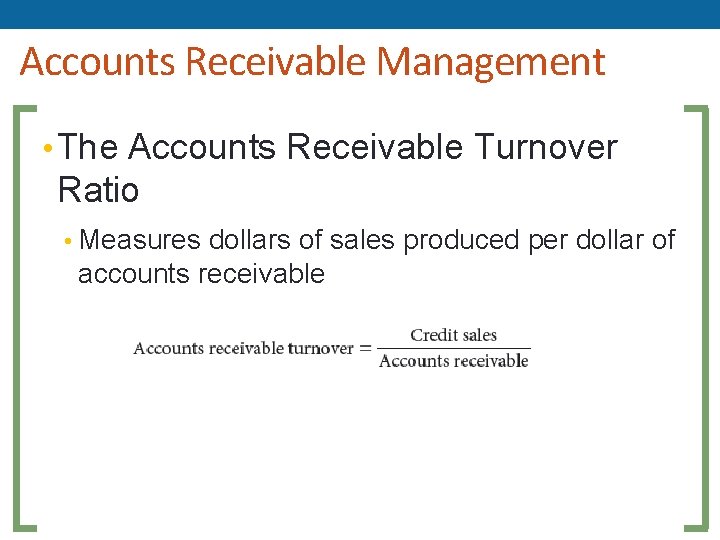
Accounts Receivable Management • The Accounts Receivable Turnover Ratio • Measures dollars of sales produced per dollar of accounts receivable
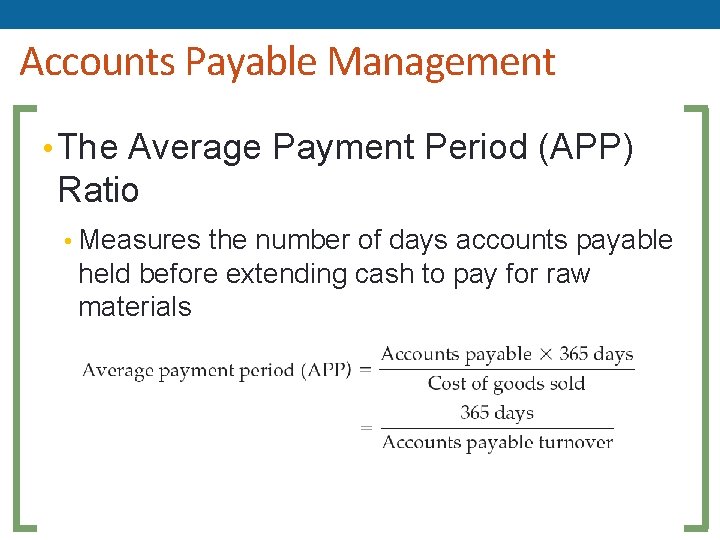
Accounts Payable Management • The Average Payment Period (APP) Ratio • Measures the number of days accounts payable held before extending cash to pay for raw materials
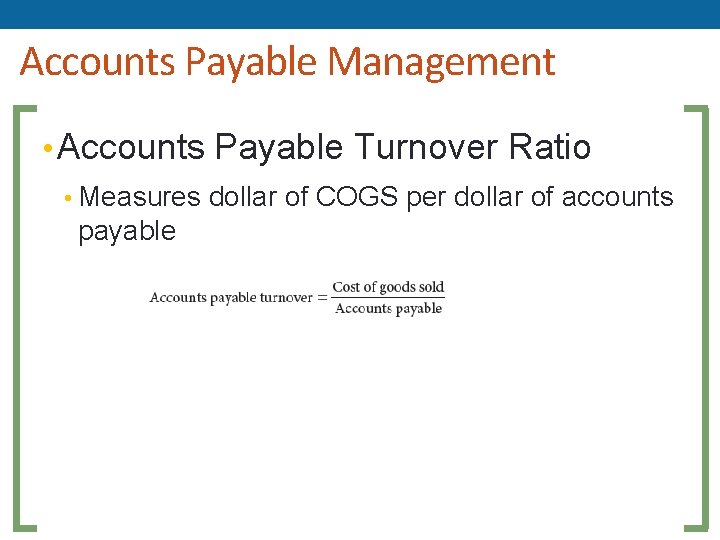
Accounts Payable Management • Accounts Payable Turnover Ratio • Measures dollar of COGS per dollar of accounts payable
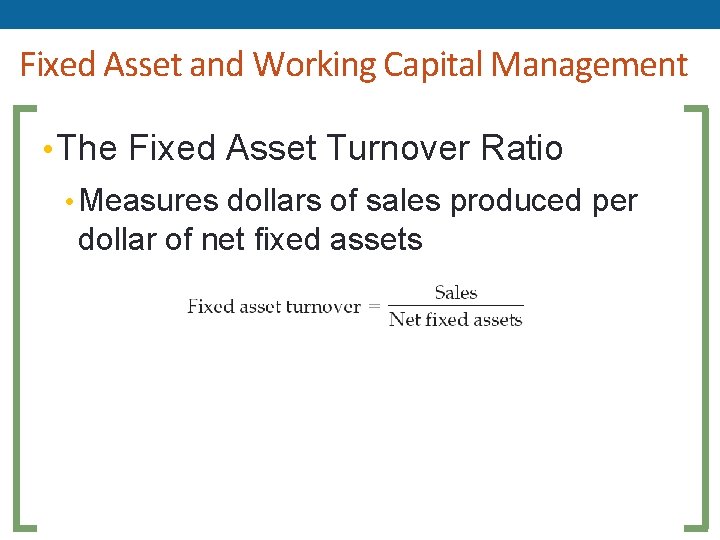
Fixed Asset and Working Capital Management • The Fixed Asset Turnover Ratio • Measures dollars of sales produced per dollar of net fixed assets
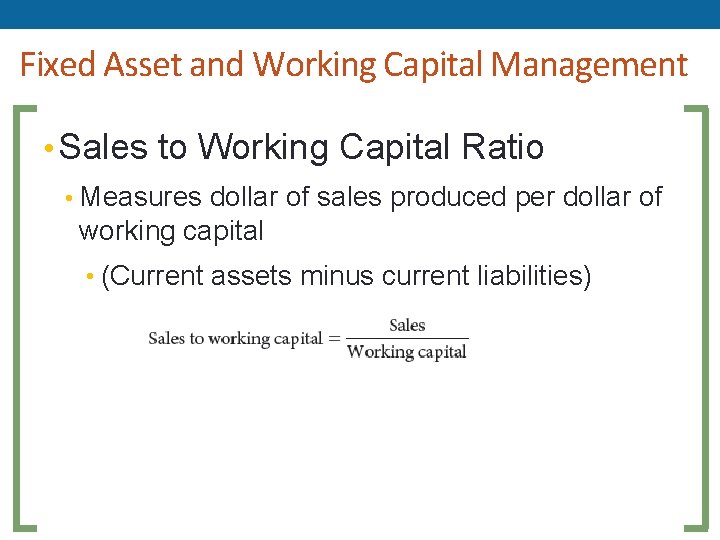
Fixed Asset and Working Capital Management • Sales to Working Capital Ratio • Measures dollar of sales produced per dollar of working capital • (Current assets minus current liabilities)
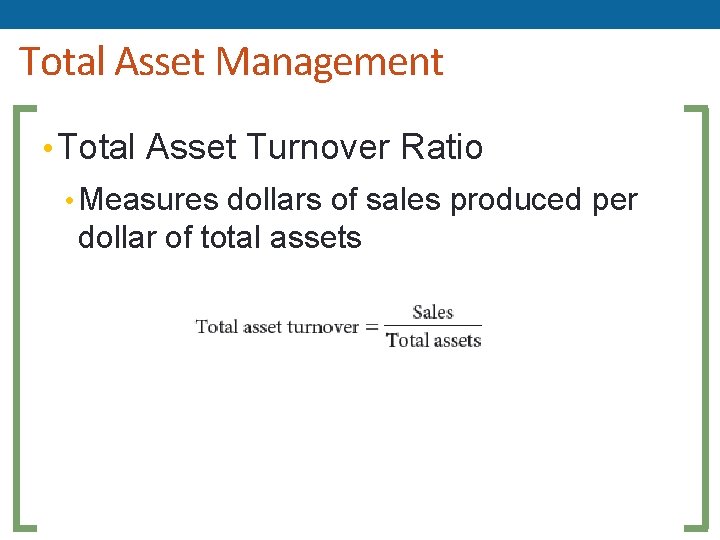
Total Asset Management • Total Asset Turnover Ratio • Measures dollars of sales produced per dollar of total assets
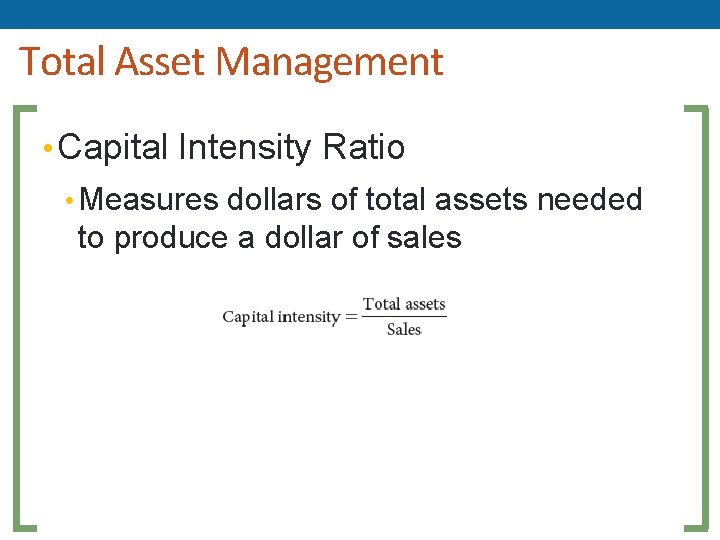
Total Asset Management • Capital Intensity Ratio • Measures dollars of total assets needed to produce a dollar of sales
Debt Management Ratios • Two major ratio types • Measure debt amount • Measure firm’s ability to service debt
Debt vs. Equity Financing • Three measures • Debt Ratio • Debt-to-Equity Ratio • Equity Multiplier Ratio
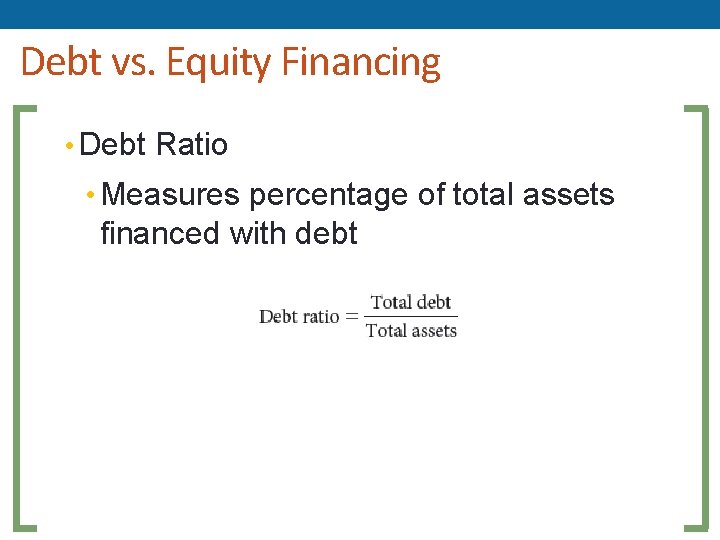
Debt vs. Equity Financing • Debt Ratio • Measures percentage of total assets financed with debt
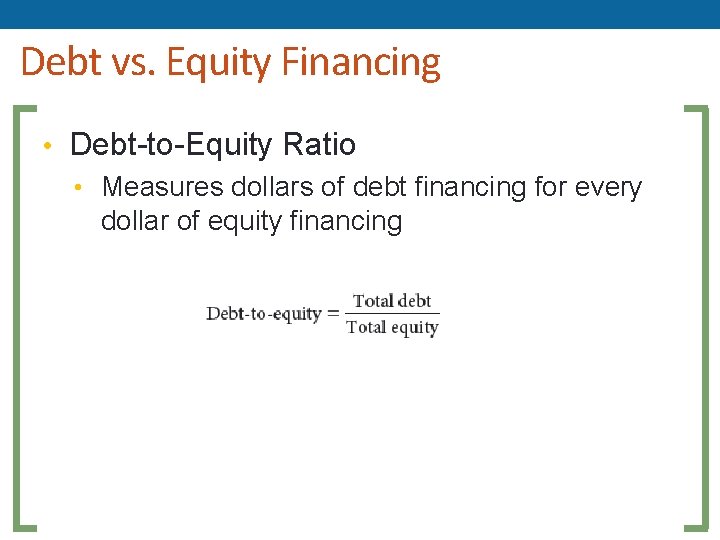
Debt vs. Equity Financing • Debt-to-Equity Ratio • Measures dollars of debt financing for every dollar of equity financing
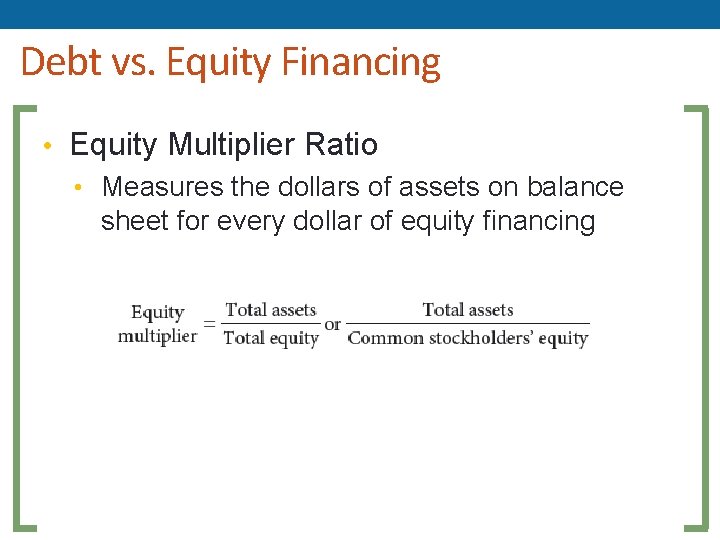
Debt vs. Equity Financing • Equity Multiplier Ratio • Measures the dollars of assets on balance sheet for every dollar of equity financing
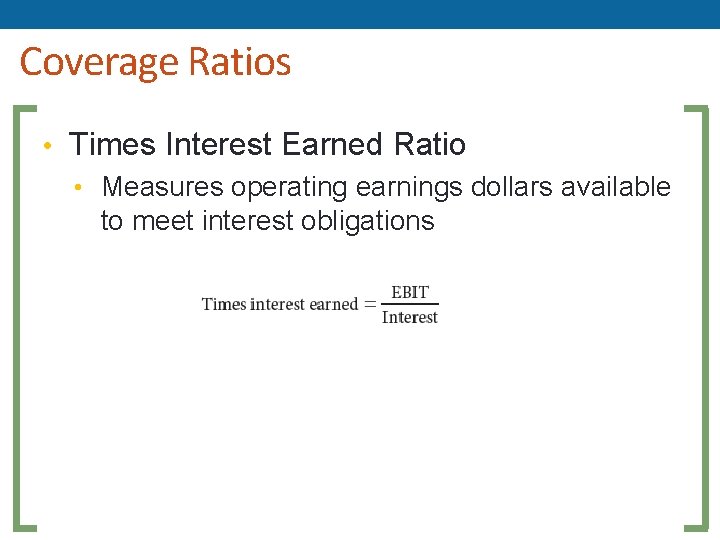
Coverage Ratios • Times Interest Earned Ratio • Measures operating earnings dollars available to meet interest obligations
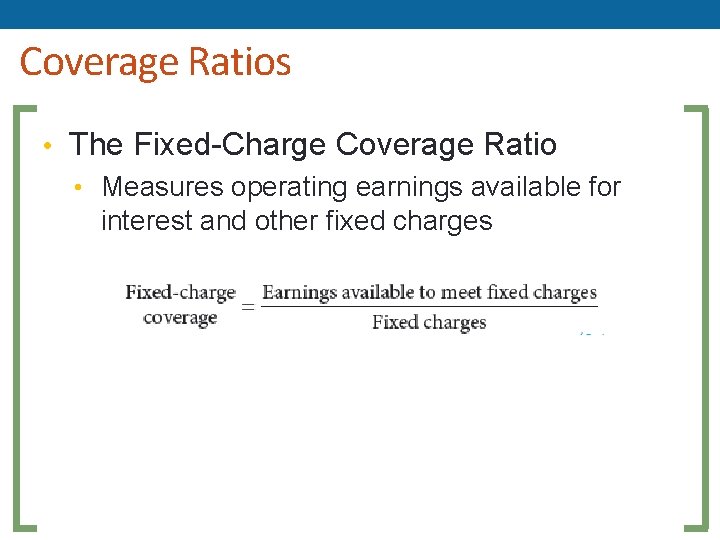
Coverage Ratios • The Fixed-Charge Coverage Ratio • Measures operating earnings available for interest and other fixed charges
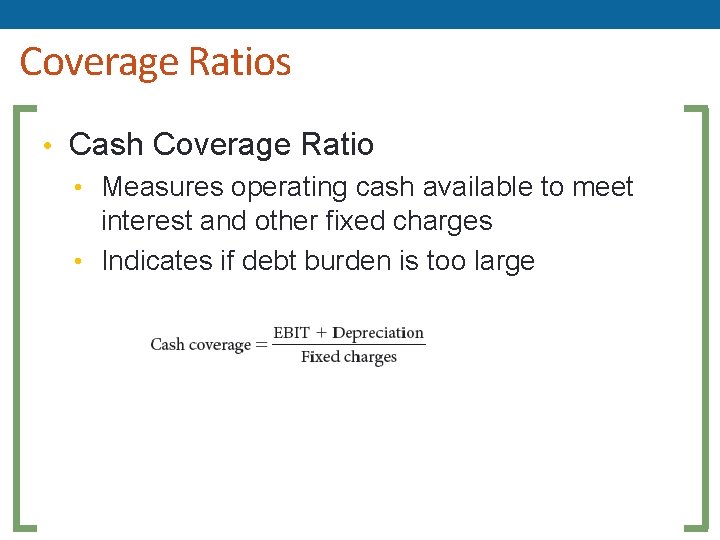
Coverage Ratios • Cash Coverage Ratio • Measures operating cash available to meet interest and other fixed charges • Indicates if debt burden is too large
Profitability Ratios • Show the combined effect of liquidity, asset management and debt management on firm’s operating results • Closely monitored by investors • Stock prices react very quickly to unexpected changes in these ratios
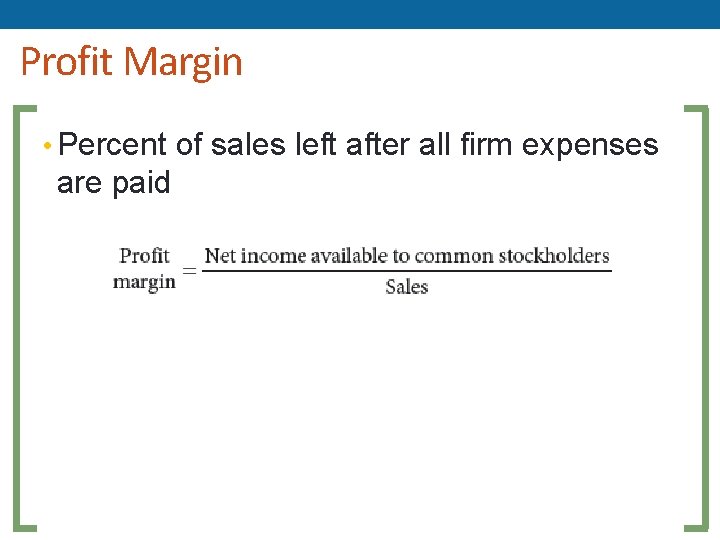
Profit Margin • Percent of sales left after all firm expenses are paid
Basic Earnings Power Ratio • Measures the EBIT earned per dollar of assets on the balance sheet • Represents operating return on assets irrespective of financial leverage and taxes
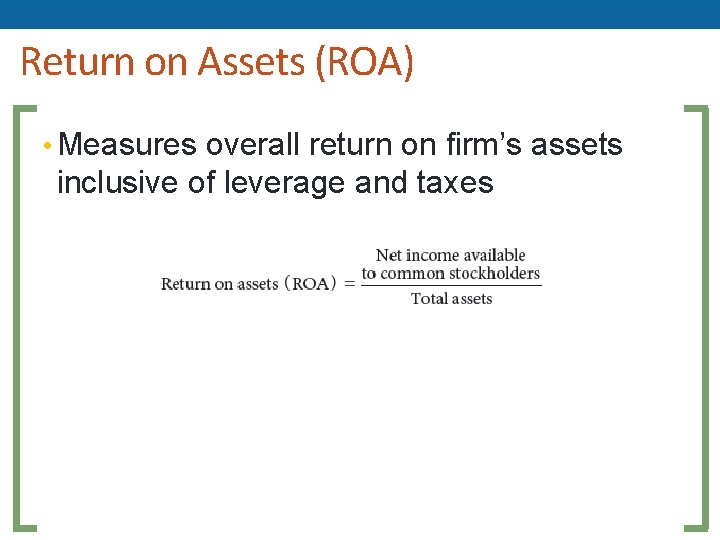
Return on Assets (ROA) • Measures overall return on firm’s assets inclusive of leverage and taxes
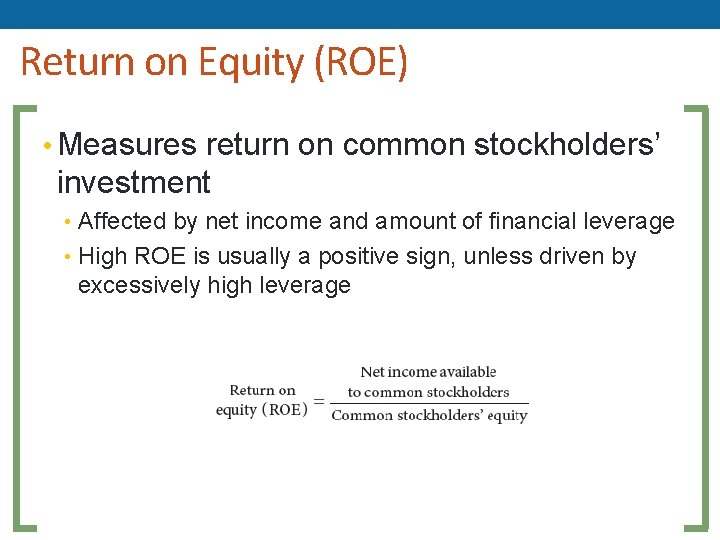
Return on Equity (ROE) • Measures return on common stockholders’ investment • Affected by net income and amount of financial leverage • High ROE is usually a positive sign, unless driven by excessively high leverage
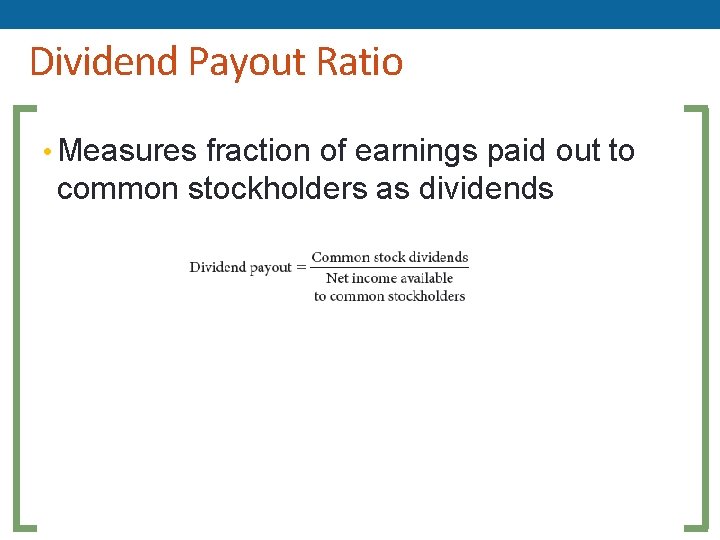
Dividend Payout Ratio • Measures fraction of earnings paid out to common stockholders as dividends
Market Value Ratios • Market prices of publicly traded firms incorporate risk • Ratios that incorporate stock market values are important • Market values reflect what investors think of the company’s future performance and risk
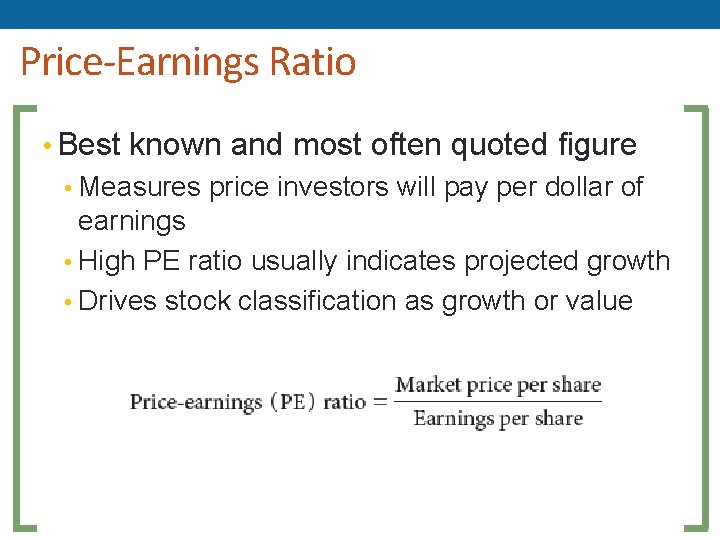
Price-Earnings Ratio • Best known and most often quoted figure • Measures price investors will pay per dollar of earnings • High PE ratio usually indicates projected growth • Drives stock classification as growth or value
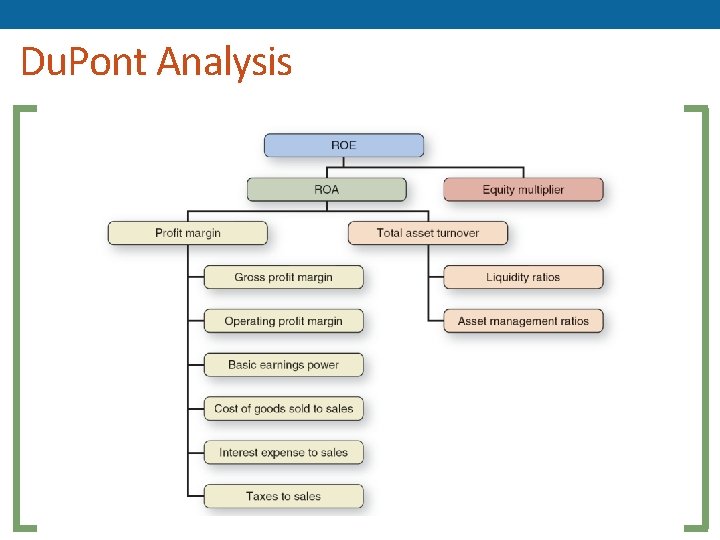
Du. Pont Analysis • Uses Balance Sheet and Income Statements • Breaks ROA and ROE into components to explain why the ratios are low or high
Du. Pont Analysis
Other Ratios • Spreading the Financial Statement • Divide balance sheet amounts by total assets • Divide all income statement amounts by net sales
Other Ratios • Internal Growth Rate • Sustainable Growth Rate • Time Series • Cross-Sectional Analysis