Chapter 16 Practical Nutrient Management Representative conceptual nutrient


 The deep-rooted Acacia albida enriches the soil under")

 The amount of fertilizer")


")


- Slides: 24
Chapter 16 Practical Nutrient Management
Representative conceptual nutrient flowcharts for a cash-grain farm, a dairy farm, and a golf course. Only the managed inputs, key recycling flows, and outputs are shown. Unmanaged inputs, such as nutrient deposition in rainfall, are not shown. Outputs that are difficult to manage, such as leaching and runoff losses to the environment, are shown as being variable. Although information on unmanaged inputs and outputs is not always readily available, it must be taken into consideration in developing a complete nutrient management plan. Such flowcharts are a starting point in identifying imbalances between inputs and outputs that could lead to wasted resources, reduced profitability, and environmental damage.
A multispecies riparian buffer strip designed to protect the stream from nutrients and sediment in runoff while also providing wildlife habitat benefits. A grass-covered level berm spreads runoff water evenly to avoid gullies. The perennial grasses filter out sediments and take up dissolved nutrients. Deep tree roots remove some nutrients from shallow groundwater. Soluble carbon from tree litter percolates downward to provide an energy source for anaerobic denitrifying bacteria that can remove additional nitrogen from shallow groundwater. The woody vegetation also provides wildlife habitat, shades the stream, and provides in-stream woody debris for fish habitat. A total buffer width of 20 to 30 m is usually sufficient.
Cover crops can substantially reduce the concentration of nitrate. N in winter drainage water by soaking up excess mineral nitrogen left in the soil after the summer crop is harvested. In the case illustrated, the cover crops were grown from September through November following the harvest of sweet corn. The data show averages for 2 years and two sites in Quebec, Canada. Both sites had fine-textured soils in the Inceptisols order. Among the cover crops, red clover was the least effective in reducing nitrogen leaching, partly because it produced the least growth and partly because it is a nitrogen-fixing legume that is relatively inefficient at scavenging leftover nitrogen.
Two examples of agroforestry systems. (a) The deep-rooted Acacia albida enriches the soil under its spreading branches (arrow points to a man). Conveniently, these trees leaf out in the dry season and lose their leaves during the rainy season when crops are grown. It is an African tradition to leave these trees standing when land is cleared for crop production. Crops growing under the trees yield more and have higher contents of sulfur, nitrogen, and other nutrients. (b) Branches pruned from widely spaced rows of leguminous trees are spread as a mulch on the soil surface in the alleys between the tree rows, thus enriching the alleys with nutrients from the leaves as well as conserving soil moisture. The crops grown in this alleycropping system may yield better than crops grown alone, but only if competition between trees and crop plants for light and water can be kept to a minimum.
Comparative effects of winter cover crops and inorganic fertilizer on the yield of the following main crop of processing tomatoes grown on a Xeralf soil in California. The amount of nitrogen shown on the x-axis was added either as inorganic fertilizer or as aboveground residues of the cover crops, or a combination of both. Note that nitrogen from either source seemed to be equally effective. For tomato, which requires nitrogen over a long period of time, vetch alone or vetch mixed with oats produced enough nitrogen for near-optimal yields.
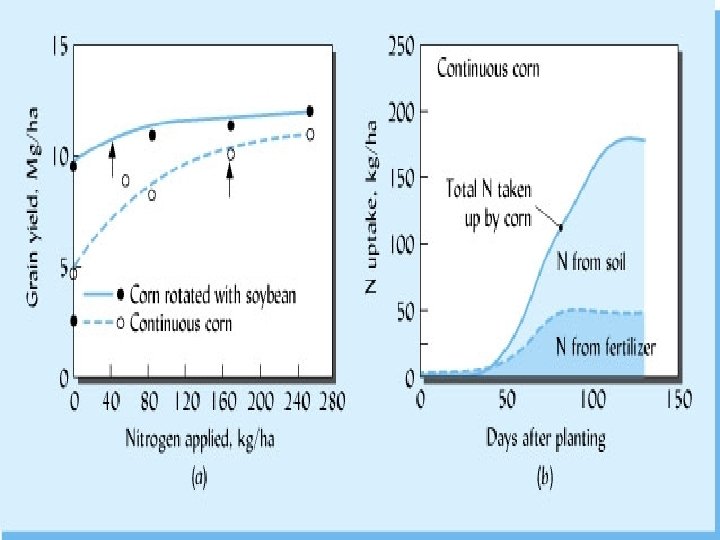
Crop rotation can increase yields and reduce fertilizer requirements. (a) The amount of fertilizer nitrogen required (≠) for high corn yields was less than 50 kg N/ha in the corn– soybean rotation (solid line), but over 150 kg N/ha in the continuous corn system (dashed line). These soils supported either corn every year or corn every second year alternating with soybeans for the 12 years. The rotation corn maintained some yield advantage even when high amounts of nitrogen were applied, indicating that in addition to increased nitrogen availability after soybeans, the crop rotation conferred other benefits, such as pest reduction or improved soil microbial activity. Crop rotations involving more than two crops usually produce even greater benefits, especially if several years in the rotation are devoted to perennial grass-legume hay or pasture. (b) The use of isotopically labeled fertilizer (15 NH 4 NO 3) showed that even when a relatively high rate was applied (168 kg N/ha), most of the corn’s N needs came not directly from the fertilizer, but from the mineralization of soil organic matter. This was especially true in the latter part of the growing season. By harvest time, the fertilizer-derived nitrogen taken up by the corn represented less than one-third of the nitrogen taken up by the plants, and accounted for less than one-third of the fertilizer nitrogen applied to the soil. Corn grown in rotation with soybeans (not shown) took up more nitrogen from both soil and fertilizer sources than did corn grown after corn. These data are averages for 2 years and two soils (a silt loam Ustoll and a loam Udoll) in Kansas, but the results are typical of those found in many parts of the world (compare Table 14. 10).
A large feedlot in Colorado where 100, 000 cattle are fed on grain imported from distant farms. It is difficult for such concentrated animal feeding operations to recycle the nutrients in the manure back to the land on which the cattle feed was grown. Instead of being seen as a valued resource, the manure in this situation may be considered a waste to be disposed of. Agriculture is challenged to structure itself in a more ecologically balanced manner that better integrates its animal and crop components.
Spreading solid dairy manure on cropland recycles nutrients efficiently but is labor-intensive and time-consuming for the farmer. Many loads of manure will have to be hauled to fertilize this field. The manure should be incorporated as soon as possible after spreading, and spreading should not be done on frozen soils. Calibration of spreaders is important to prevent unintentional overapplication of nutrients.
World fertilizer use since 1960 by major nutrient element. The use of nitrogen has increased much faster than that of phosphorus and potassium. The dip in world fertilizer use in the early 1990 s was due mainly to drastic reductions in Russia and Ukraine after the collapse of the Soviet Union. The apparent leveling off since 1990 of the world total is the result of decreases in most of the industrialized countries combined with continued increases in China, India, and much of the developing world. In the latter countries, the removal of nutrients in crop harvests still exceeds the amounts returned to the soil.
An illustration of the law of the minimum and the concept of the limiting factor. Plant growth is constrained by the essential element (or other factor) that is most limiting. The level of water in the barrel represents the level of plant production. (a) Phosphorus is represented as being the factor that is most limiting. Even though the other elements are present in more than adequate amounts, plant growth can be no greater than that allowed by the level of phosphorus available. (b) When phosphorus is added, the level of plant production is raised until another factor becomes most limiting—in this case, nitrogen.
Fertilizers may be applied by many different methods, depending on the situation. Methods (a) to (c) represent broadcast fertilizer, with or without incorporation. Methods (d) to (h) are variations of localized placement. Method (i) is foliar application and has special advantages, but also limitations. Commonly, two or three of these methods may be used in sequence. For example, a field may be prepared with (c) before planting; (d) may be used during the planting operation; (g) may be used as a side-dressing early in the growing season; and, finally, (i) may used to correct a micronutrient deficiency that shows up in the middle of the season.
Relationships among the rate of fertilizer addition, crop yield increase, fertilizer costs, and profit from adding fertilizers. Note that the yield increase (and profit) from the first 500 kg of fertilizer is much greater than from the second and third 500 kg. Also note that the maximum profit is obtained at a lower fertilizer rate than that needed to give a maximum yield. The calculations assume that the yield response to added fertilizer takes the form of a smooth quadratic curve, an assumption which often leads to an overestimate of the amount of fertilizer needed to optimize profit.
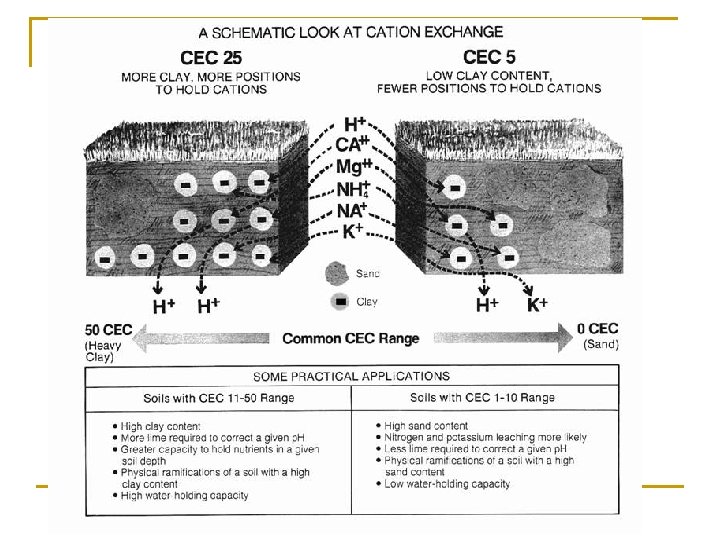
Cation Exchange Capacity CEC n n n This gives you information of for fertile your soil is. This will tell you how much nitrogen your soil can hold. You will use this number to create your fertilizing schedule or program.
CEC n n The amount of clay and organic matter play a large role in the amount of nitrogen your soil can hold. CEC # x 10 = Total Nitrogen the soil can hold
Base Saturation n n Calcium, Ca = 65 -80% Magnesium, Mg = 12 -25% Potassium, K = 4 -8% Hydrogen, H = less than 10% Sodium, Na = less than 1%
Soil-borne elements essential for plant growth, the form occurring in the soil and taken up by the plant, and their relative soil mobility. Element (symbol) Form taken up by the plant Mobility in the soil Nitrogen (N) (NH 4)+ Ammonium form (NO 3)- Nitrate form Somewhat immobile Mobile Phosphorous (P) (H 2 PO 4)-, (HPO 4)-2, PO-3 Immobile Potassium (K) K+ Somewhat mobile Calcium (Ca) Ca+ Somewhat mobile Magnesium (Mg) Mg+2 Somewhat mobile Sulfur (S) (SO 4)-2 Mobile Chlorine (Cl) Cl- Mobile Iron (Fe) Fe+2 Immobile Boron (B) (BO 3)- Mobile Manganese (Mn) Mn+2 Immobile Zinc (Z) Zn+2 Immobile Molybdenum (Mo) (Mo. O 4)- Mobile
Table 16 -10 page 700 n Influence of handling & storage methods on nutrient losses
Figure 16. 22 page 704 n Recycling of organic wastes
Box 16. 2 page 706 n Calculation of amount of organic nutrient source
Table 16 -13 page 709 n Commonly used Inorganic fertilizer