Chapter 10 Confidence Intervals Section 2 Estimating a
- Slides: 18
Chapter 10: Confidence Intervals Section 2: Estimating a Population Mean with σ unknown
Statistical Inference �What happens when we don’t know the population standard deviation, σ? �What can we estimate σ with instead? �The sample standard deviation!
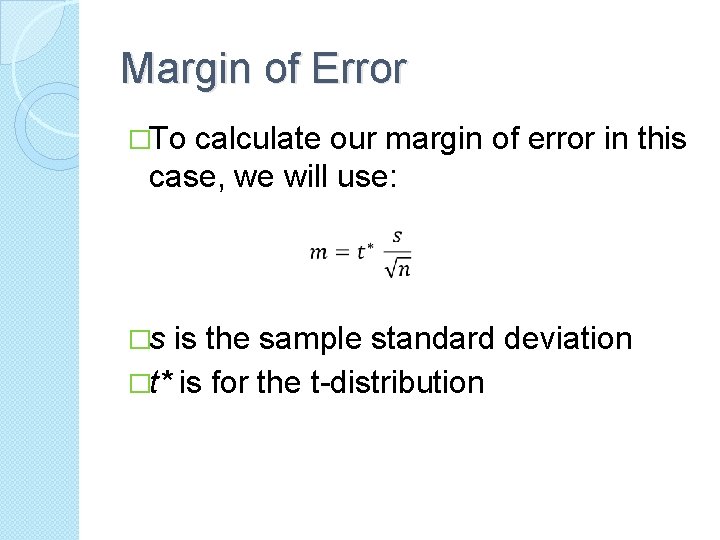
Margin of Error �To calculate our margin of error in this case, we will use: �s is the sample standard deviation �t* is for the t-distribution
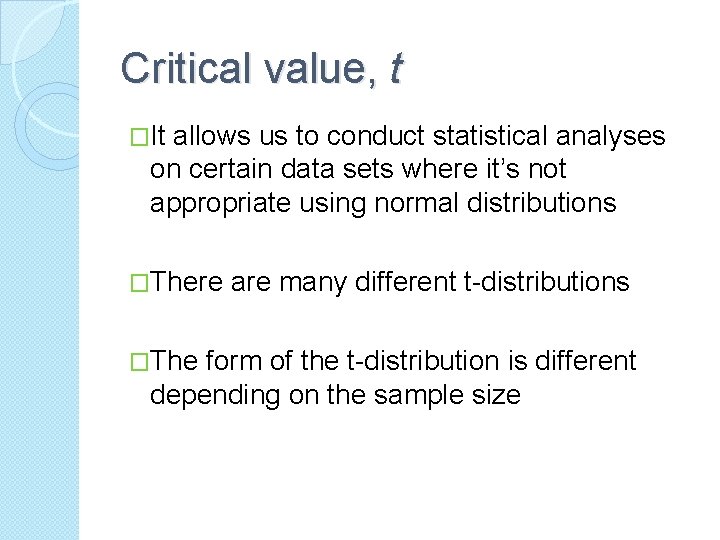
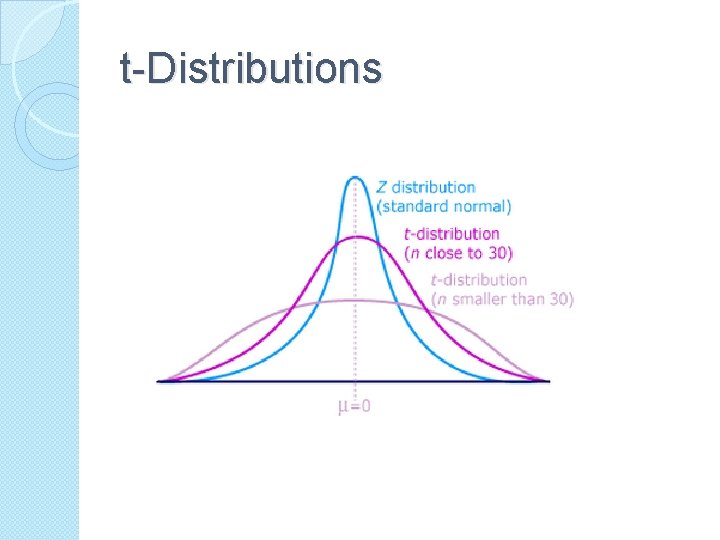
Critical value, t �It allows us to conduct statistical analyses on certain data sets where it’s not appropriate using normal distributions �There �The are many different t-distributions form of the t-distribution is different depending on the sample size
t-Distributions
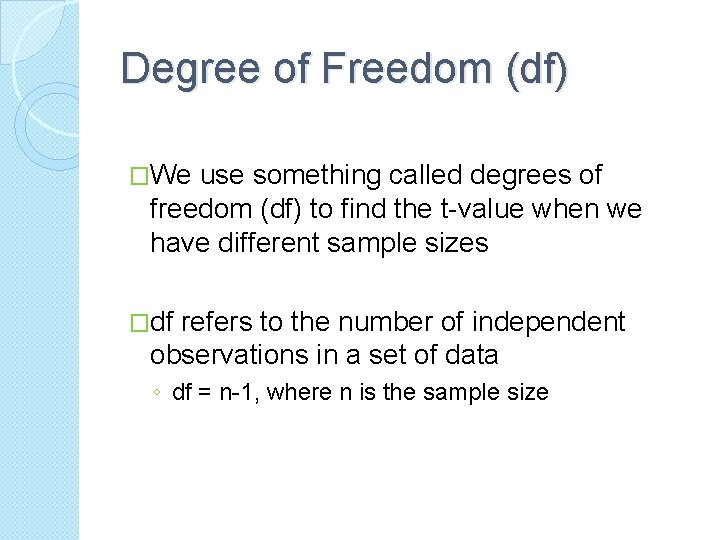
Degree of Freedom (df) �We use something called degrees of freedom (df) to find the t-value when we have different sample sizes �df refers to the number of independent observations in a set of data ◦ df = n-1, where n is the sample size
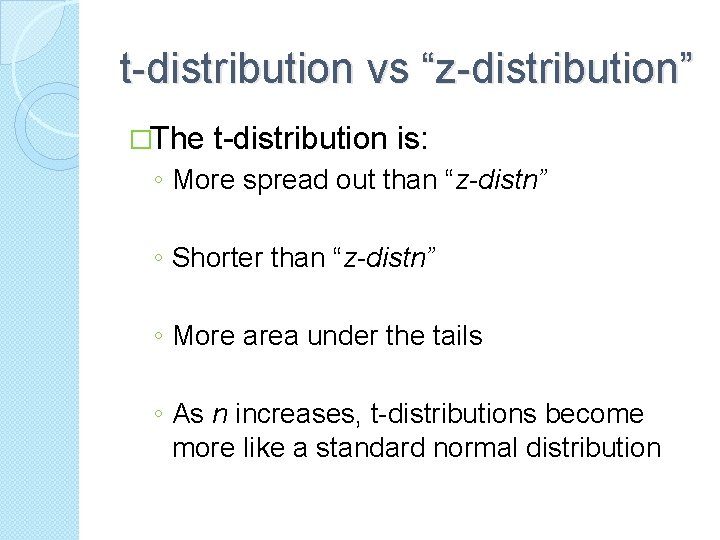
t-distribution vs “z-distribution” �The t-distribution is: ◦ More spread out than “z-distn” ◦ Shorter than “z-distn” ◦ More area under the tails ◦ As n increases, t-distributions become more like a standard normal distribution
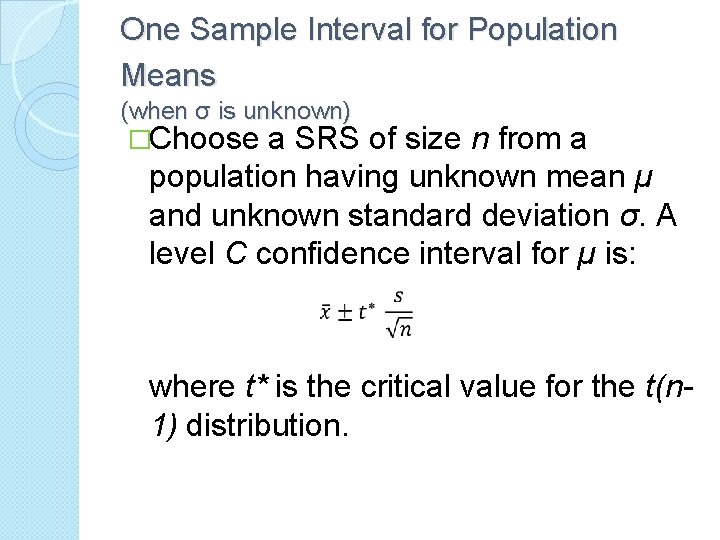
One Sample Interval for Population Means (when σ is unknown) �Choose a SRS of size n from a population having unknown mean µ and unknown standard deviation σ. A level C confidence interval for µ is: where t* is the critical value for the t(n 1) distribution.
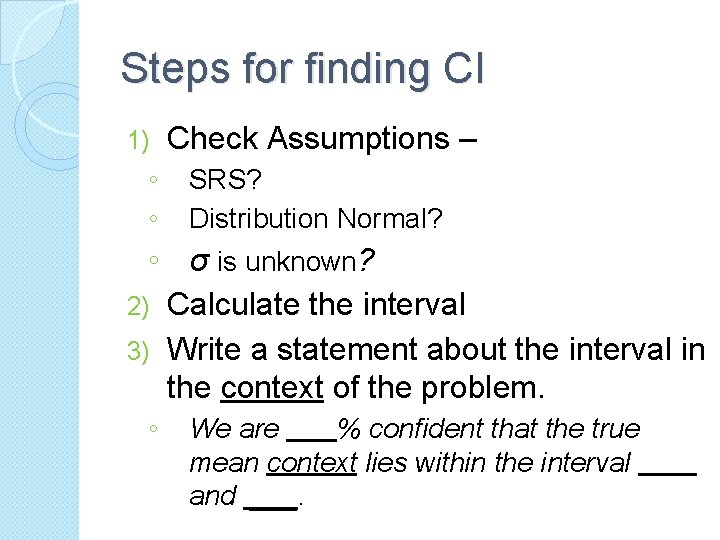
Steps for finding CI 1) ◦ ◦ Check Assumptions – SRS? Distribution Normal? ◦ σ is unknown? 2) Calculate the interval 3) Write a statement about the interval in the context of the problem. ◦ We are % confident that the true mean context lies within the interval and ___.
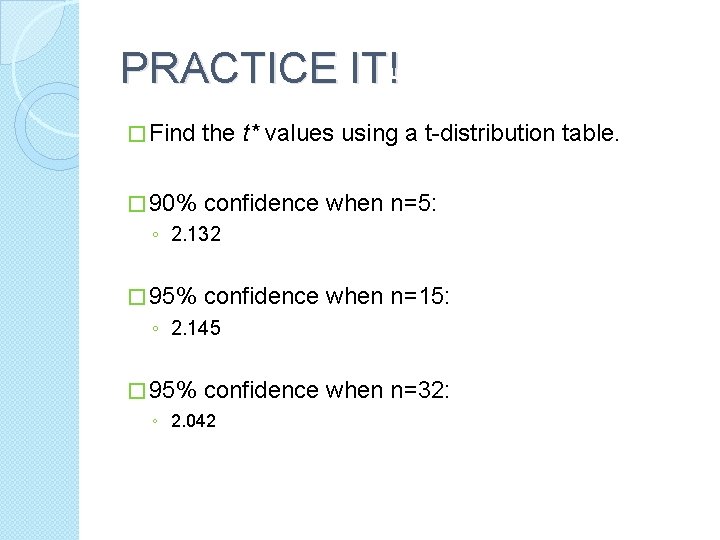
PRACTICE IT! � Find the t* values using a t-distribution table. � 90% confidence when n=5: ◦ 2. 132 � 95% confidence when n=15: ◦ 2. 145 � 95% confidence when n=32: ◦ 2. 042
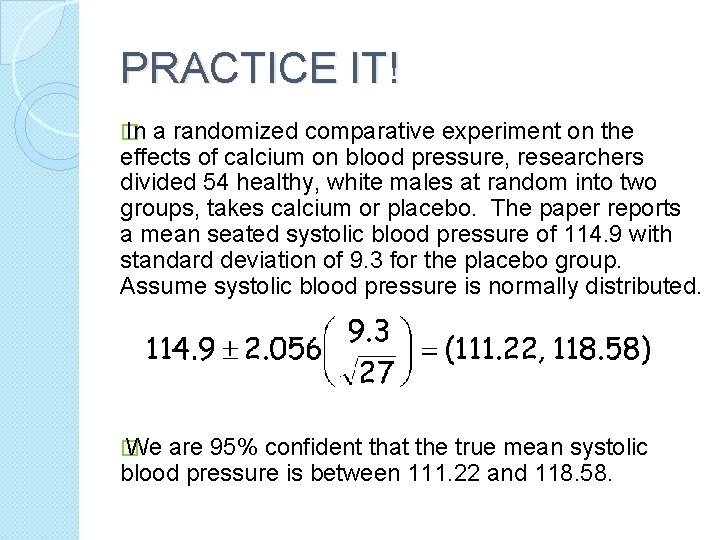
PRACTICE IT! � In a randomized comparative experiment on the effects of calcium on blood pressure, researchers divided 54 healthy, white males at random into two groups, takes calcium or placebo. The paper reports a mean seated systolic blood pressure of 114. 9 with standard deviation of 9. 3 for the placebo group. Assume systolic blood pressure is normally distributed. � We are 95% confident that the true mean systolic blood pressure is between 111. 22 and 118. 58.
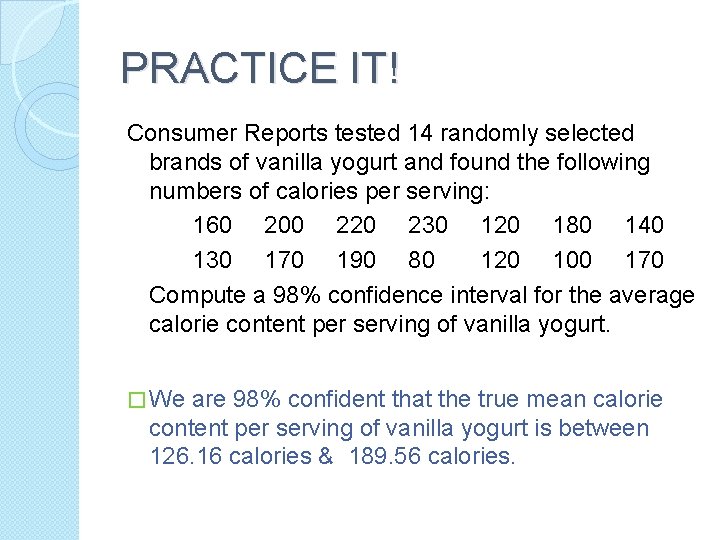
PRACTICE IT! Consumer Reports tested 14 randomly selected brands of vanilla yogurt and found the following numbers of calories per serving: 160 200 220 230 120 180 140 130 170 190 80 120 100 170 Compute a 98% confidence interval for the average calorie content per serving of vanilla yogurt. � We are 98% confident that the true mean calorie content per serving of vanilla yogurt is between 126. 16 calories & 189. 56 calories.
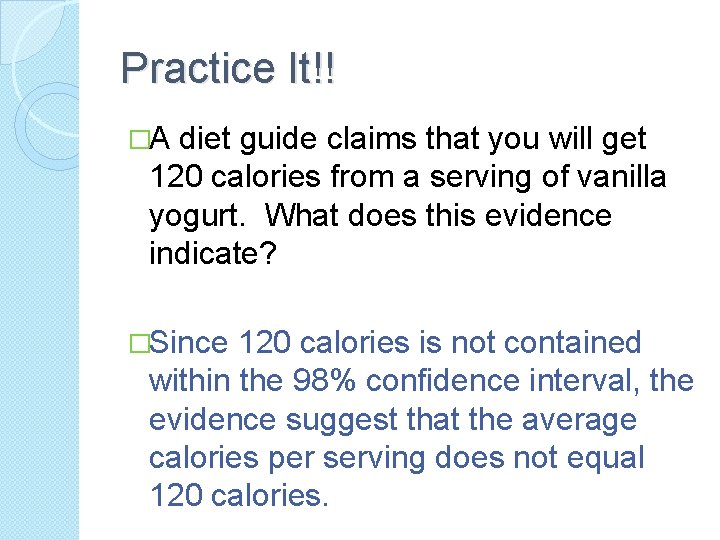
Practice It!! �A diet guide claims that you will get 120 calories from a serving of vanilla yogurt. What does this evidence indicate? �Since 120 calories is not contained within the 98% confidence interval, the evidence suggest that the average calories per serving does not equal 120 calories.
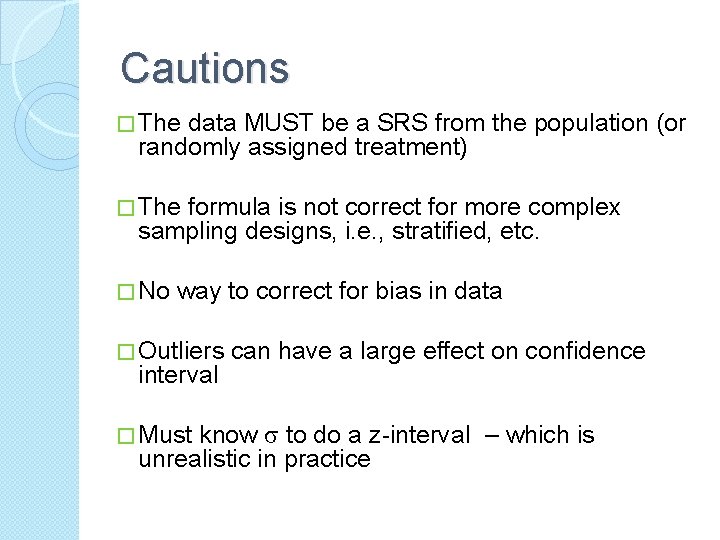
Cautions � The data MUST be a SRS from the population (or randomly assigned treatment) � The formula is not correct for more complex sampling designs, i. e. , stratified, etc. � No way to correct for bias in data � Outliers interval can have a large effect on confidence know s to do a z-interval – which is unrealistic in practice � Must
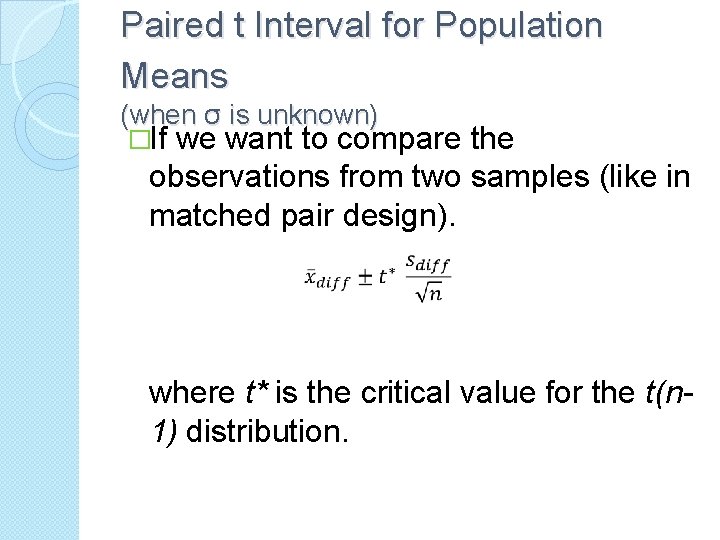
Paired t Interval for Population Means (when σ is unknown) �If we want to compare the observations from two samples (like in matched pair design). where t* is the critical value for the t(n 1) distribution.
Practice It!!!! �It has been questioned many times whether or not individuals are dependent on caffeine to wake up in the morning. Eleven individuals were tested and their energy levels were measured. The first week of the trial they continued with their morning coffee. Their average energy level score was 15. 93 with a standard deviation 4. 1. The second week of the trial they had no coffee. Their average energy level score was 9. 48 with a standard deviation 3. 2. Find the 90% confidence interval for the mean change in energy level score.
Robust �An inference procedure is ROBUST if the confidence level or p-value doesn’t change much if the assumptions are violated. �t-procedures can be used with some skewness, as long as there are no outliers. �Larger n can have more skewness
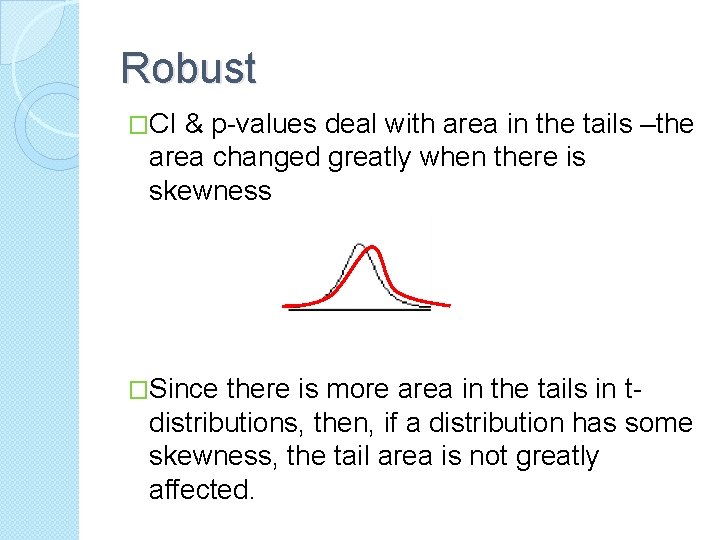
Robust �CI & p-values deal with area in the tails –the area changed greatly when there is skewness �Since there is more area in the tails in tdistributions, then, if a distribution has some skewness, the tail area is not greatly affected.