Assessment of the NCEP CFS Hindcast Runs on


- Slides: 20
Assessment of the NCEP CFS Hindcast Runs on Predicting the North American Monsoon Lindsey Long and Jae Schemm NOAA/NWS/NCEP/CPC Lindsey. N. Williams@noaa. gov Runs courtesy of Suranjana Saha NOAA/NWS/NCEP/EMC
Introduction n Focus on Precipitation and Atmospheric Circulation Look at both seasonal and interannual variability Five varying runs allow us to look at the affect of: Lead Time n Updates to the CFS model n Horizontal Resolution n
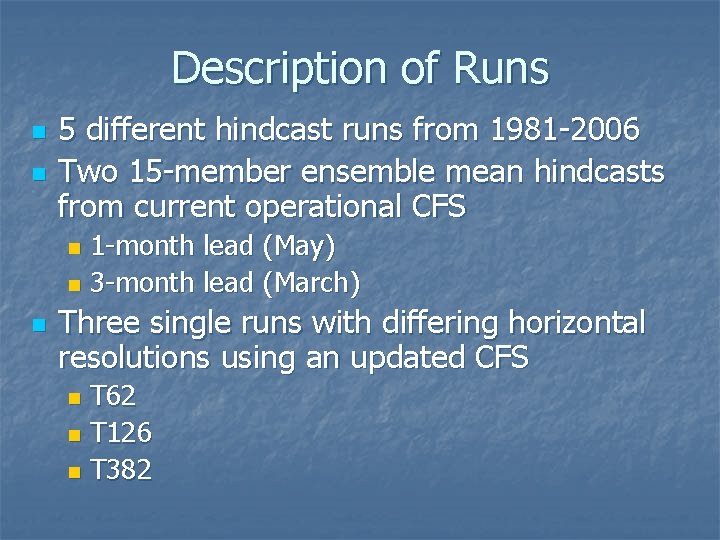
Description of Runs n n 5 different hindcast runs from 1981 -2006 Two 15 -member ensemble mean hindcasts from current operational CFS 1 -month lead (May) n 3 -month lead (March) n n Three single runs with differing horizontal resolutions using an updated CFS T 62 n T 126 n T 382 n
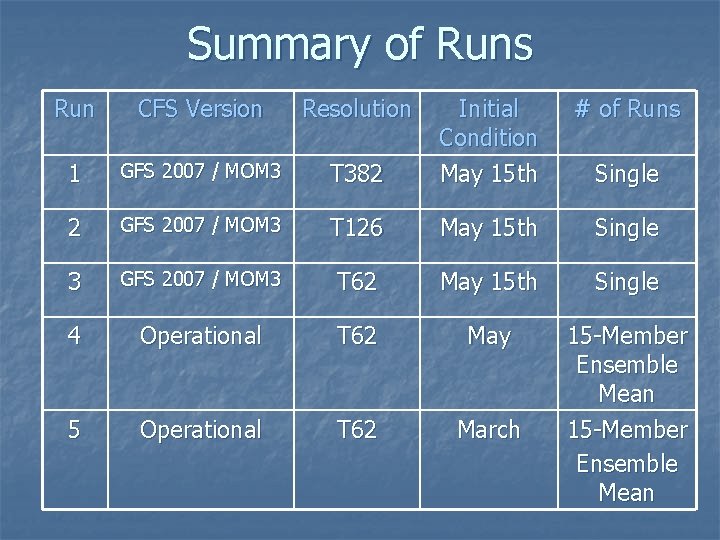
Summary of Runs Run CFS Version Resolution # of Runs T 382 Initial Condition May 15 th 1 GFS 2007 / MOM 3 2 GFS 2007 / MOM 3 T 126 May 15 th Single 3 GFS 2007 / MOM 3 T 62 May 15 th Single 4 Operational T 62 May 5 Operational T 62 March 15 -Member Ensemble Mean Single
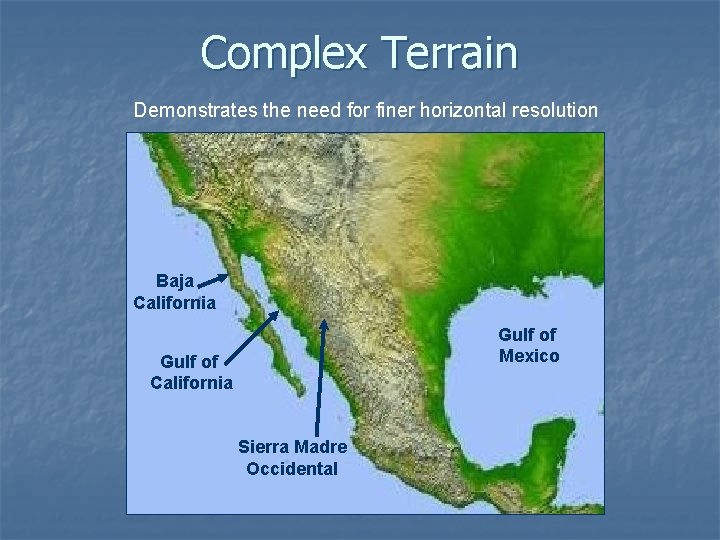
Complex Terrain Demonstrates the need for finer horizontal resolution Baja California Gulf of Mexico Gulf of California Sierra Madre Occidental
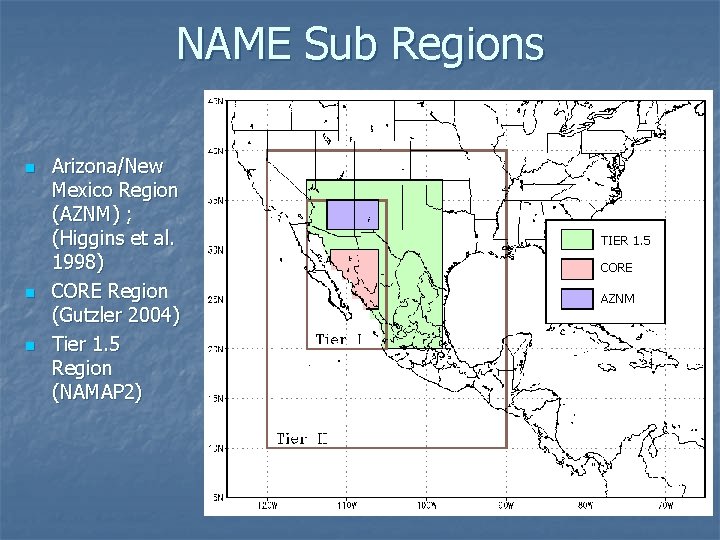
NAME Sub Regions n n n Arizona/New Mexico Region (AZNM) ; (Higgins et al. 1998) CORE Region (Gutzler 2004) Tier 1. 5 Region (NAMAP 2) TIER 1. 5 CORE AZNM
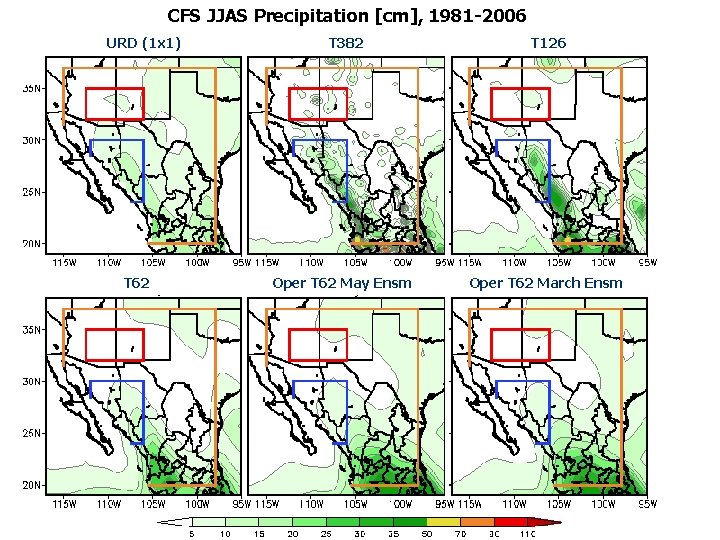
CFS JJAS Precipitation [cm], 1981 -2006 URD (1 x 1) T 62 T 382 T 126 Oper T 62 May Ensm Oper T 62 March Ensm
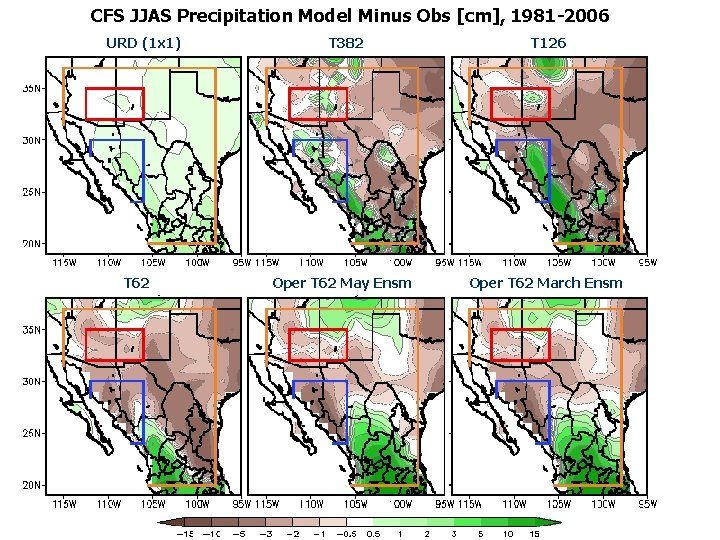
CFS JJAS Precipitation Model Minus Obs [cm], 1981 -2006 URD (1 x 1) T 62 T 382 T 126 Oper T 62 May Ensm Oper T 62 March Ensm
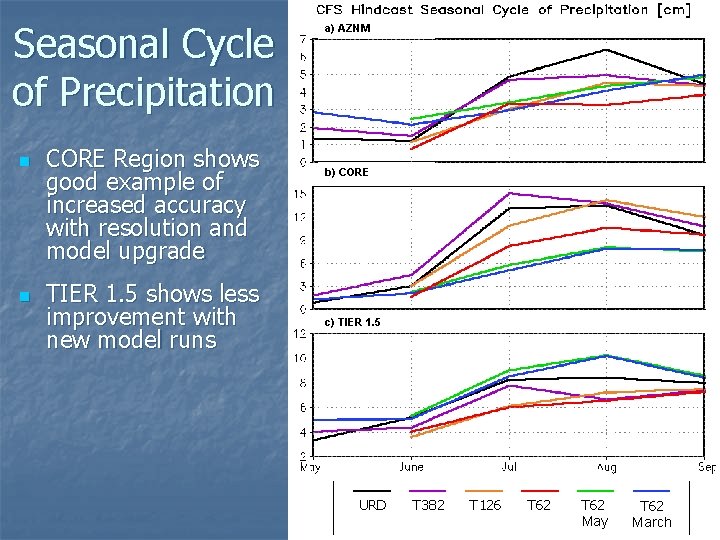
Seasonal Cycle of Precipitation n n CORE Region shows good example of increased accuracy with resolution and model upgrade TIER 1. 5 shows less improvement with new model runs a) AZNM b) CORE c) TIER 1. 5 URD T 382 T 126 T 62 May T 62 March
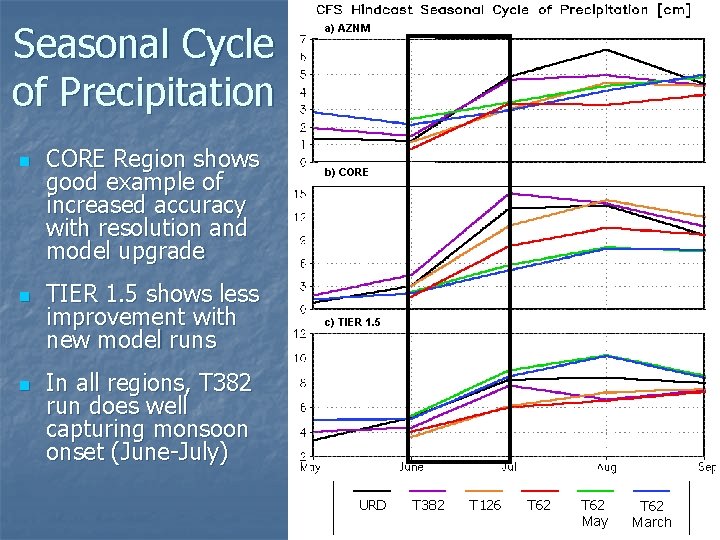
Seasonal Cycle of Precipitation n CORE Region shows good example of increased accuracy with resolution and model upgrade TIER 1. 5 shows less improvement with new model runs a) AZNM b) CORE c) TIER 1. 5 In all regions, T 382 run does well capturing monsoon onset (June-July) URD T 382 T 126 T 62 May T 62 March
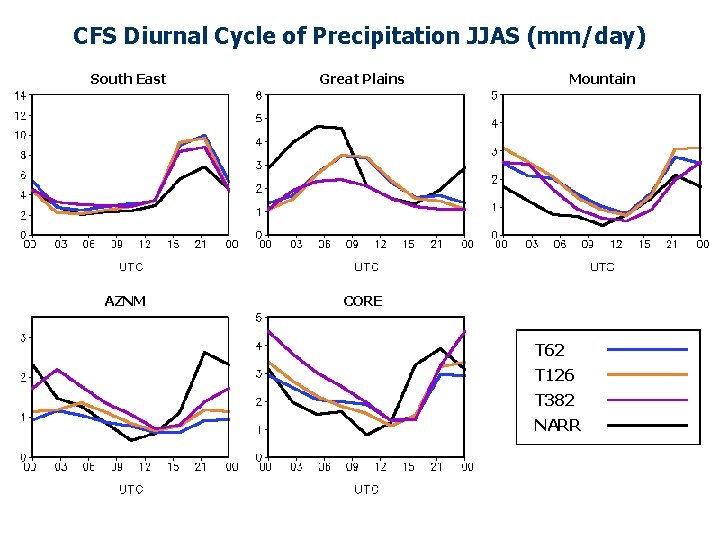
CFS Diurnal Cycle of Precipitation JJAS (mm/day) South East AZNM Great Plains l Mountain CORE T 62 T 126 T 382 NARR
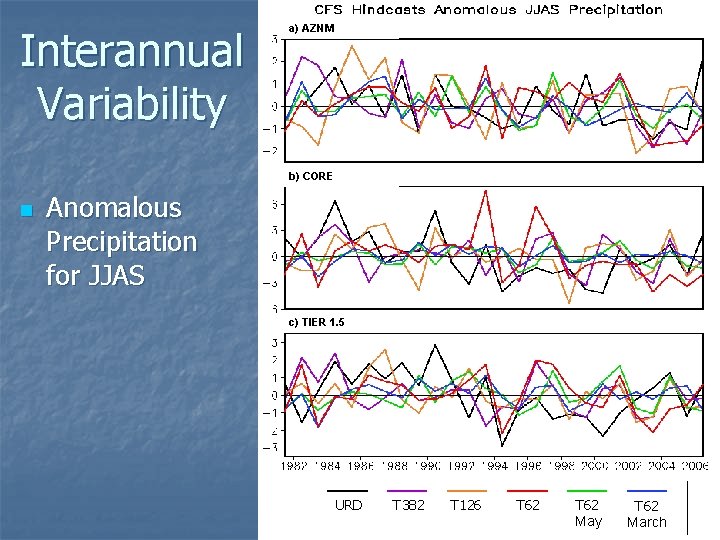
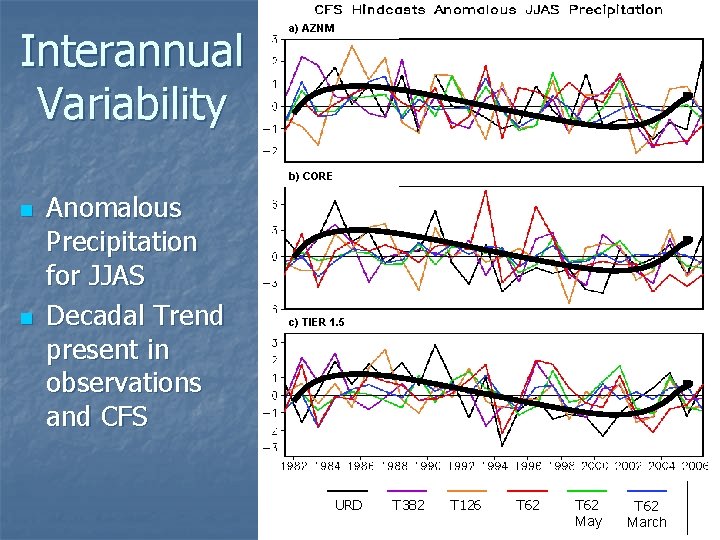
Interannual Variability a) AZNM b) CORE n Anomalous Precipitation for JJAS c) TIER 1. 5 URD T 382 T 126 T 62 May T 62 March
Interannual Variability a) AZNM b) CORE n n Anomalous Precipitation for JJAS Decadal Trend present in observations and CFS c) TIER 1. 5 URD T 382 T 126 T 62 May T 62 March
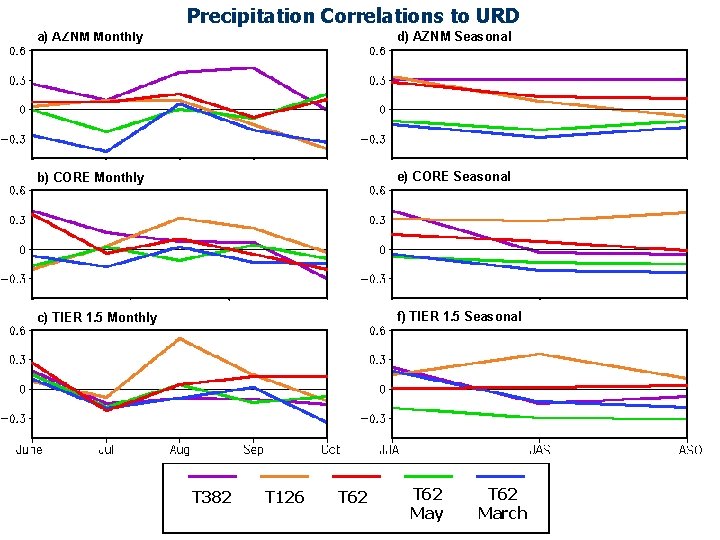
Precipitation Correlations to URD a) AZNM Monthly d) AZNM Seasonal b) CORE Monthly e) CORE Seasonal c) TIER 1. 5 Monthly f) TIER 1. 5 Seasonal T 382 T 126 T 62 May T 62 March
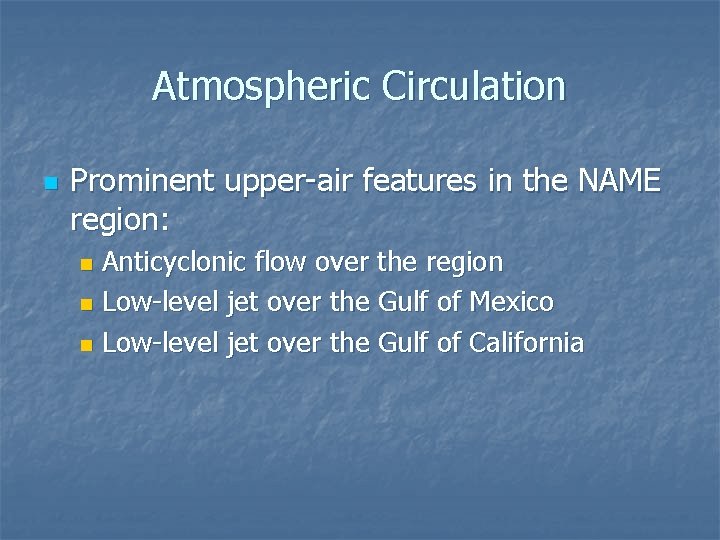
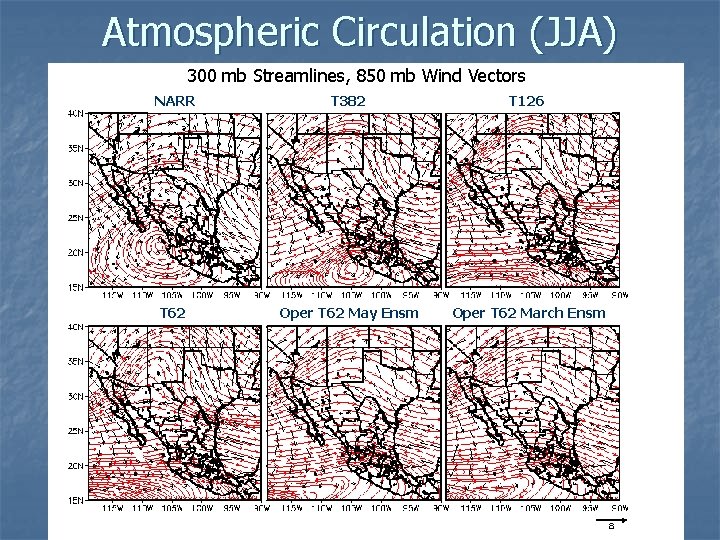
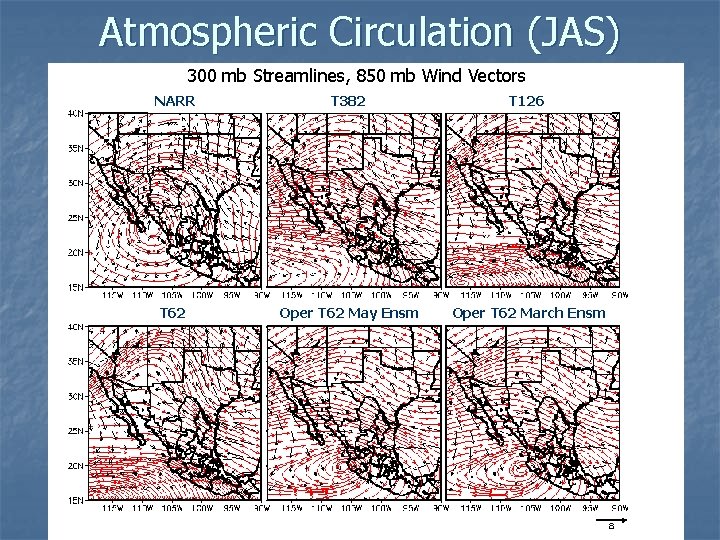
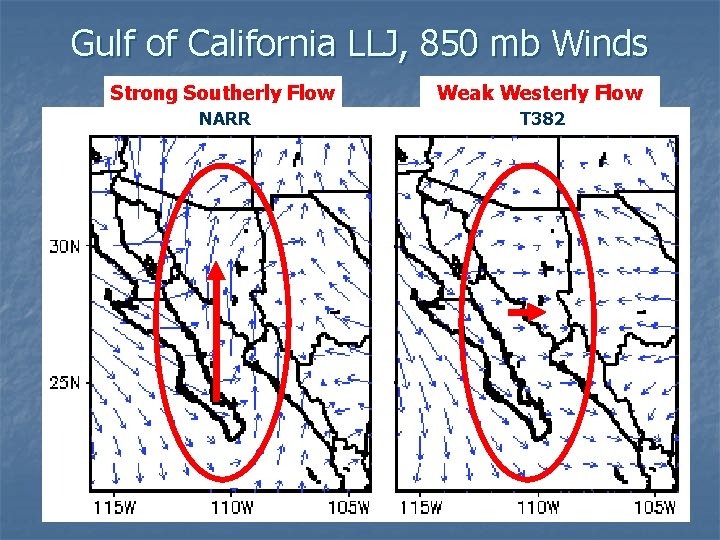
Atmospheric Circulation n Prominent upper-air features in the NAME region: Anticyclonic flow over the region n Low-level jet over the Gulf of Mexico n Low-level jet over the Gulf of California n
Atmospheric Circulation (JJA) 300 mb Streamlines, 850 mb Wind Vectors NARR T 382 T 126 T 62 Oper T 62 May Ensm Oper T 62 March Ensm
Atmospheric Circulation (JAS) 300 mb Streamlines, 850 mb Wind Vectors NARR T 382 T 126 T 62 Oper T 62 May Ensm Oper T 62 March Ensm
Gulf of California LLJ, 850 mb Winds Strong Southerly Flow Weak Westerly Flow NARR T 382
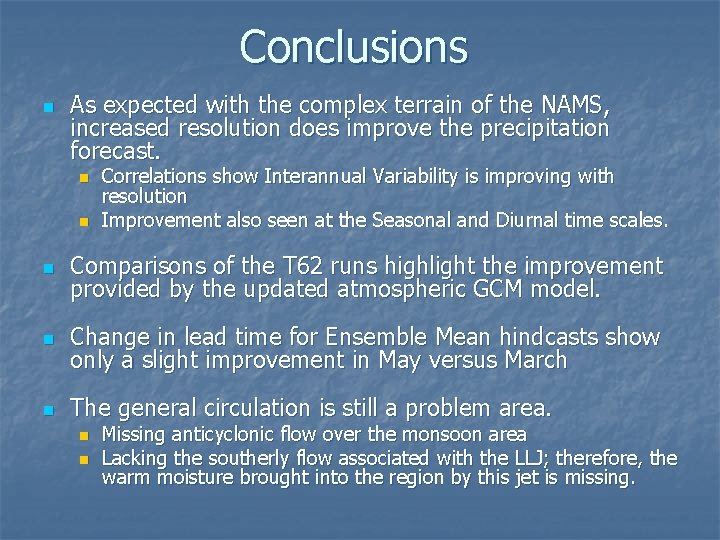
Conclusions n As expected with the complex terrain of the NAMS, increased resolution does improve the precipitation forecast. n n Correlations show Interannual Variability is improving with resolution Improvement also seen at the Seasonal and Diurnal time scales. n Comparisons of the T 62 runs highlight the improvement provided by the updated atmospheric GCM model. n Change in lead time for Ensemble Mean hindcasts show only a slight improvement in May versus March n The general circulation is still a problem area. n n Missing anticyclonic flow over the monsoon area Lacking the southerly flow associated with the LLJ; therefore, the warm moisture brought into the region by this jet is missing.
Thank you! Questions?