An Assessment of the CFS realtime forecasts for
- Slides: 19
An Assessment of the CFS real-time forecasts for 2005 -2008 Wanqiu Wang, Mingyue Chen, and Arun Kumar CPC/NCEP/NOAA 1
Outline 1. CFS forecast skill and comparison with hindcast 2. Comparison with potential predictability based on AMIP simulations 3. Systematic errors in the forecast - Cold summers - Mean bias 2
1. CFS forecast skill - SST forecast 3
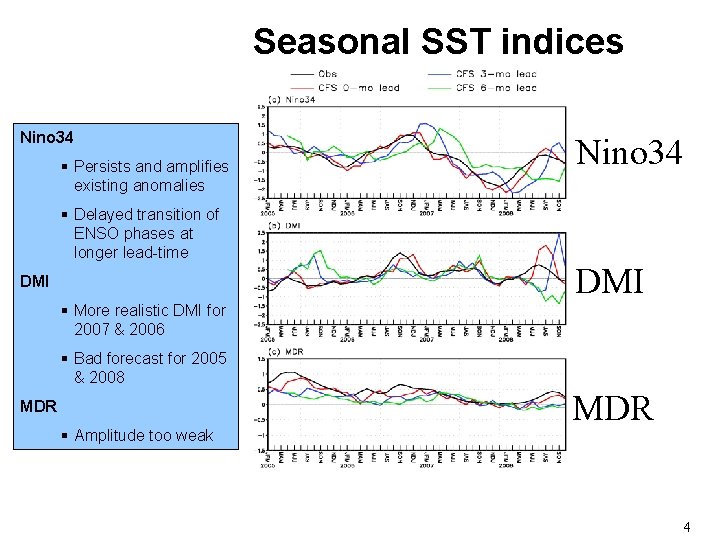
Seasonal SST indices Nino 34 § Persists and amplifies existing anomalies § Delayed transition of ENSO phases at longer lead-time DMI § More realistic DMI for 2007 & 2006 Nino 34 DMI § Bad forecast for 2005 & 2008 MDR § Amplitude too weak MDR 4
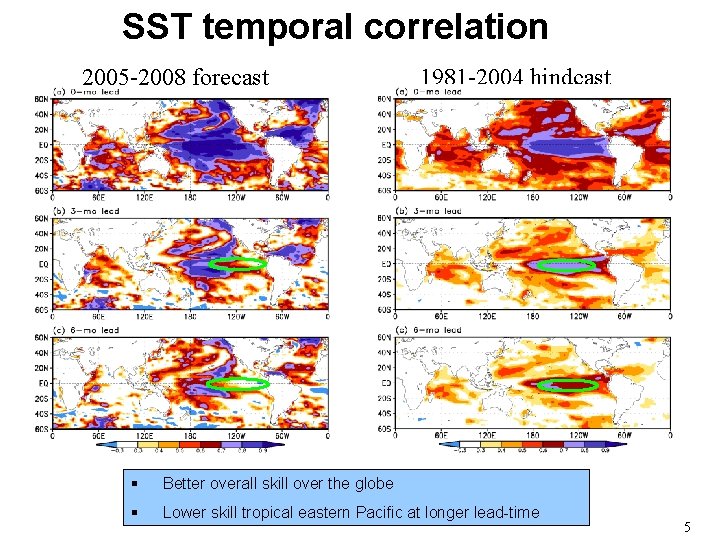
SST temporal correlation 2005 -2008 forecast 1981 -2004 hindcast § Better overall skill over the globe § Lower skill tropical eastern Pacific at longer lead-time 5
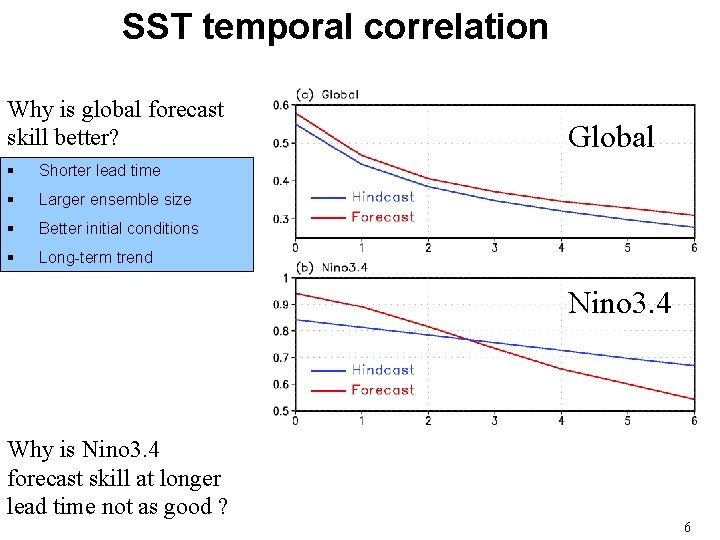
SST temporal correlation Why is global forecast skill better? § Shorter lead time § Larger ensemble size § Better initial conditions § Long-term trend Global Nino 3. 4 Why is Nino 3. 4 forecast skill at longer lead time not as good ? 6
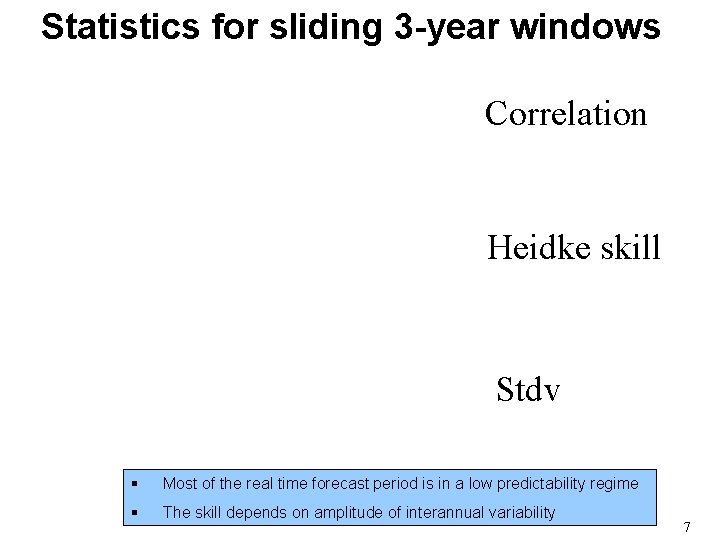
Statistics for sliding 3 -year windows Correlation Heidke skill Stdv § Most of the real time forecast period is in a low predictability regime § The skill depends on amplitude of interannual variability 7
1. CFS forecast skill - Atmospheric fields 8
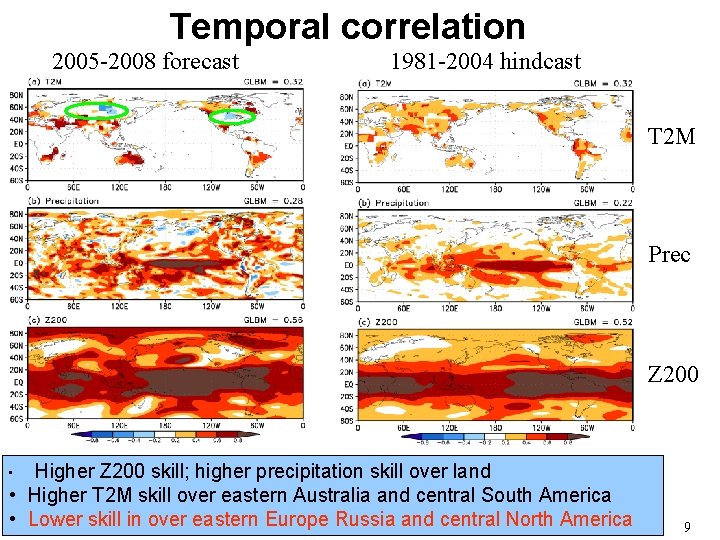
Temporal correlation 2005 -2008 forecast 1981 -2004 hindcast T 2 M Prec Z 200 Higher Z 200 skill; higher precipitation skill over land • Higher T 2 M skill over eastern Australia and central South America • Lower skill in over eastern Europe Russia and central North America • 9
2. Comparison with AMIP simulations 10
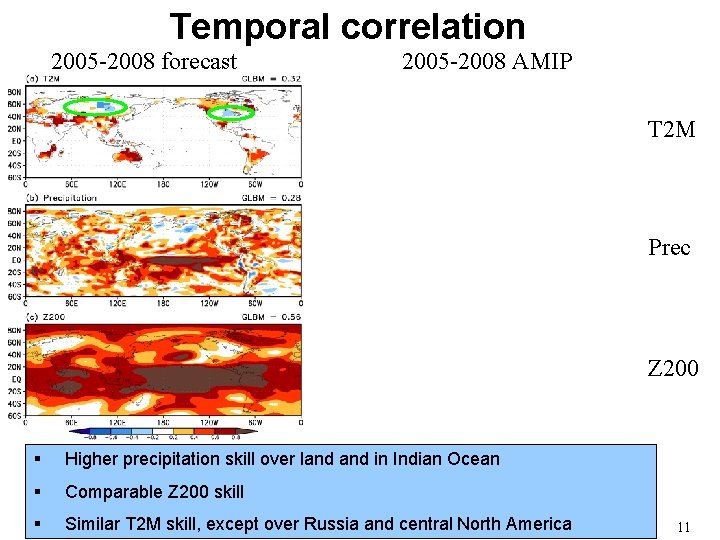
Temporal correlation 2005 -2008 forecast 2005 -2008 AMIP T 2 M Prec Z 200 § Higher precipitation skill over land in Indian Ocean § Comparable Z 200 skill § Similar T 2 M skill, except over Russia and central North America 11
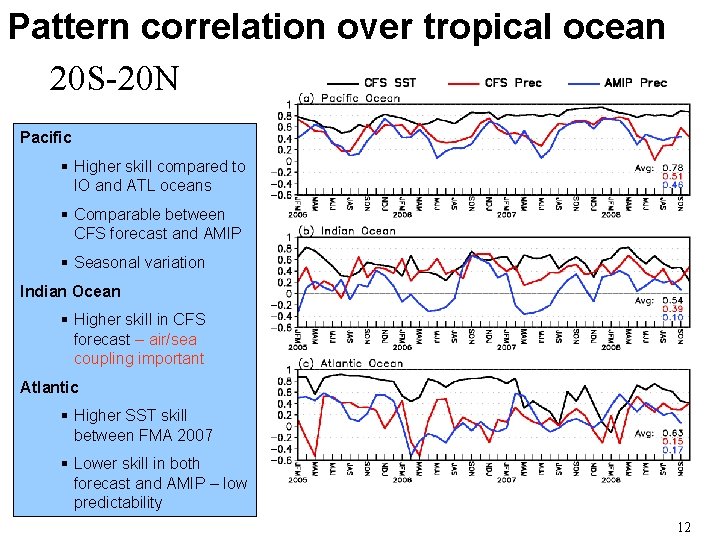
Pattern correlation over tropical ocean 20 S-20 N Pacific § Higher skill compared to IO and ATL oceans § Comparable between CFS forecast and AMIP § Seasonal variation Indian Ocean § Higher skill in CFS forecast – air/sea coupling important Atlantic § Higher SST skill between FMA 2007 § Lower skill in both forecast and AMIP – low predictability 12
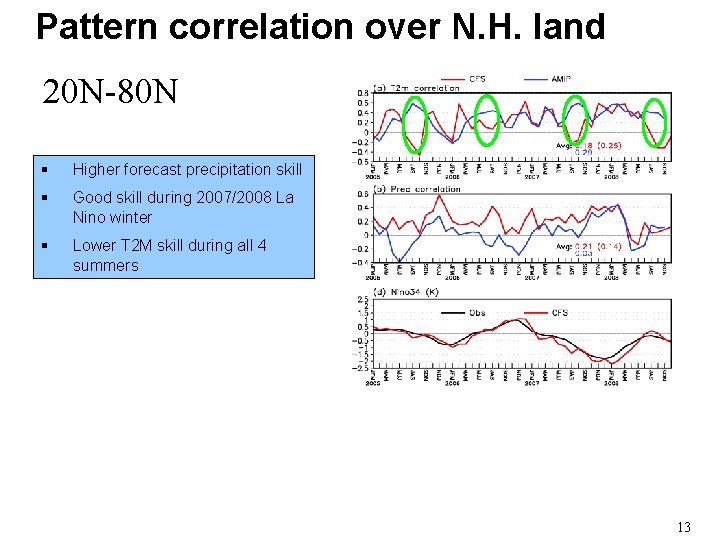
Pattern correlation over N. H. land 20 N-80 N § Higher forecast precipitation skill § Good skill during 2007/2008 La Nino winter § Lower T 2 M skill during all 4 summers 13
3. Systemetic errors - Cold summers - Mean bias 14
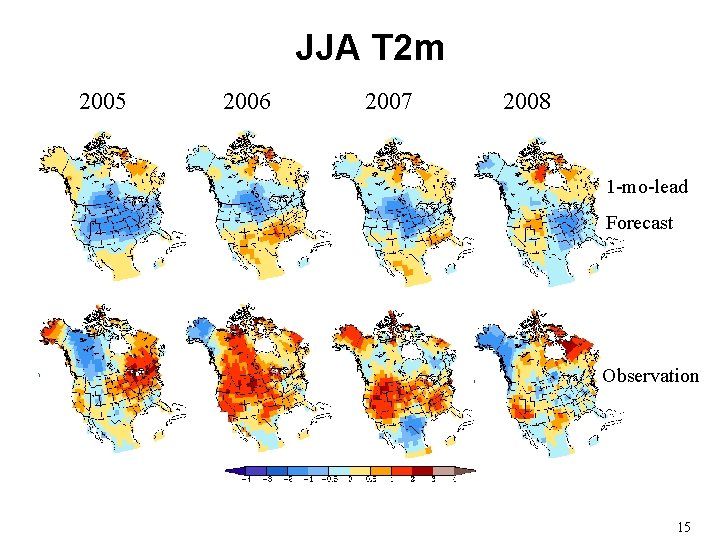
JJA T 2 m 2005 2006 2007 2008 1 -mo-lead Forecast Observation 15
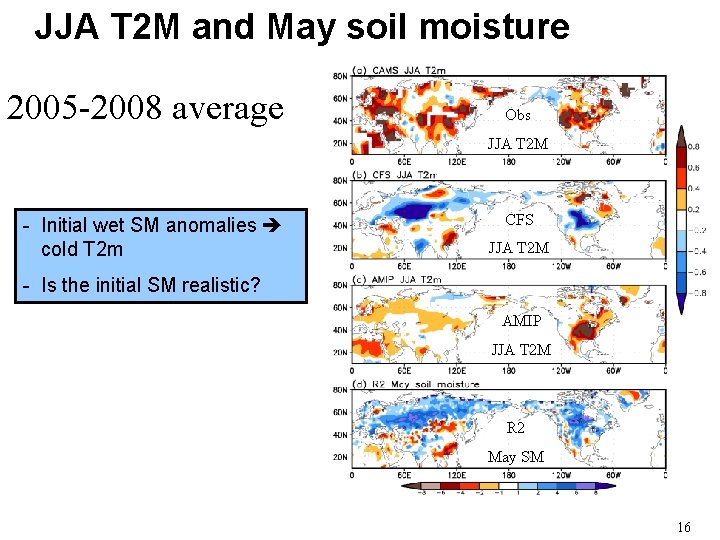
JJA T 2 M and May soil moisture 2005 -2008 average Obs JJA T 2 M - Initial wet SM anomalies cold T 2 m CFS JJA T 2 M - Is the initial SM realistic? AMIP JJA T 2 M R 2 May SM 16
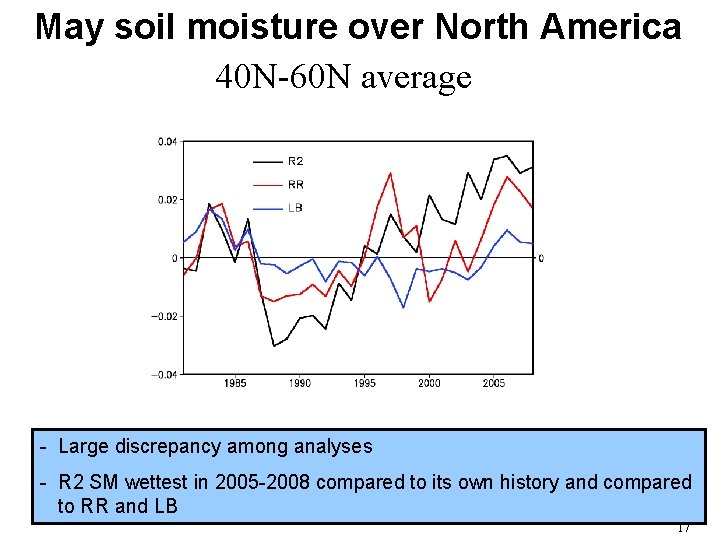
May soil moisture over North America 40 N-60 N average - Large discrepancy among analyses - R 2 SM wettest in 2005 -2008 compared to its own history and compared to RR and LB 17
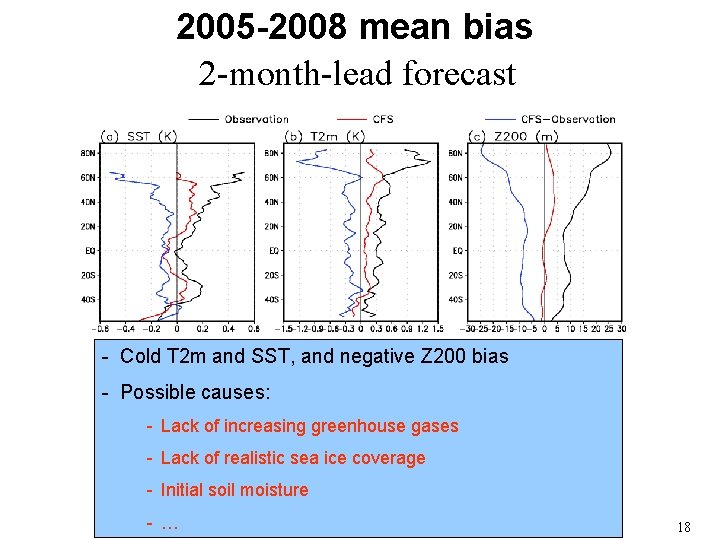
2005 -2008 mean bias 2 -month-lead forecast - Cold T 2 m and SST, and negative Z 200 bias - Possible causes: - Lack of increasing greenhouse gases - Lack of realistic sea ice coverage - Initial soil moisture - … 18
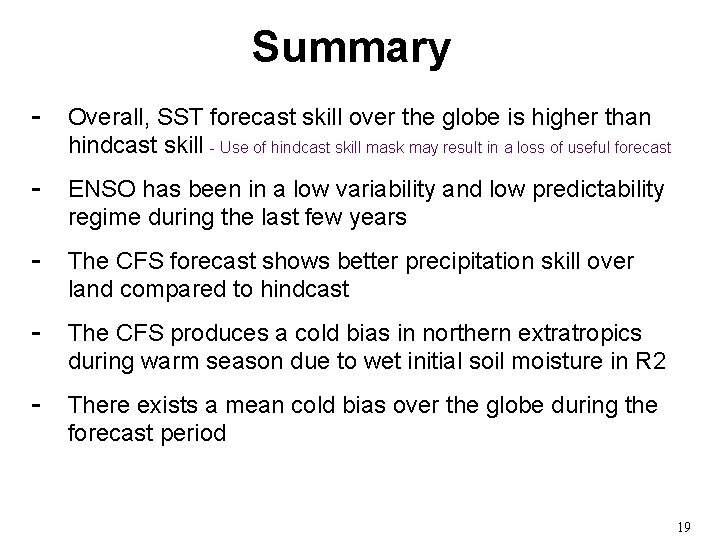
Summary - Overall, SST forecast skill over the globe is higher than hindcast skill - Use of hindcast skill mask may result in a loss of useful forecast - ENSO has been in a low variability and low predictability regime during the last few years - The CFS forecast shows better precipitation skill over land compared to hindcast - The CFS produces a cold bias in northern extratropics during warm season due to wet initial soil moisture in R 2 - There exists a mean cold bias over the globe during the forecast period 19