Aircraft Noise Exposure Contour Update Overview FAA recommends


 SOURCES: National Geographic, Esri, De. Lorme, HERE, UNEP-WCMC, USGS,")
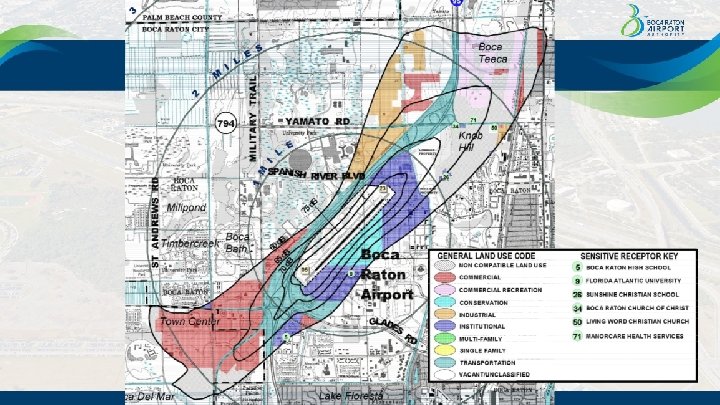
 VS 2001 Noise Exposure Contours SOURCES: National Geographic, Esri,")


- Slides: 12
Aircraft Noise Exposure Contour Update
Overview • FAA recommends updating every 5 -7 years. • Last official noise exposure map is from 2001. • Worked with Ricondo and Associates to complete the Noise Exposure Map. – Noise exposure contours for day-night average (DNL) sound levels 55, 60, 65, 70, and 75. – FAA does not recognize noise impacts for the purposes of Part 150 beyond the 65 DNL contour.
Data Collection • • Date Range: July 2016 – June 2017 Data Sources – – – • BCT Airport Noise Monitoring System (ANOMS) Airport Traffic Control Tower (ATCT) Operations Log FAA Air Traffic Activity Data System (ATADS) FAA Traffic Flow Management System Counts (TFMSC) FAA Aircraft Registry Database FAA's Aviation Environmental Design Tool (AEDT) was used to produce noise exposure contours.
Existing Noise Exposure (2016 -2017) SOURCES: National Geographic, Esri, De. Lorme, HERE, UNEP-WCMC, USGS, NASA, ESA, METI, NRCAN, GEBCO, NOAA, increment P Corp. , October 2017 (basemap); Aviation Environmental Design Tool, October 2017 (AEDT Tracks); Ricondo & Associates, Inc. , October 2017.
Existing Noise Contours (2016 -2017) VS 2001 Noise Exposure Contours SOURCES: National Geographic, Esri, De. Lorme, HERE, UNEP-WCMC, USGS, NASA, ESA, METI, NRCAN, GEBCO, NOAA, increment P Corp. , October 2017 (basemap); Aviation Environmental Design Tool, October 2017 (AEDT Tracks); Ricondo & Associates, Inc. , October 2017 (2016 contours).
Annual Operations and Aircraft Category Comparison: 2001 vs. 2016 -2017 2001 OPERATIONS AIRCRAFT CATEGORY DAY 1/ NIGHT 2/ TOTAL PERCENT OF TOTAL Stage 2 Jet 1, 237 493 1, 730 1. 2% Stage 3 Jet 4, 800 1, 726 6, 526 4. 4% Turboprops 33, 890 11, 852 45, 742 30. 6% Props 74, 336 19, 590 93, 925 62. 7% Helicopter 1, 599 175 1, 774 1. 2% 115, 862 33, 836 149, 697 100. 0% TOTAL 2016 -2017 OPERATIONS AIRCRAFT CATEGORY DAY 1/ NIGHT 2/ TOTAL PERCENT OF TOTAL Stage 2 Jet 0 0 Stage 3 Jet 28, 311 2, 889 31, 201 47. 4% Turboprops 4, 183 323 4, 506 6. 8% Props 27, 293 2, 003 29, 297 44. 5% Helicopter 728 59 786 1. 2% 60, 515 5, 274 65, 789 100. 0% TOTAL NOTES: Columns and rows may not add to totals due to rounding 1/ DAY = 7: 00 a. m. TO 10: 00 p. m. 2/ NIGHT = 10: 00 p. m. to 7: 00 a. m. SOURCES: Part 150 Noise Compatibility Study Update, Boca Raton Airport Authority, Sept 2001 (2001 AAD operations and representative fleet mix); Boca Raton Airport Authority; FAA’s Traffic Flow Management System Counts, BCT Airport Traffic Control Tower Operations (2016 -2017 operations and representative fleet mix assignments).
Annual Operations and Aircraft Category Comparison: 2001 vs. 2016 -2017 2001 OPERATIONS AIRCRAFT CATEGORY DAY 1/ NIGHT 2/ TOTAL PERCENT OF TOTAL Stage 2 Jet 1, 237 493 1, 730 1. 2% Stage 3 Jet 4, 800 1, 726 6, 526 4. 4% Turboprops 33, 890 11, 852 45, 742 30. 6% Props 74, 336 19, 590 93, 925 62. 7% Helicopter 1, 599 175 1, 774 1. 2% 115, 862 33, 836 149, 697 100. 0% TOTAL 2016 -2017 OPERATIONS AIRCRAFT CATEGORY DAY 1/ NIGHT 2/ TOTAL PERCENT OF TOTAL Stage 2 Jet 0 0 Stage 3 Jet 28, 311 2, 889 31, 201 47. 4% Turboprops 4, 183 323 4, 506 6. 8% Props 27, 293 2, 003 29, 297 44. 5% Helicopter 728 59 786 1. 2% 60, 515 5, 274 65, 789 100. 0% TOTAL NOTES: Columns and rows may not add to totals due to rounding 1/ DAY = 7: 00 a. m. TO 10: 00 p. m. 2/ NIGHT = 10: 00 p. m. to 7: 00 a. m. SOURCES: Part 150 Noise Compatibility Study Update, Boca Raton Airport Authority, Sept 2001 (2001 AAD operations and representative fleet mix); Boca Raton Airport Authority; FAA’s Traffic Flow Management System Counts, BCT Airport Traffic Control Tower Operations (2016 -2017 operations and representative fleet mix assignments).
Annual Operations and Aircraft Category Comparison: 2001 vs. 2016 -2017 2001 OPERATIONS AIRCRAFT CATEGORY DAY 1/ NIGHT 2/ TOTAL PERCENT OF TOTAL Stage 2 Jet 1, 237 493 1, 730 1. 2% Stage 3 Jet 4, 800 1, 726 6, 526 4. 4% Turboprops 33, 890 11, 852 45, 742 30. 6% Props 74, 336 19, 590 93, 925 62. 7% Helicopter 1, 599 175 1, 774 1. 2% 115, 862 33, 836 149, 697 100. 0% TOTAL 2016 -2017 OPERATIONS AIRCRAFT CATEGORY DAY 1/ NIGHT 2/ TOTAL PERCENT OF TOTAL Stage 2 Jet 0 0 Stage 3 Jet 28, 311 2, 889 31, 201 47. 4% Turboprops 4, 183 323 4, 506 6. 8% Props 27, 293 2, 003 29, 297 44. 5% Helicopter 728 59 786 1. 2% 60, 515 5, 274 65, 789 100. 0% TOTAL NOTES: Columns and rows may not add to totals due to rounding 1/ DAY = 7: 00 a. m. TO 10: 00 p. m. 2/ NIGHT = 10: 00 p. m. to 7: 00 a. m. SOURCES: Part 150 Noise Compatibility Study Update, Boca Raton Airport Authority, Sept 2001 (2001 AAD operations and representative fleet mix); Boca Raton Airport Authority; FAA’s Traffic Flow Management System Counts, BCT Airport Traffic Control Tower Operations (2016 -2017 operations and representative fleet mix assignments).
Annual Operations and Aircraft Category Comparison: 2001 vs. 2016 -2017 2001 OPERATIONS AIRCRAFT CATEGORY DAY 1/ NIGHT 2/ TOTAL PERCENT OF TOTAL Stage 2 Jet 1, 237 493 1. 2% Stage 3 Jet 4, 800 1, 726 1, 730 6, 526 Turboprops 33, 890 11, 852 45, 742 30. 6% Props 74, 336 19, 590 93, 925 62. 7% Helicopter 1, 599 175 1, 774 1. 2% 115, 862 33, 836 149, 697 100. 0% TOTAL 4. 4% 2016 -2017 OPERATIONS AIRCRAFT CATEGORY DAY 1/ NIGHT 2/ TOTAL PERCENT OF TOTAL Stage 2 Jet 0 0 0 Stage 3 Jet 28, 311 2, 889 0 31, 201 47. 4% Turboprops 4, 183 323 4, 506 6. 8% Props 27, 293 2, 003 29, 297 44. 5% Helicopter 728 59 786 1. 2% 60, 515 5, 274 65, 789 100. 0% TOTAL NOTES: Columns and rows may not add to totals due to rounding 1/ DAY = 7: 00 a. m. TO 10: 00 p. m. 2/ NIGHT = 10: 00 p. m. to 7: 00 a. m. SOURCES: Part 150 Noise Compatibility Study Update, Boca Raton Airport Authority, Sept 2001 (2001 AAD operations and representative fleet mix); Boca Raton Airport Authority; FAA’s Traffic Flow Management System Counts, BCT Airport Traffic Control Tower Operations (2016 -2017 operations and representative fleet mix assignments).
Comparative Noise Footprints for Common Aircraft Types in 2001 and 2016 -2017
Summary • Noise exposure has decreased by about 10 d. B • This is caused by: – Fewer overall operations. – Significantly fewer night flights. – Quieter aircraft.