AAD 8 1 Performance Analysis with JMeter May
- Slides: 17

AAD 8. 1 Performance Analysis with JMeter May 2016

Contents § Acceptance Criteria § Configuration § Method and Tools § End-User Transactions § Results for Login Page § Results for Home Page § Memory Footprint § Memory Consumption 1

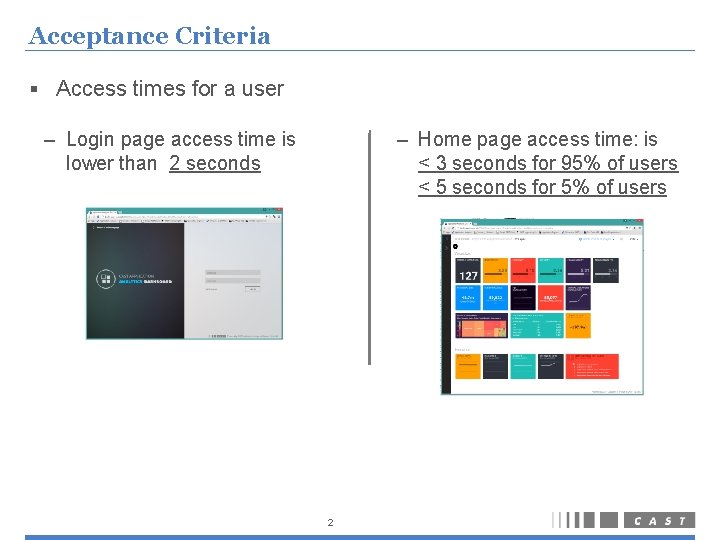
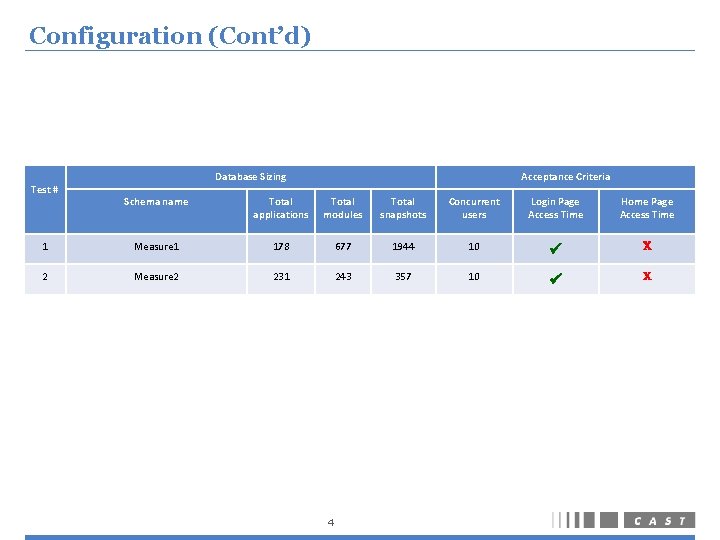
Acceptance Criteria § Access times for a user – Home page access time: is < 3 seconds for 95% of users < 5 seconds for 5% of users – Login page access time is lower than 2 seconds 2

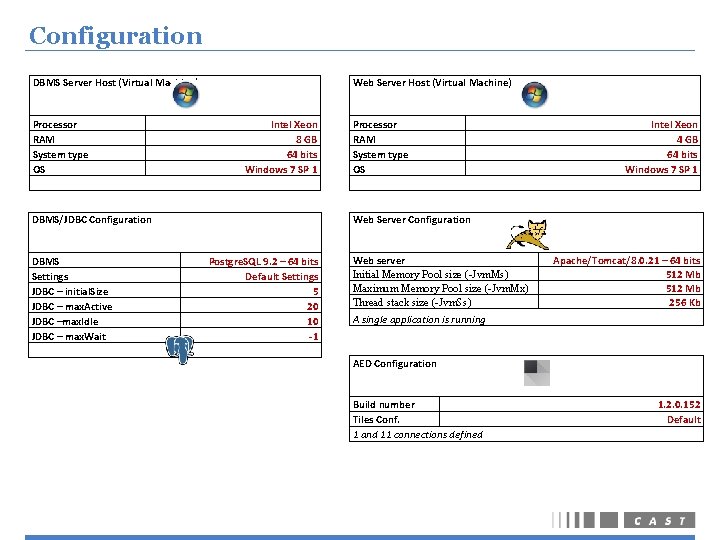
Configuration DBMS Server Host (Virtual Machine) Processor RAM System type OS Web Server Host (Virtual Machine) Intel Xeon 8 GB 64 bits Windows 7 SP 1 DBMS/JDBC Configuration DBMS Settings JDBC – initial. Size JDBC – max. Active JDBC –max. Idle JDBC – max. Wait Processor RAM System type OS Intel Xeon 4 GB 64 bits Windows 7 SP 1 Web Server Configuration Postgre. SQL 9. 2 – 64 bits Default Settings 5 20 10 -1 Web server Initial Memory Pool size (-Jvm. Ms) Maximum Memory Pool size (-Jvm. Mx) Thread stack size (-Jvm. Ss) Apache/Tomcat/8. 0. 21 – 64 bits 512 Mb 256 Kb A single application is running AED Configuration Build number Tiles Conf. 1 and 11 connections defined 1. 2. 0. 152 Default

Configuration (Cont’d) Test # Database Sizing Acceptance Criteria Schema name Total applications Total modules Total snapshots Concurrent users Login Page Access Time Home Page Access Time 1 Measure 1 178 677 1944 10 X 2 Measure 2 231 243 357 10 X 4

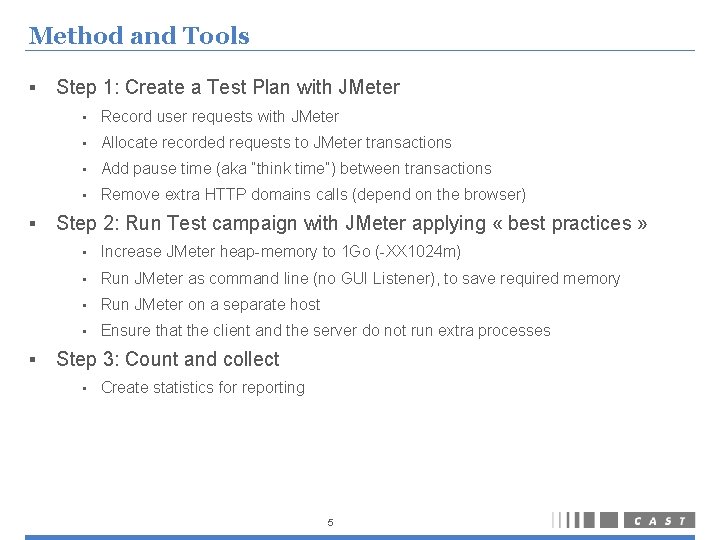
Method and Tools § § § Step 1: Create a Test Plan with JMeter • Record user requests with JMeter • Allocate recorded requests to JMeter transactions • Add pause time (aka “think time”) between transactions • Remove extra HTTP domains calls (depend on the browser) Step 2: Run Test campaign with JMeter applying « best practices » • Increase JMeter heap-memory to 1 Go (-XX 1024 m) • Run JMeter as command line (no GUI Listener), to save required memory • Run JMeter on a separate host • Ensure that the client and the server do not run extra processes Step 3: Count and collect • Create statistics for reporting 5

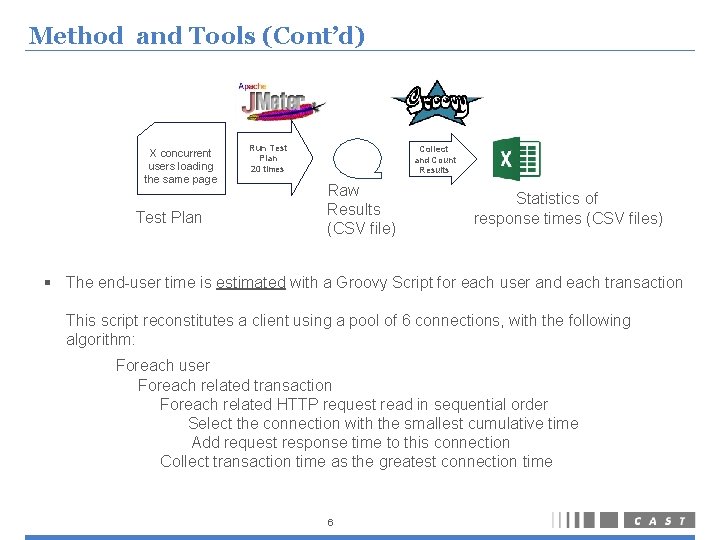
Method and Tools (Cont’d) X concurrent users loading the same page Test Plan Run Test Plan 20 times Collect and Count Results Raw Results (CSV file) Statistics of response times (CSV files) § The end-user time is estimated with a Groovy Script for each user and each transaction This script reconstitutes a client using a pool of 6 connections, with the following algorithm: Foreach user Foreach related transaction Foreach related HTTP request read in sequential order Select the connection with the smallest cumulative time Add request response time to this connection Collect transaction time as the greatest connection time 6

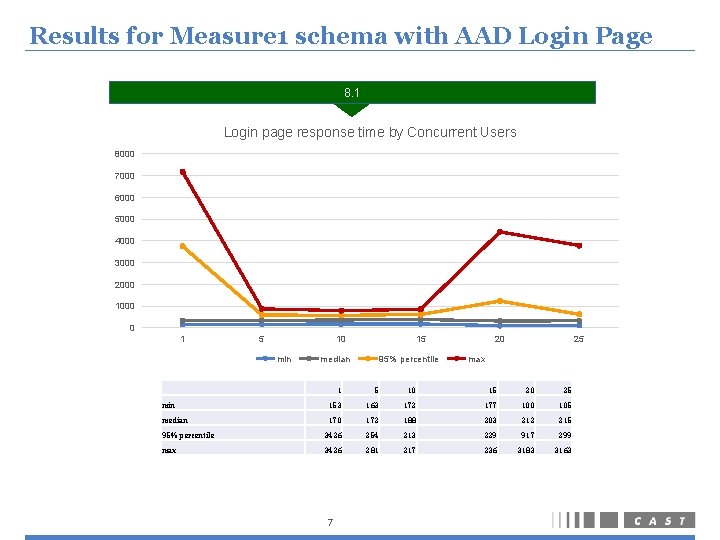
Results for Measure 1 schema with AAD Login Page 8. 1 Login page response time by Concurrent Users 8000 7000 6000 5000 4000 3000 2000 1000 0 1 5 10 min 15 median 95% percentile 20 25 max 1 5 10 15 20 25 min 153 163 172 177 100 105 median 170 172 188 203 212 215 95% percentile 3426 254 213 229 917 299 max 3426 281 217 236 3183 3163 7

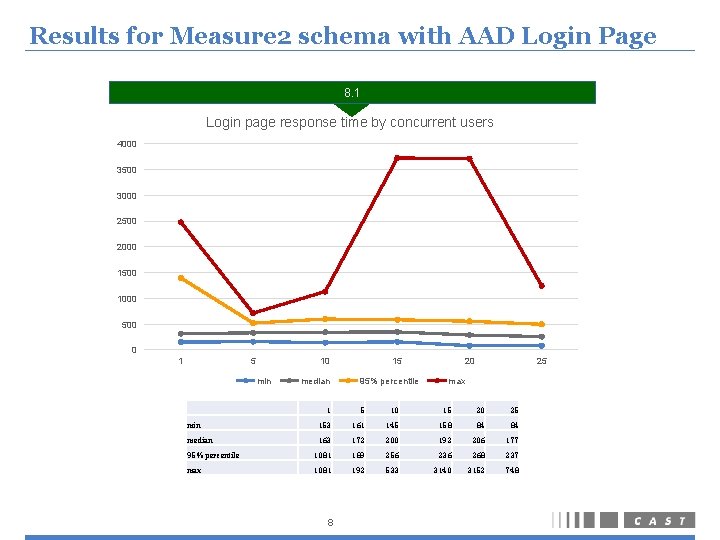
Results for Measure 2 schema with AAD Login Page 8. 1 Login page response time by concurrent users 4000 3500 3000 2500 2000 1500 1000 500 0 1 5 10 min median 15 95% percentile 20 25 max 1 5 10 15 20 25 min 153 161 145 158 84 84 median 163 172 200 192 206 177 95% percentile 1081 189 256 236 268 237 max 1081 192 533 3140 3152 748 8

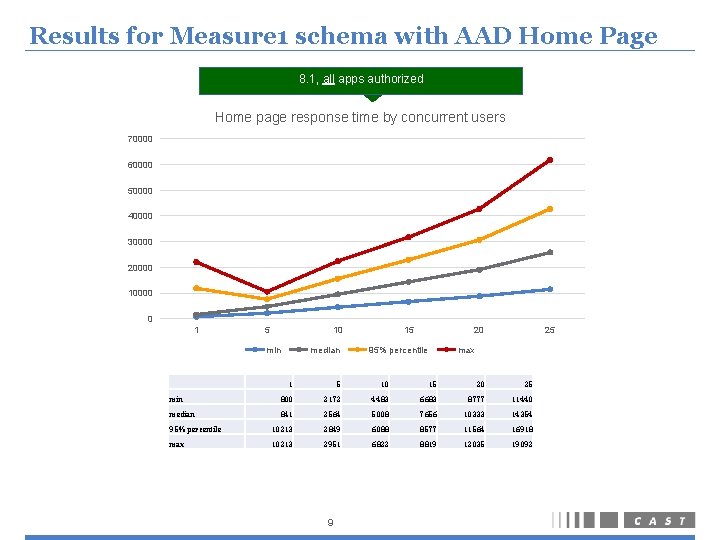
Results for Measure 1 schema with AAD Home Page 8. 1, all apps authorized Home page response time by concurrent users 70000 60000 50000 40000 30000 20000 10000 0 1 5 10 min median 15 20 95% percentile 25 max 1 5 10 15 20 25 min 800 2172 4483 6683 8777 11440 median 841 2564 5008 7656 10333 14354 95% percentile 10213 2849 6088 8577 11564 16918 max 10213 2951 6822 8819 12035 19092 9

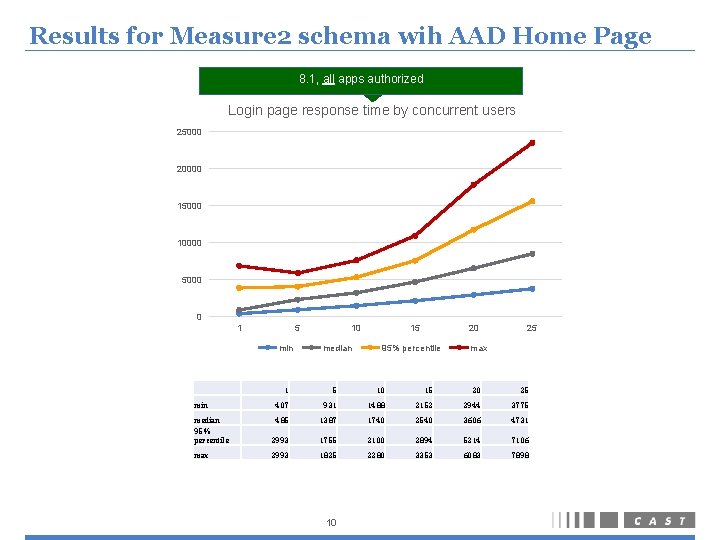
Results for Measure 2 schema wih AAD Home Page 8. 1, all apps authorized Login page response time by concurrent users 25000 20000 15000 10000 5000 0 1 5 min 1 10 median 15 20 95% percentile 25 max 5 10 15 20 25 min 407 931 1488 2152 2944 3775 median 95% percentile 485 1387 1740 2540 3606 4731 2993 1755 2100 2894 5214 7106 max 2993 1825 2280 3353 6083 7898 10

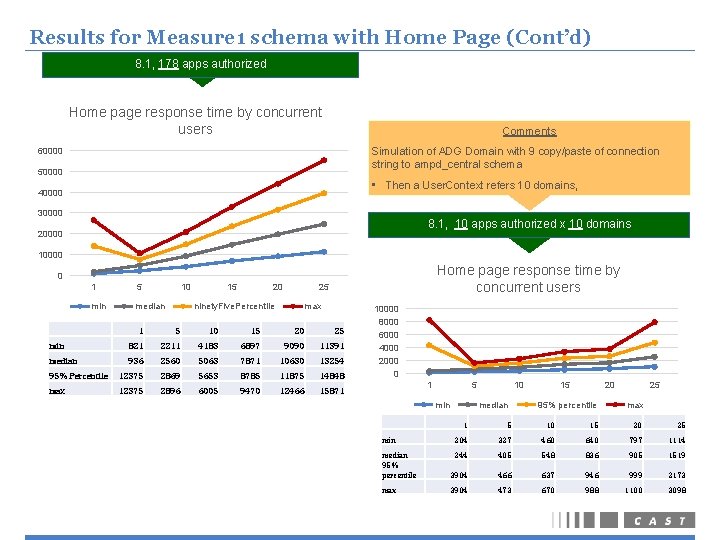
Results for Measure 1 schema with Home Page (Cont’d) 8. 1, 178 apps authorized Home page response time by concurrent users Comments Simulation of ADG Domain with 9 copy/paste of connection string to ampd_central schema 60000 50000 • Then a User. Context refers 10 domains, 40000 30000 8. 1, 10 apps authorized x 10 domains 20000 10000 Home page response time by concurrent users 0 1 5 min median 10 15 20 25 ninety. Five. Percentile max 1 5 10 15 20 25 821 2211 4183 6897 9090 11391 936 2560 5063 7871 10630 13254 95% Percentile 12375 2869 5653 8785 11875 14848 max 12375 2896 6005 9470 12466 15871 10000 8000 6000 4000 2000 0 1 5 min 10 median 15 20 95% percentile 25 max 1 5 10 15 20 25 min 204 327 460 640 797 1114 median 95% percentile 244 405 548 836 905 1519 3904 466 637 946 999 2173 max 3904 473 670 988 1100 3098

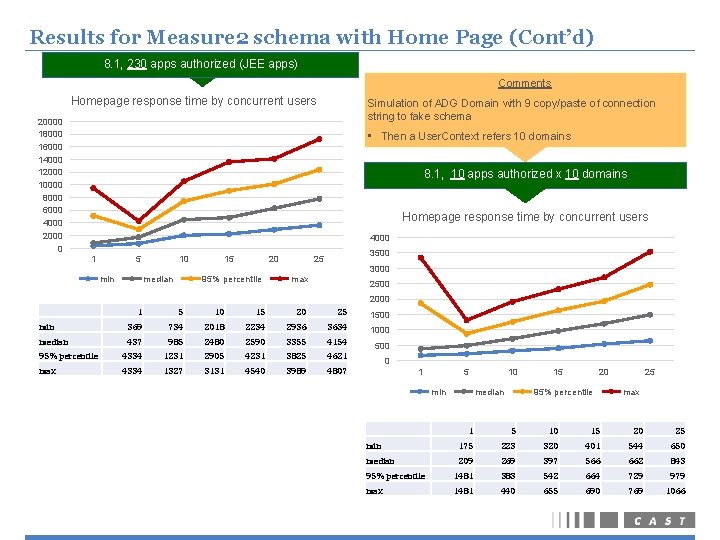
Results for Measure 2 schema with Home Page (Cont’d) 8. 1, 230 apps authorized (JEE apps) Comments Homepage response time by concurrent users Simulation of ADG Domain with 9 copy/paste of connection string to fake schema 20000 18000 16000 14000 12000 10000 8000 6000 4000 2000 0 • Then a User. Context refers 10 domains 8. 1, 10 apps authorized x 10 domains Homepage response time by concurrent users 4000 1 5 min 10 median 15 20 95% percentile 3500 25 3000 max 2500 2000 1 5 10 15 20 25 1500 min 369 734 2018 2234 2936 3634 1000 median 437 985 2480 2590 3355 4154 500 95% percentile 4334 1231 2905 4231 3825 4621 max 4334 1327 3131 4540 3989 4807 0 1 5 min 10 median 15 20 95% percentile 25 max 1 5 10 15 20 25 min 175 223 320 401 544 650 median 209 269 397 566 662 843 95% percentile 1481 383 542 664 729 979 max 1481 440 655 690 769 1066

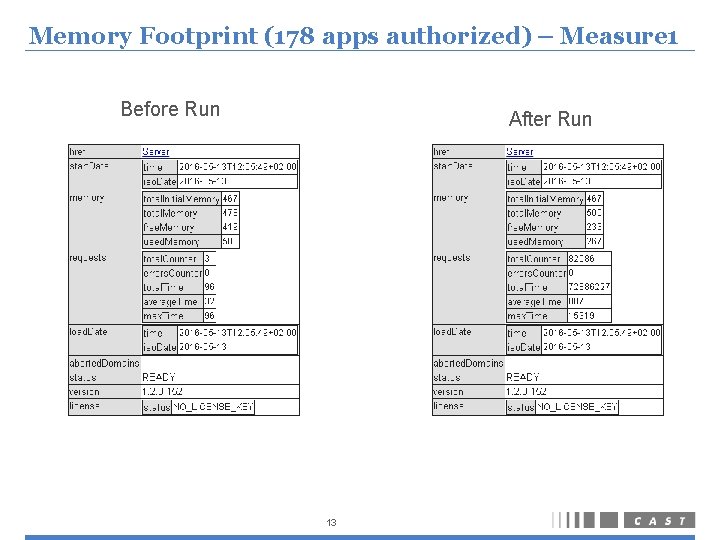
Memory Footprint (178 apps authorized) – Measure 1 Before Run After Run 13

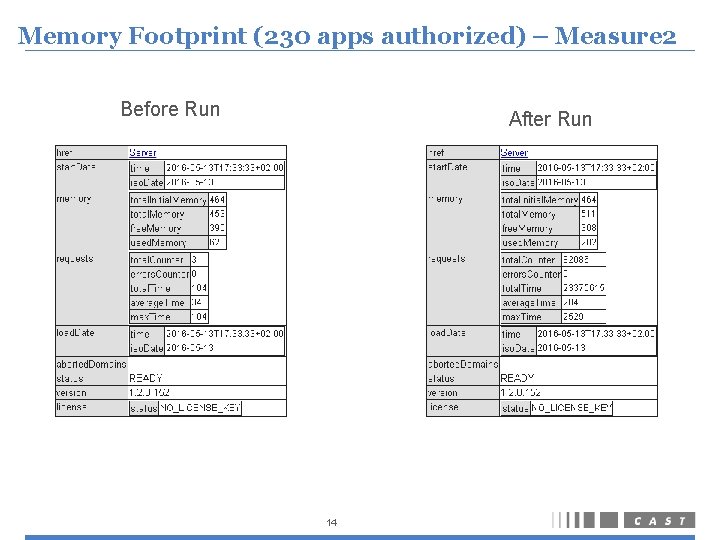
Memory Footprint (230 apps authorized) – Measure 2 Before Run After Run 14

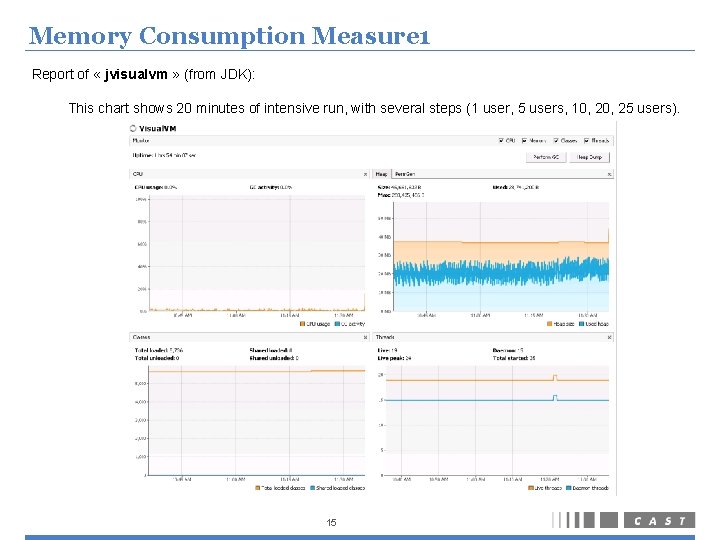
Memory Consumption Measure 1 Report of « jvisualvm » (from JDK): This chart shows 20 minutes of intensive run, with several steps (1 user, 5 users, 10, 25 users). 15

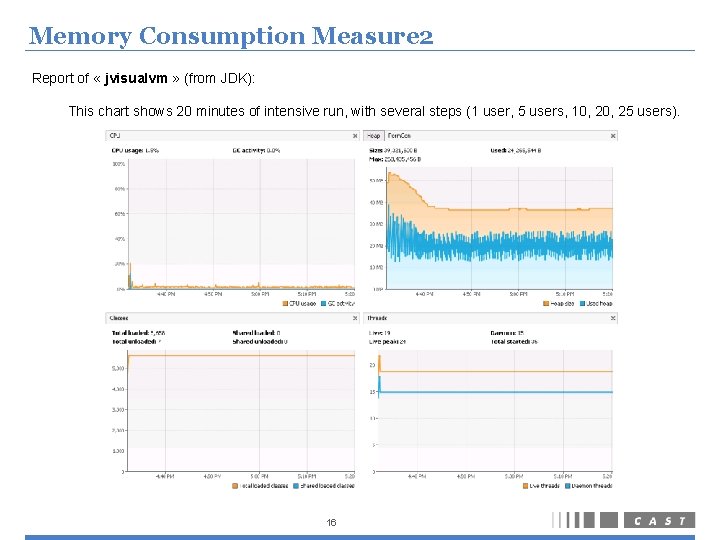
Memory Consumption Measure 2 Report of « jvisualvm » (from JDK): This chart shows 20 minutes of intensive run, with several steps (1 user, 5 users, 10, 25 users). 16