2020 Norms Whats New Different Nate Jensen Ph

- Slides: 15
2020 Norms: What’s New & Different? Nate Jensen, Ph. D. – Director, Center for School & Student Progress, NWEA
What Resources Are (or Will Be) Available? • 2020 MAP Growth Norms Introduction and FAQ • 2020 MAP Growth Norms Overview • 2020 Norms detail tables • 2020 Comparative Data to Inform Instruction one-sheet • Norms by Quintile • Full Norming Study • Updated ASG Calculator
Why Are Norms So Important? • A RIT score (or change in RIT score) by itself is meaningless • Norms provide one important piece of context, and allow us to answer questions like: • How does a student’s achievement compare to other students in the same grade and subject area at that term? • How much gain might we expect to see between two tests, given a certain set of characteristics? • Is my student showing average gains? Above average? Below average? • I want my student to be on-track for proficiency at the end of the year – how much growth does he need to show, and is that growth goal realistic? • Of course, “who” the norms are based on matters (a lot)
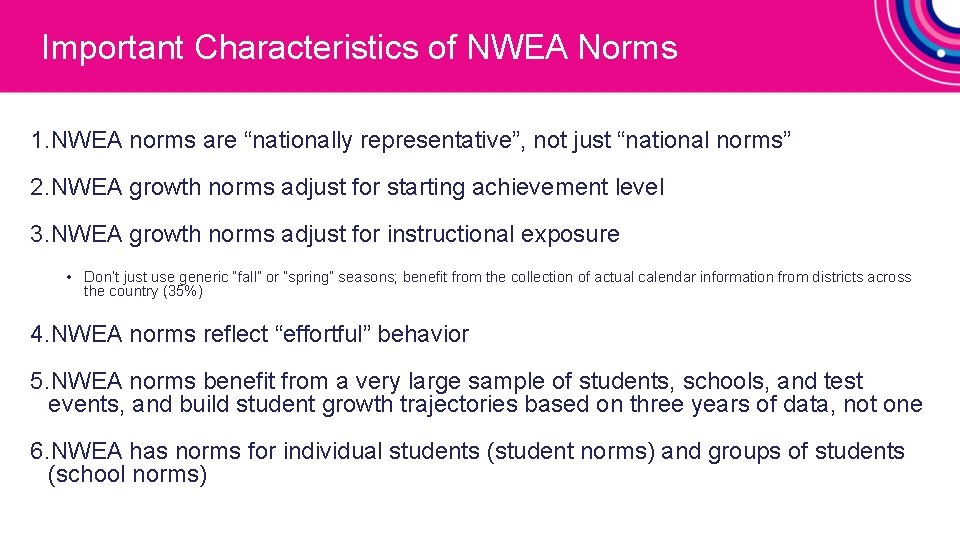
Important Characteristics of NWEA Norms 1. NWEA norms are “nationally representative”, not just “national norms” 2. NWEA growth norms adjust for starting achievement level 3. NWEA growth norms adjust for instructional exposure • Don’t just use generic “fall” or “spring” seasons; benefit from the collection of actual calendar information from districts across the country (35%) 4. NWEA norms reflect “effortful” behavior 5. NWEA norms benefit from a very large sample of students, schools, and test events, and build student growth trajectories based on three years of data, not one 6. NWEA has norms for individual students (student norms) and groups of students (school norms)
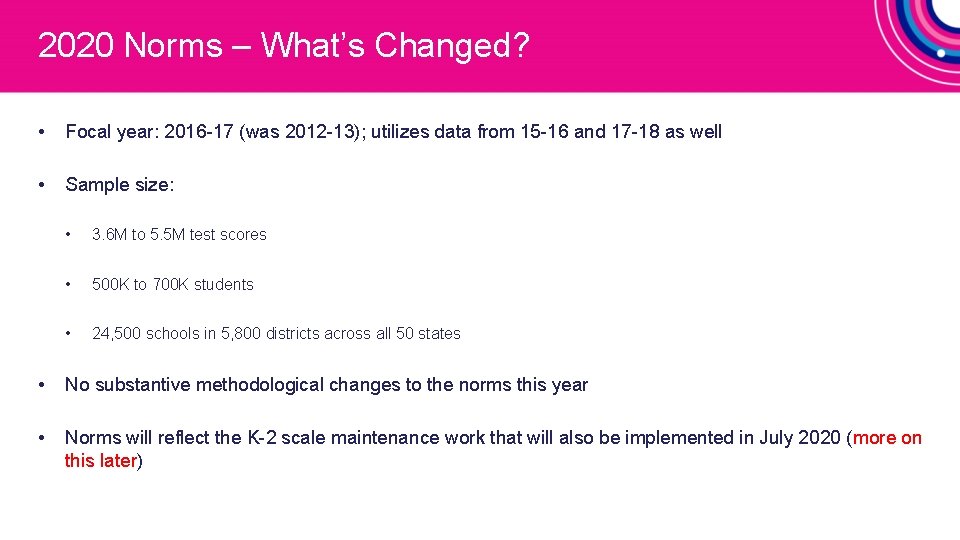
2020 Norms – What’s Changed? • Focal year: 2016 -17 (was 2012 -13); utilizes data from 15 -16 and 17 -18 as well • Sample size: • 3. 6 M to 5. 5 M test scores • 500 K to 700 K students • 24, 500 schools in 5, 800 districts across all 50 states • No substantive methodological changes to the norms this year • Norms will reflect the K-2 scale maintenance work that will also be implemented in July 2020 (more on this later)
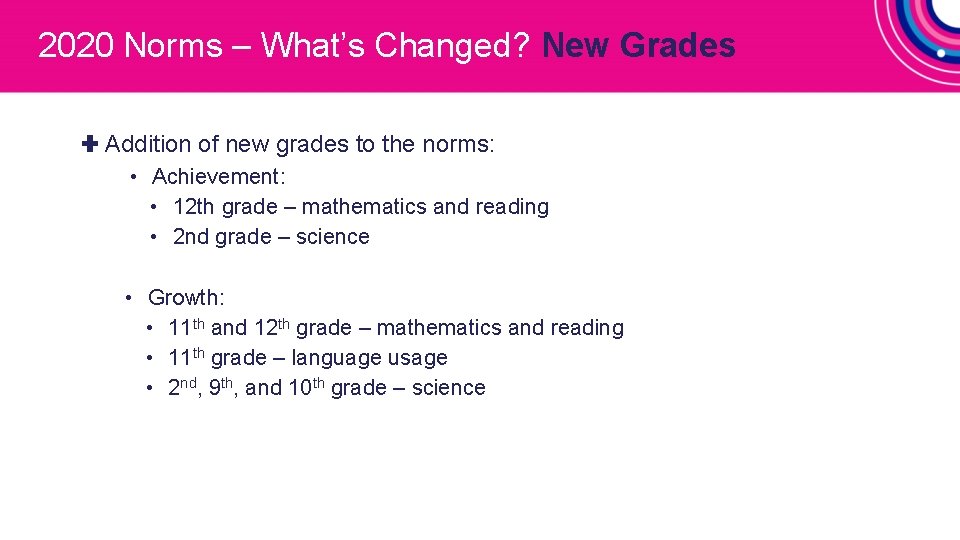
2020 Norms – What’s Changed? New Grades ✚ Addition of new grades to the norms: • Achievement: • 12 th grade – mathematics and reading • 2 nd grade – science • Growth: • 11 th and 12 th grade – mathematics and reading • 11 th grade – language usage • 2 nd, 9 th, and 10 th grade – science
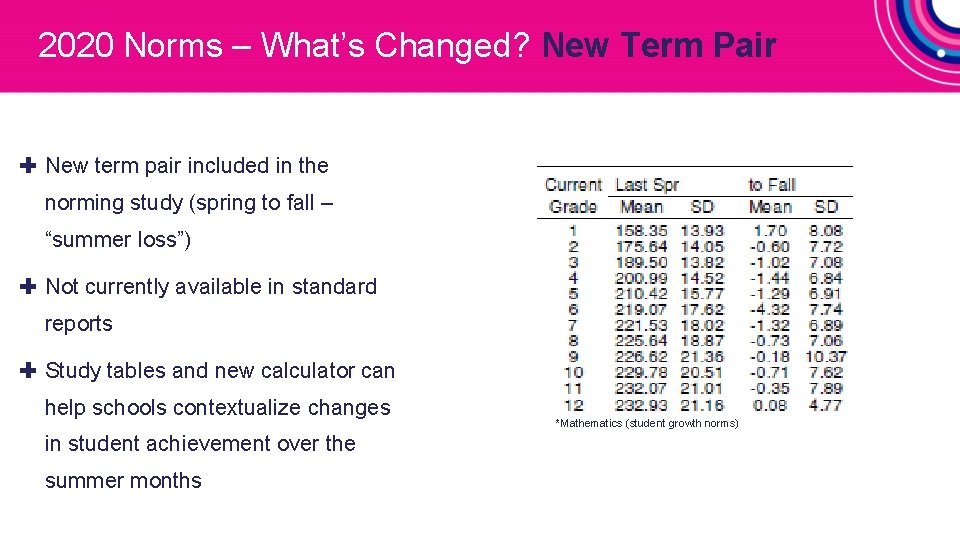
2020 Norms – What’s Changed? New Term Pair ✚ New term pair included in the norming study (spring to fall – “summer loss”) ✚ Not currently available in standard reports ✚ Study tables and new calculator can help schools contextualize changes in student achievement over the summer months *Mathematics (student growth norms)
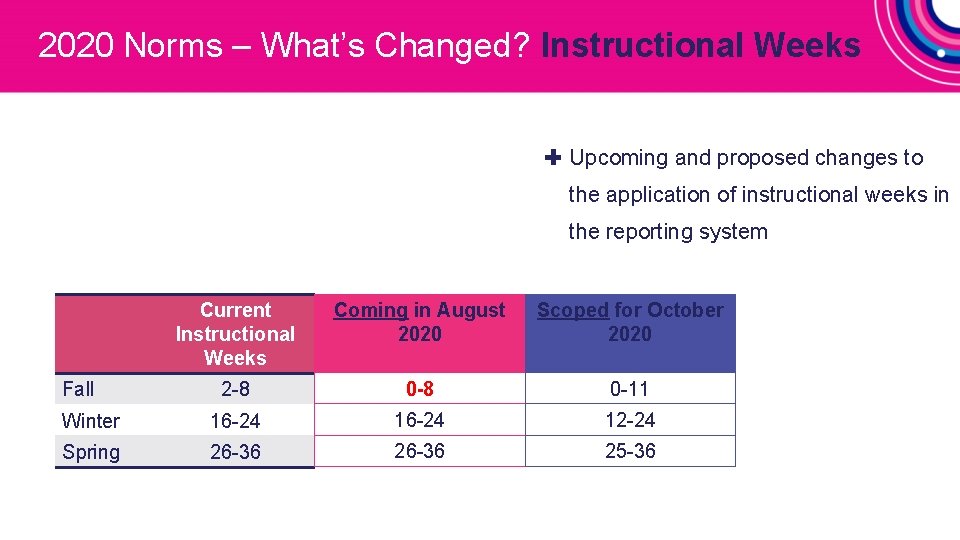
2020 Norms – What’s Changed? Instructional Weeks ✚ Upcoming and proposed changes to the application of instructional weeks in the reporting system Current Instructional Weeks Coming in August 2020 Scoped for October 2020 2 -8 0 -11 Winter 16 -24 12 -24 Spring 26 -36 25 -36 Fall
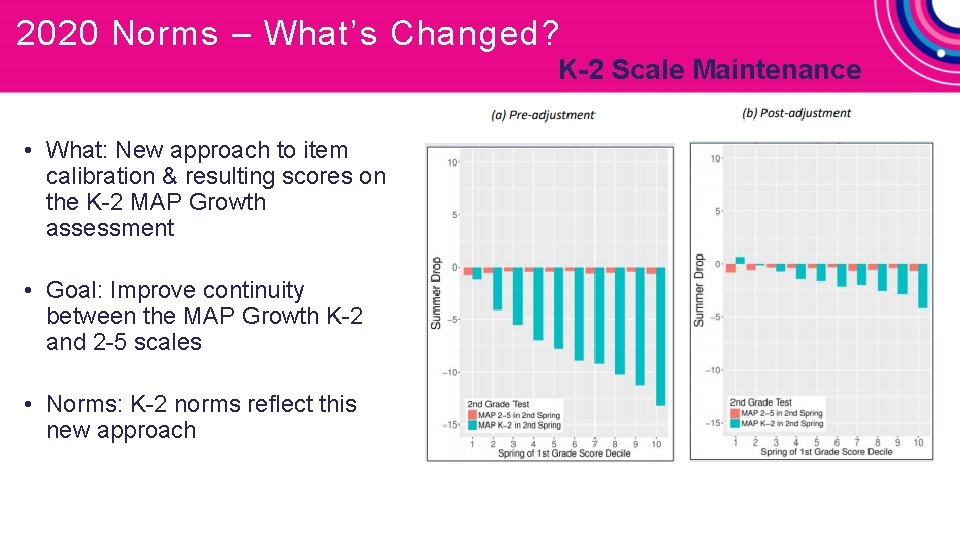
2020 Norms – What’s Changed? K-2 Scale Maintenance • What: New approach to item calibration & resulting scores on the K-2 MAP Growth assessment • Goal: Improve continuity between the MAP Growth K-2 and 2 -5 scales • Norms: K-2 norms reflect this new approach
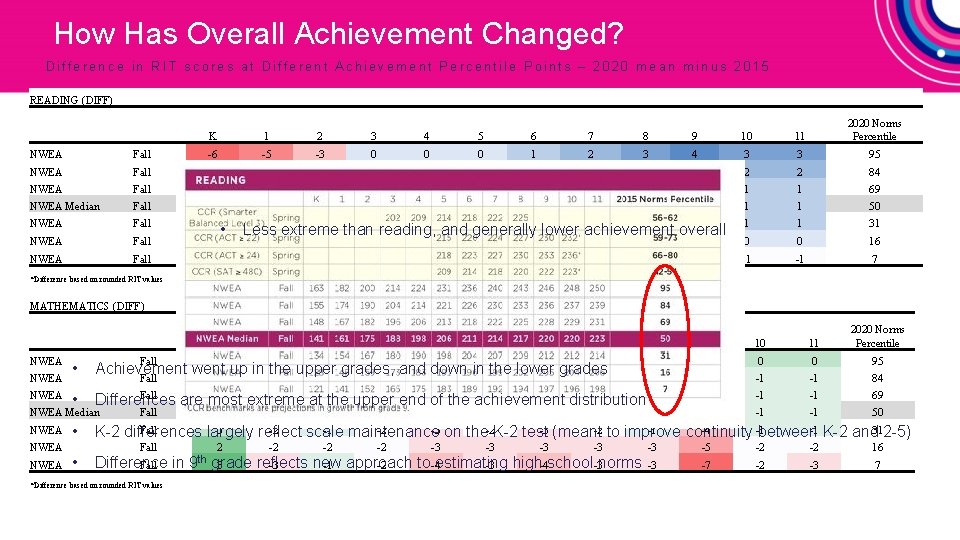
How Has Overall Achievement Changed? Difference in RIT scores at Different Achievement Percentile Points – 2020 mean minus 2015 READING (DIFF) K 1 2 3 4 5 6 7 8 9 10 11 2020 Norms Percentile NWEA Fall -6 -5 -3 0 0 0 1 2 3 4 3 3 95 NWEA Fall -6 -5 -3 -1 -1 0 1 1 2 2 84 NWEA Fall -5 -5 -2 -1 -1 0 0 0 1 1 69 NWEA Median Fall -4 -5 -3 -1 -1 -2 -1 0 1 -1 1 1 50 NWEA Fall -3 1 1 31 NWEA Fall -4 NWEA Fall -2 • NWEA NWEA -2 -3 -3 -3 -2 -1 -1 -5 0 0 16 -4 -2 -3 -3 -2 -1 -6 -1 -1 7 K 1 2 3 4 5 6 7 8 9 10 11 2020 Norms Percentile Fall -5 -3 -3 -1 -2 -2 -2 -1 0 0 95 • Achievement went up in the upper grades, and down in-2 the lower grades Fall -3 -3 -2 -1 -2 -2 -1 0 -2 -1 -1 84 • Fall -2 -3 -2 -2 -2 -1 Differences are most extreme at -2 the upper end of the achievement distribution -3 -1 -1 69 -4 -1 -1 50 • Fall 0 -2 -1 maintenance -2 -3 on the-2 K-2 test -3 (meant -2 to improve -1 -4 -1 -1 K-2 and 312 -5) K-2 differences largely reflect scale continuity between NWEA Median NWEA -5 *Difference based on rounded RIT values MATHEMATICS (DIFF) -4 -2 -2 -1 1 -3 Less extreme than-2 reading, and generally lower achievement overall • Fall Difference Fall in *Difference based on rounded RIT values 0 9 th -2 2 -2 -2 -2 -3 -3 -3 -1 -3 grade reflects new to -4 estimating high-4 school-3 norms 3 -3 -1 approach -2 -3 -3 -5 -2 -2 16 -3 -7 -2 -3 7
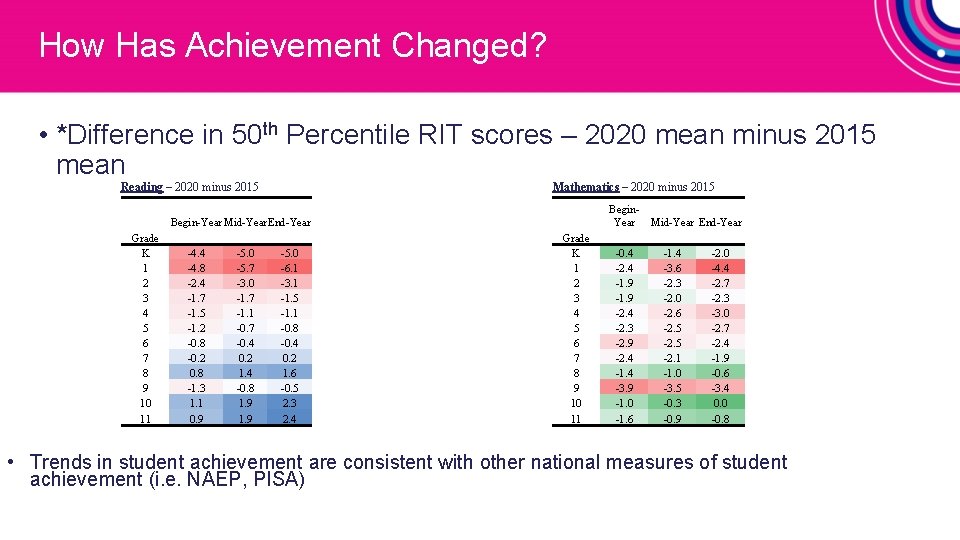
How Has Achievement Changed? • *Difference in 50 th Percentile RIT scores – 2020 mean minus 2015 mean Reading – 2020 minus 2015 Mathematics – 2020 minus 2015 Grade K 1 2 3 4 5 6 7 8 9 10 11 Begin-Year Mid-Year. End-Year -4. 4 -5. 0 -4. 8 -5. 7 -6. 1 -2. 4 -3. 0 -3. 1 -1. 7 -1. 5 -1. 1 -1. 2 -0. 7 -0. 8 -0. 4 -0. 2 0. 8 1. 4 1. 6 -1. 3 -0. 8 -0. 5 1. 1 1. 9 2. 3 0. 9 1. 9 2. 4 Grade K 1 2 3 4 5 6 7 8 9 10 11 Begin. Year -0. 4 -2. 4 -1. 9 -2. 4 -2. 3 -2. 9 -2. 4 -1. 4 -3. 9 -1. 0 -1. 6 Mid-Year End-Year -1. 4 -2. 0 -3. 6 -4. 4 -2. 3 -2. 7 -2. 0 -2. 3 -2. 6 -3. 0 -2. 5 -2. 7 -2. 5 -2. 4 -2. 1 -1. 9 -1. 0 -0. 6 -3. 5 -3. 4 -0. 3 0. 0 -0. 9 -0. 8 • Trends in student achievement are consistent with other national measures of student achievement (i. e. NAEP, PISA)
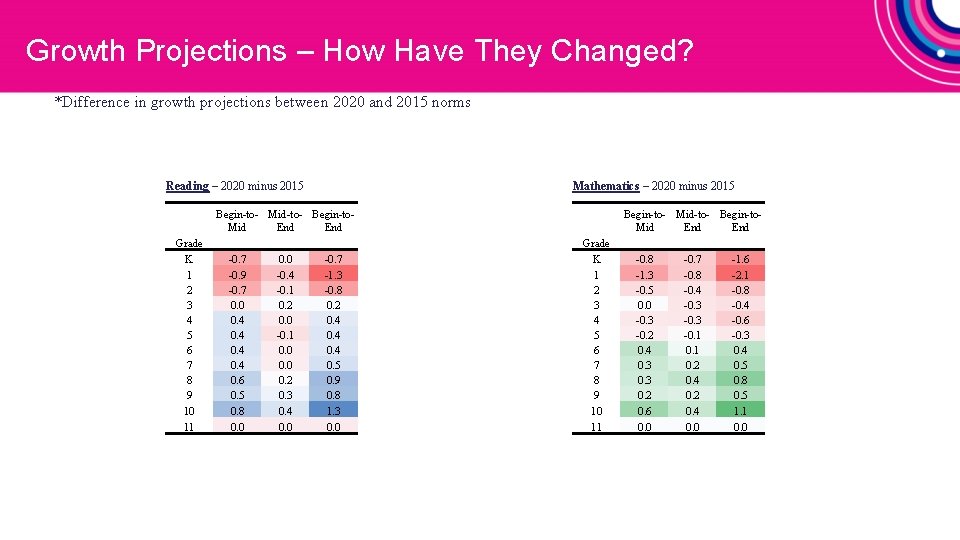
Growth Projections – How Have They Changed? *Difference in growth projections between 2020 and 2015 norms Reading – 2020 minus 2015 Grade K 1 2 3 4 5 6 7 8 9 10 11 Begin-to- Mid-to- Begin-to. Mid End -0. 7 0. 0 -0. 7 -0. 9 -0. 4 -1. 3 -0. 7 -0. 1 -0. 8 0. 0 0. 2 0. 4 0. 0 0. 4 -0. 1 0. 4 0. 0 0. 5 0. 6 0. 2 0. 9 0. 5 0. 3 0. 8 0. 4 1. 3 0. 0 Mathematics – 2020 minus 2015 Grade K 1 2 3 4 5 6 7 8 9 10 11 Begin-to- Mid-to- Begin-to. Mid End -0. 8 -0. 7 -1. 6 -1. 3 -0. 8 -2. 1 -0. 5 -0. 4 -0. 8 0. 0 -0. 3 -0. 4 -0. 3 -0. 6 -0. 2 -0. 1 -0. 3 0. 4 0. 1 0. 4 0. 3 0. 2 0. 5 0. 3 0. 4 0. 8 0. 2 0. 5 0. 6 0. 4 1. 1 0. 0
Application of the 2020 Norms - Considerations When there are new norms… • Partners should apply the newest norms to all data • Don’t want to have a “break” in norms • Historical reports will automatically reflect this
Application of the 2020 Norms - Considerations ✚ And then there’s COVID… • Norms describe what is “normal” – this coming fall will not be normal (nor was the prior spring) • Norms can still be useful in the fall to understand how student achievement has changed, but caution is needed (especially when “stakes” are attached”) • Underscores the need to treat fall in many ways as a restart…. and focus attention forward instead of backward. Where are kids now, where do they need to go, and how do we help them get there?
Questions? Thank you! Nate Jensen, Ph. D. nate. jensen@nwea. org