2017 18 Texas Academic Performance Report Northwest Independent


 Grade 1735 1620 1619 1781 1713")


- Slides: 16
2017 -18 Texas Academic Performance Report Northwest Independent School District Public Hearing January 8, 2018
What is the TAPR? • Designed to pull together many pieces of data related to schools, district, programs, and student performance in one report. • STAAR/EOC performance + participation • Student Success Initiative • English Language Learners • Attendance rates • High school completion rates • Indicators of college readiness • District Financial Report
2017 District Index Scores
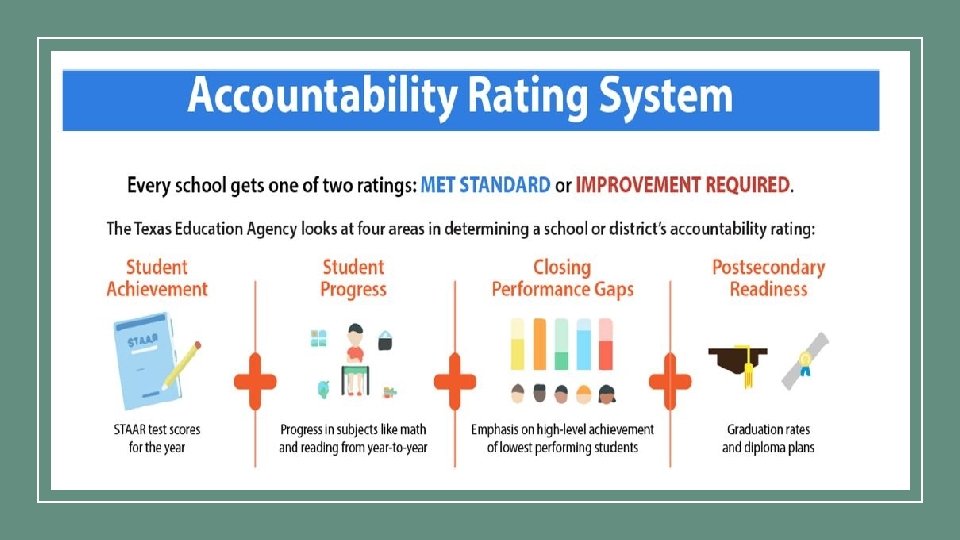
2017 State Accountability Ratings • The district and all 28 campuses earned the state’s top rating of met standard. • Six campuses earned ten distinctions. Campus Reading/ELA Northwest HS Math Science Social Studies Student Progress Achievement Gap X Byron Nelson HS James M Steele HS X X Chisholm Trail MS X X Truett Wilson MS Kay Granger ES Post Secondary Readiness X X X
2017 state and district comparison percent of students passing at “approaches” level. 85 75 All Subjects 84 72 Reading 79 89 86 76 79 88 77 67 Mathematics State Writing District Science Social Studies
2017 state and district comparison percent of students passing at “meets” level. 60 48 67 62 48 57 48 48 52 65 51 38 Two or More Subjects Reading Mathematics State Writing District Science Social Studies
2017 state and district comparison percent of students passing at “masters” level. 40 29 20 28 30 28 27 23 19 18 19 12 All subjects Reading Mathematics State Writing District Science Social Studies
2017 state and district comparison percent of students meeting or exceeding progress on year over year STAAR tests. 68 65 63 64 61 59 Both subjects Reading State District Mathematics
College-Readiness Indicators 2016 Graduates 60, 4 44, 3 60 49, 5 47, 8 41 35, 9 25, 5 Completion of Adv. /Dual CTE Coherent Sequence Credit Courses Any Subject State AP Participation Any Subject District AP Results Any Subject
Program Counts 2016 to 2017 Count 2017 2016 Percent 2017 2016 Bilingual/ESL Education 1123 1016 5. 1 5. 0 Career & Technical Education 5228 4176 23. 8 21. 1 Gifted & Talented Education 2149 1859 9. 8 9. 4 Special Education 1882 1541 8. 6 7. 8
2017 Enrollment By Grade (Total 21, 964 students) Grade 1735 1620 1619 1781 1713 1727 1747 1725 1727 1658 1778 1546 1299 235 Gr ad e 12 11 ad Gr e 10 9 e ad Gr Gr ad e 8 7 Gr ad e 6 Gr ad e 5 Gr ad e 4 Gr ad e 3 e ad Gr Gr ad e 2 1 e ad ga er nd Ki Gr rte n -K Pr e EC E 54
7 -1 16 6 -1 15 5 -1 14 4 -1 13 3 -1 12 2 2023 20 20 20 -1 11 1 -1 10 0 -1 09 9 8 -0 08 20 20 -0 07 7 -0 06 6 928 20 20 -0 05 5 769 20 -0 04 4 -0 03 NISD Total Staff 20 20 2243 2102 1877 1763 1636 1638 1462 1284 1152 1003 812
Financial Standards Report 2016 -17
Links to view the reports • NISD TAPR • http: //www. nisdtx. org/cms/One. aspx? portal. Id=232201&page. Id=382123 • NISD School Report Cards • http: //www. nisdtx. org/cms/One. aspx? portal. Id=232201&page. Id=381803 • Financial Standards Report • https: //rptsvr 1. tea. texas. gov/cgi/sas/broker? _service=marykay&_program=sf adhoc. budget_report_2017. sas&_service=appserv&_debug=0&who_box=&w ho_list=061911
Open for questions