18052021 An Overview of Software Development Effort and
- Slides: 23
18/05/2021 An Overview of Software Development Effort and Cost Estimation Techniques Professor Ron Kenett Tel Aviv University School of Engineering 1
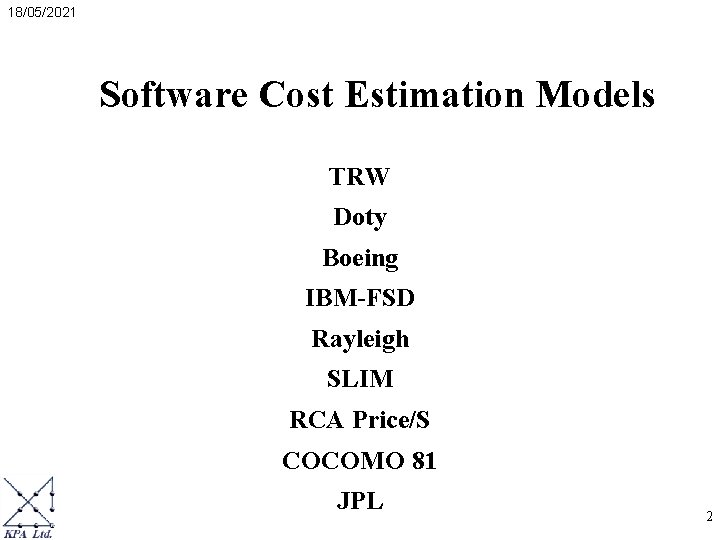
18/05/2021 Software Cost Estimation Models TRW Doty Boeing IBM-FSD Rayleigh SLIM RCA Price/S COCOMO 81 JPL 2
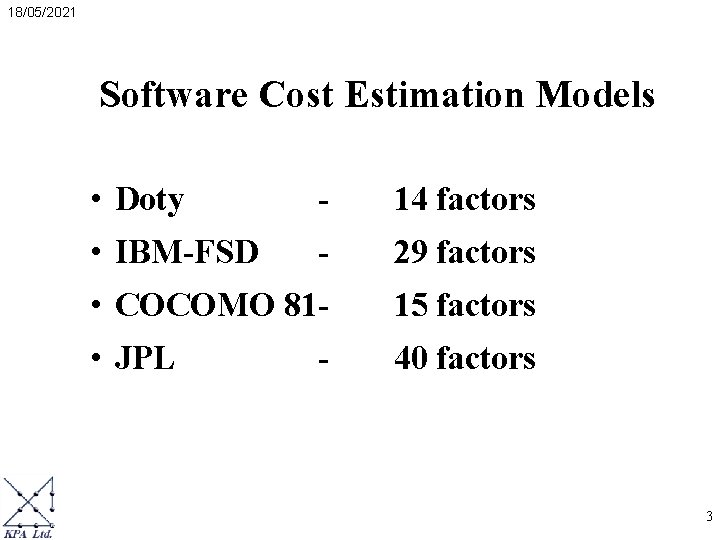
18/05/2021 Software Cost Estimation Models • Doty - 14 factors • IBM-FSD - 29 factors • COCOMO 81 - 15 factors • JPL 40 factors - 3
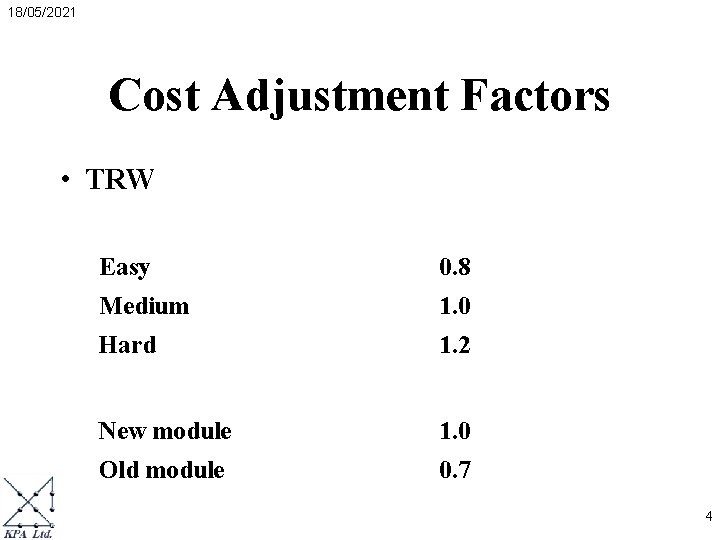
18/05/2021 Cost Adjustment Factors • TRW Easy 0. 8 Medium 1. 0 Hard 1. 2 New module 1. 0 Old module 0. 7 4
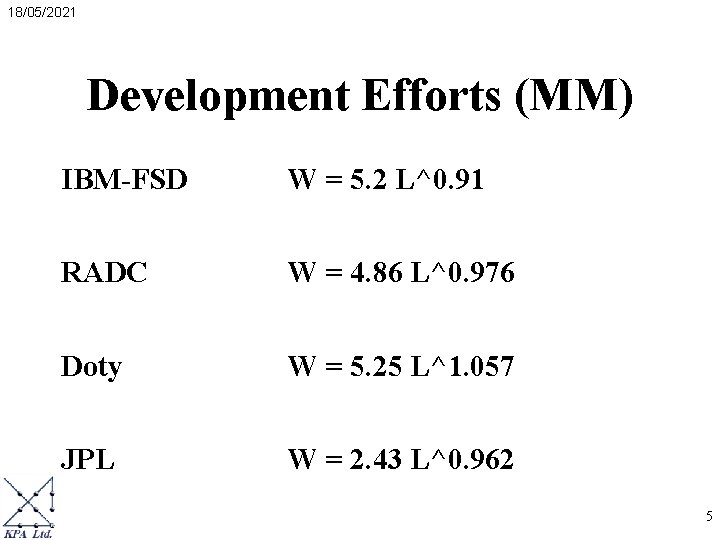
18/05/2021 Development Efforts (MM) IBM-FSD W = 5. 2 L^0. 91 RADC W = 4. 86 L^0. 976 Doty W = 5. 25 L^1. 057 JPL W = 2. 43 L^0. 962 5
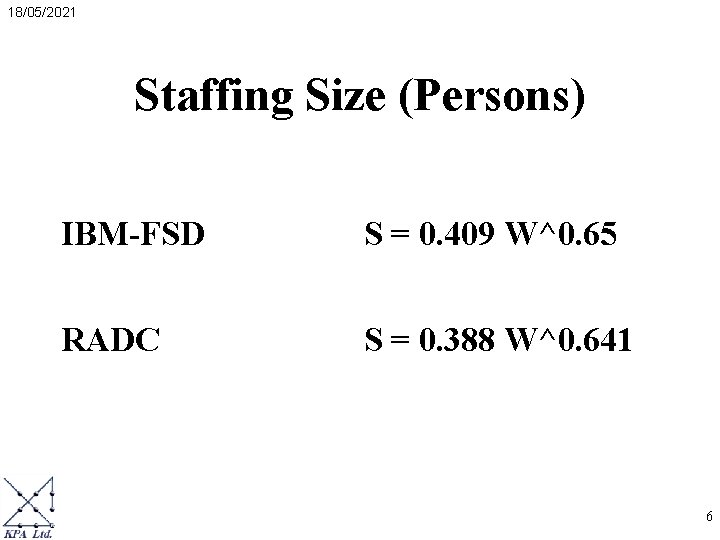
18/05/2021 Staffing Size (Persons) IBM-FSD S = 0. 409 W^0. 65 RADC S = 0. 388 W^0. 641 6
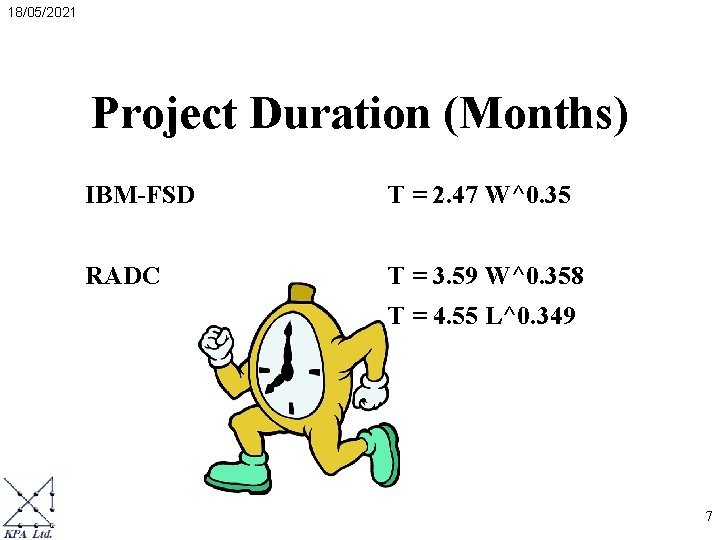
18/05/2021 Project Duration (Months) IBM-FSD T = 2. 47 W^0. 35 RADC T = 3. 59 W^0. 358 T = 4. 55 L^0. 349 7
18/05/2021 COnstructive COst Model Barry Boehm Software Engineering Economics Prentice Hall, 1981 8
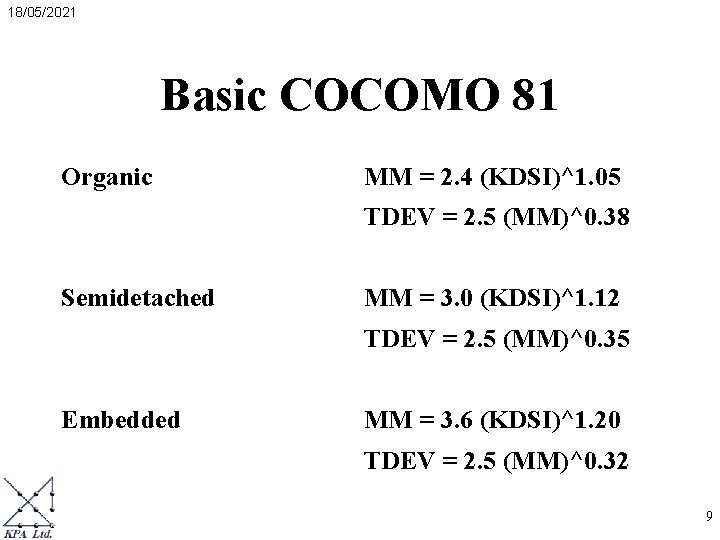
18/05/2021 Basic COCOMO 81 Organic MM = 2. 4 (KDSI)^1. 05 TDEV = 2. 5 (MM)^0. 38 Semidetached MM = 3. 0 (KDSI)^1. 12 TDEV = 2. 5 (MM)^0. 35 Embedded MM = 3. 6 (KDSI)^1. 20 TDEV = 2. 5 (MM)^0. 32 9
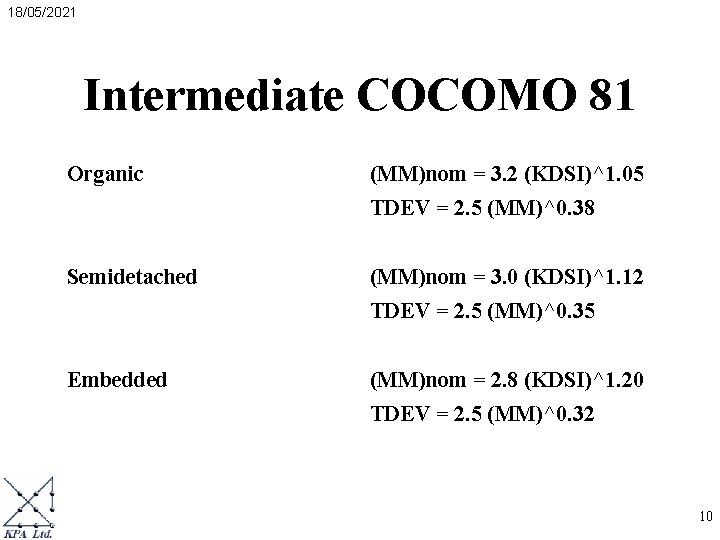
18/05/2021 Intermediate COCOMO 81 Organic (MM)nom = 3. 2 (KDSI)^1. 05 TDEV = 2. 5 (MM)^0. 38 Semidetached (MM)nom = 3. 0 (KDSI)^1. 12 TDEV = 2. 5 (MM)^0. 35 Embedded (MM)nom = 2. 8 (KDSI)^1. 20 TDEV = 2. 5 (MM)^0. 32 10
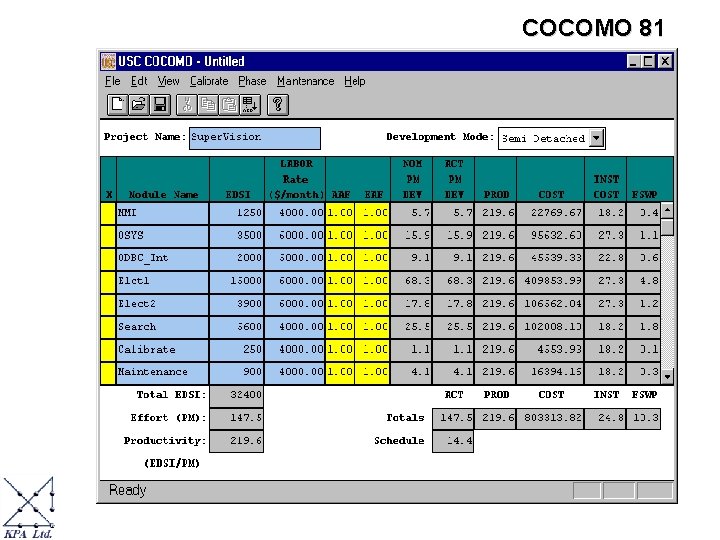
COCOMO 81
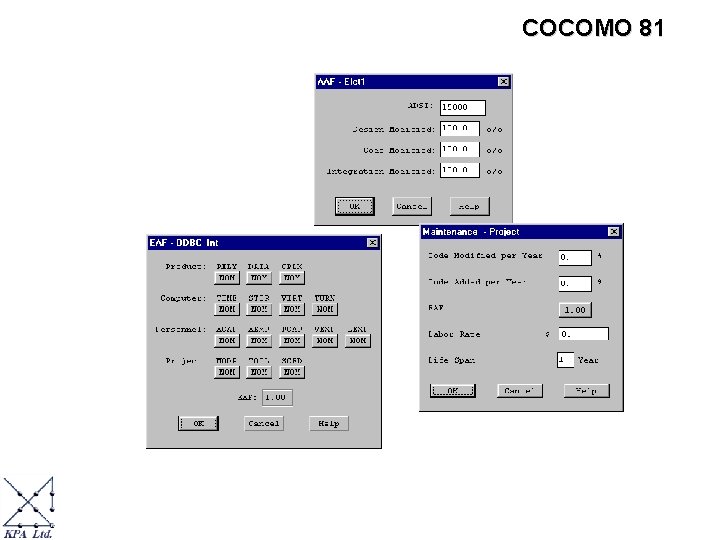
COCOMO 81
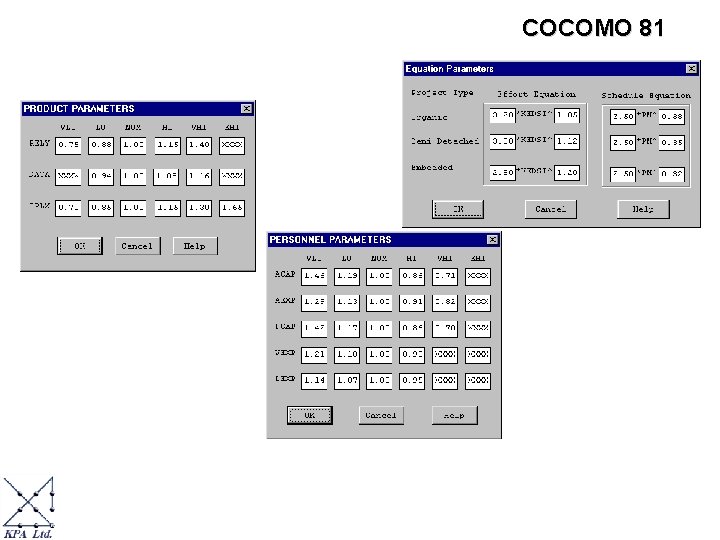
COCOMO 81
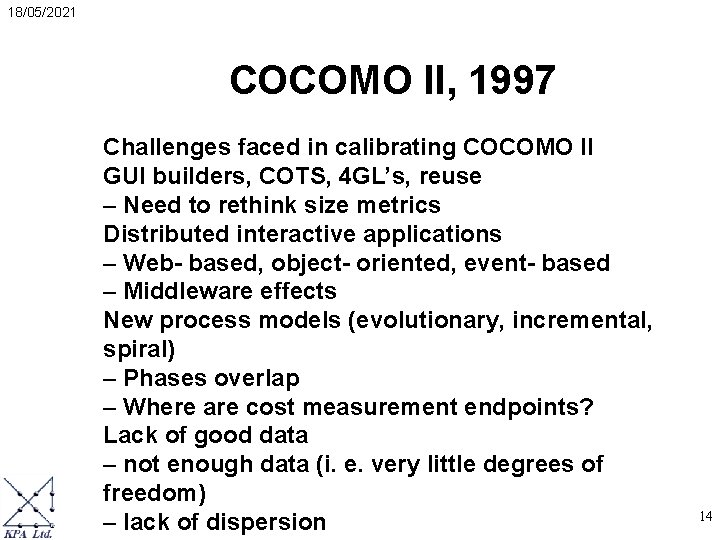
18/05/2021 COCOMO II, 1997 Challenges faced in calibrating COCOMO II GUI builders, COTS, 4 GL’s, reuse – Need to rethink size metrics Distributed interactive applications – Web- based, object- oriented, event- based – Middleware effects New process models (evolutionary, incremental, spiral) – Phases overlap – Where are cost measurement endpoints? Lack of good data – not enough data (i. e. very little degrees of freedom) – lack of dispersion 14
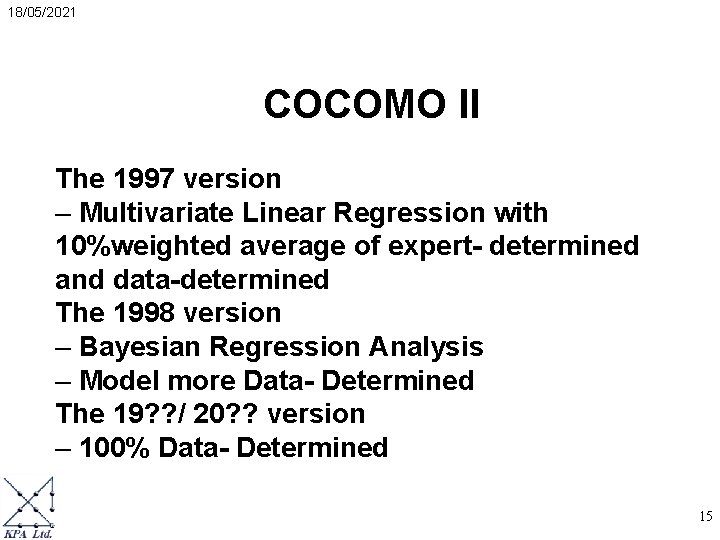
18/05/2021 COCOMO II The 1997 version – Multivariate Linear Regression with 10%weighted average of expert- determined and data-determined The 1998 version – Bayesian Regression Analysis – Model more Data- Determined The 19? ? / 20? ? version – 100% Data- Determined 15
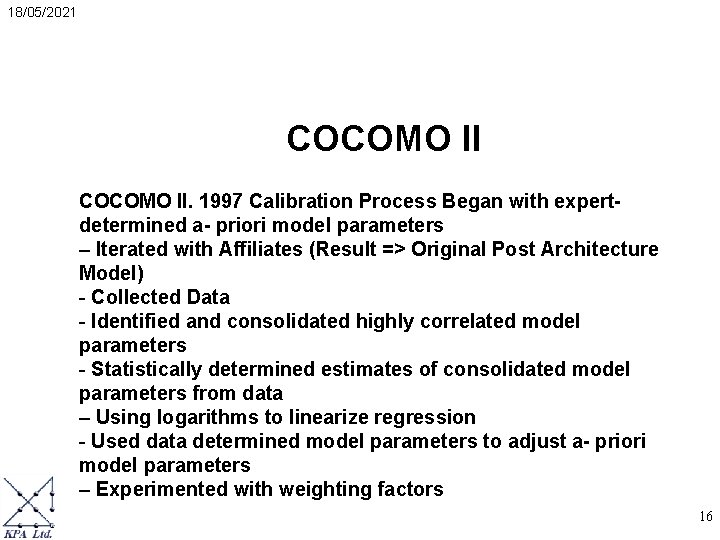
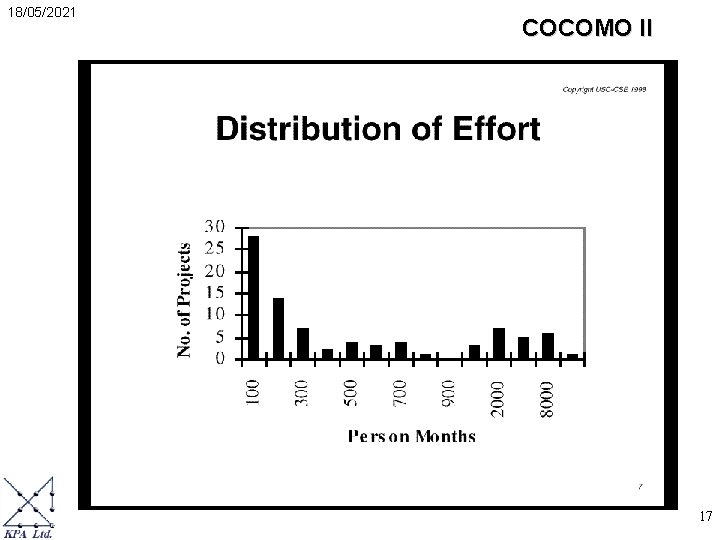
18/05/2021 COCOMO II. 1997 Calibration Process Began with expertdetermined a- priori model parameters – Iterated with Affiliates (Result => Original Post Architecture Model) - Collected Data - Identified and consolidated highly correlated model parameters - Statistically determined estimates of consolidated model parameters from data – Using logarithms to linearize regression - Used data determined model parameters to adjust a- priori model parameters – Experimented with weighting factors 16
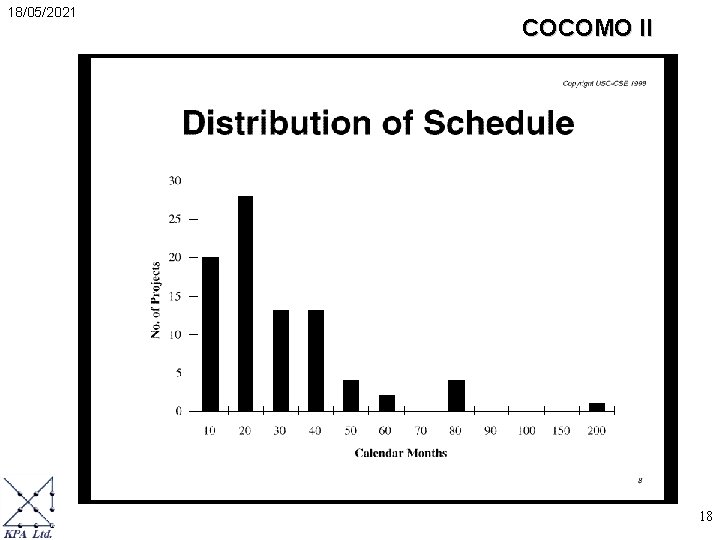
18/05/2021 COCOMO II 17
18/05/2021 COCOMO II 18
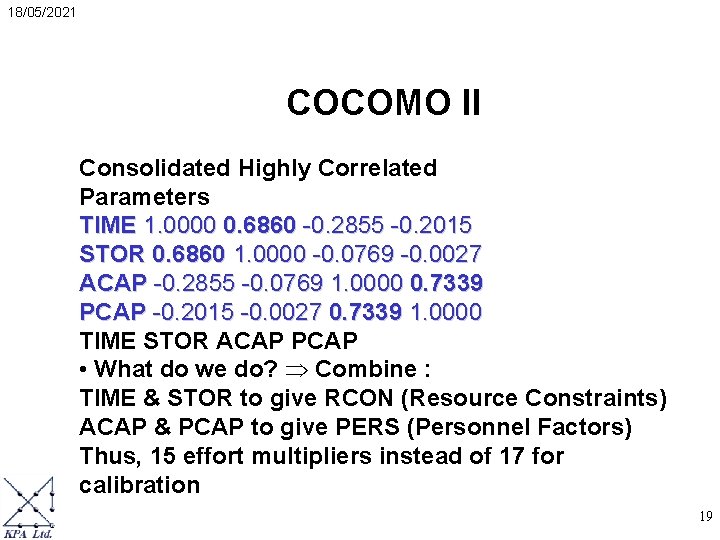
18/05/2021 COCOMO II Consolidated Highly Correlated Parameters TIME 1. 0000 0. 6860 -0. 2855 -0. 2015 STOR 0. 6860 1. 0000 -0. 0769 -0. 0027 ACAP -0. 2855 -0. 0769 1. 0000 0. 7339 PCAP -0. 2015 -0. 0027 0. 7339 1. 0000 TIME STOR ACAP PCAP • What do we do? Þ Combine : TIME & STOR to give RCON (Resource Constraints) ACAP & PCAP to give PERS (Personnel Factors) Thus, 15 effort multipliers instead of 17 for calibration 19
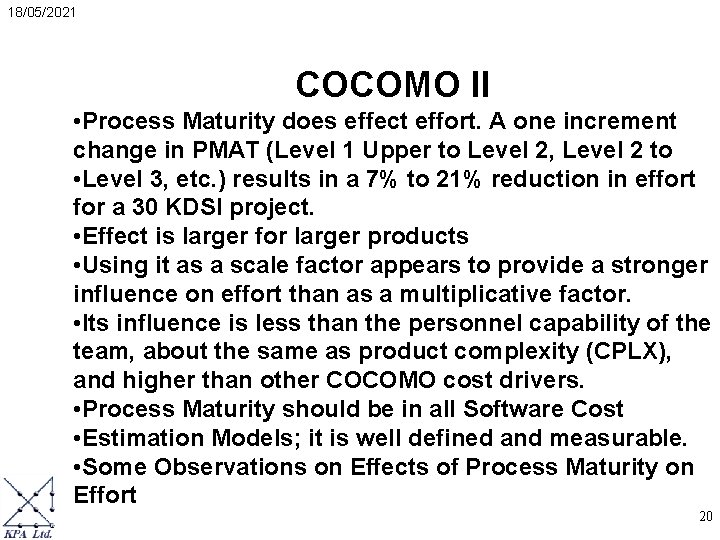
18/05/2021 COCOMO II • Process Maturity does effect effort. A one increment change in PMAT (Level 1 Upper to Level 2, Level 2 to • Level 3, etc. ) results in a 7% to 21% reduction in effort for a 30 KDSI project. • Effect is larger for larger products • Using it as a scale factor appears to provide a stronger influence on effort than as a multiplicative factor. • Its influence is less than the personnel capability of the team, about the same as product complexity (CPLX), and higher than other COCOMO cost drivers. • Process Maturity should be in all Software Cost • Estimation Models; it is well defined and measurable. • Some Observations on Effects of Process Maturity on Effort 20
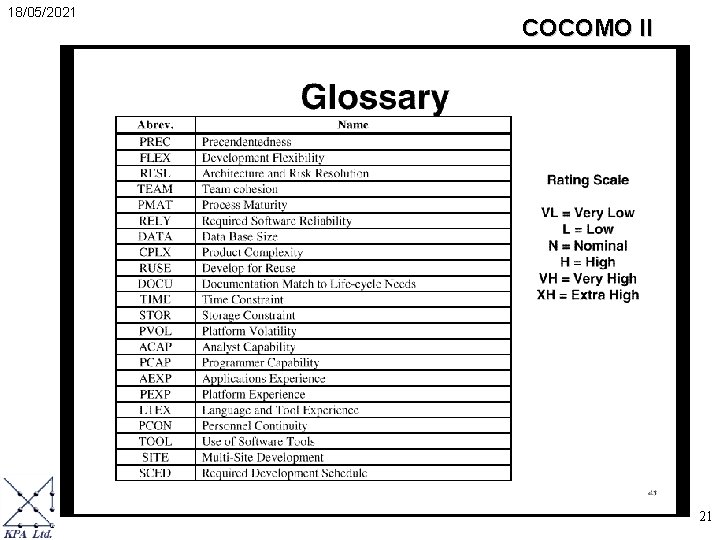
18/05/2021 COCOMO II 21
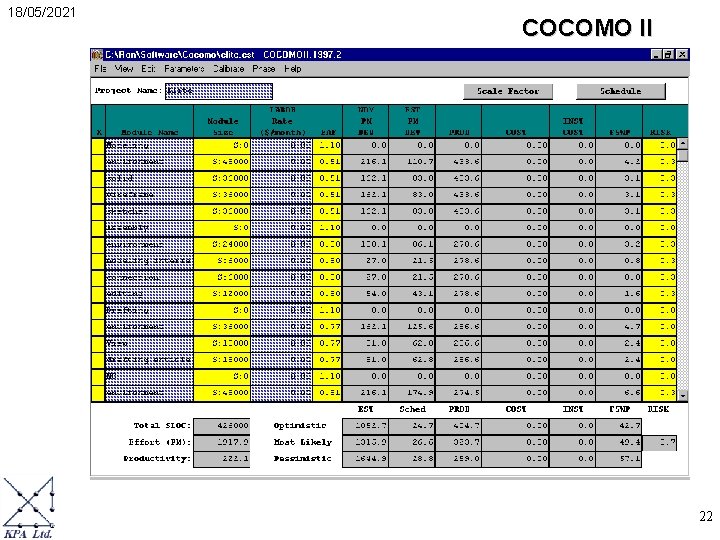
18/05/2021 COCOMO II 22
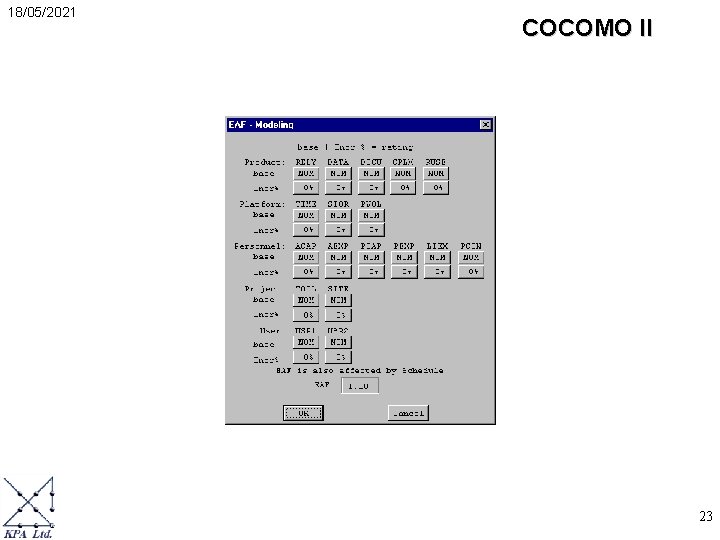
18/05/2021 COCOMO II 23