13 6 Pyramid Models SPONGE Please create 3
- Slides: 13
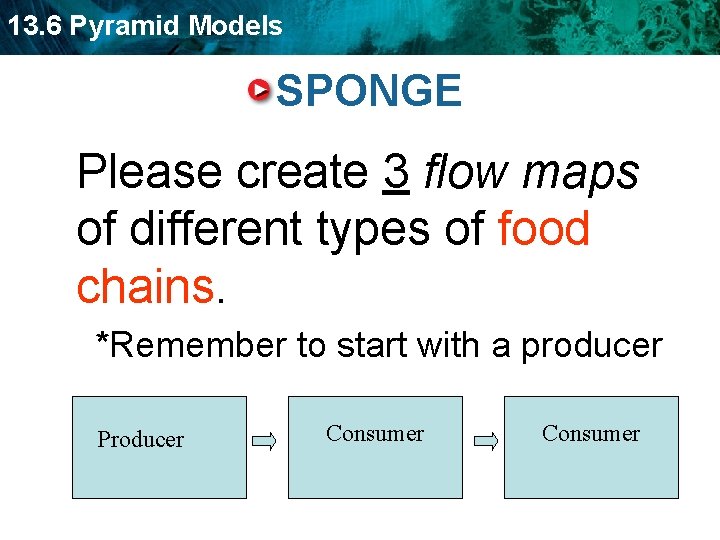
13. 6 Pyramid Models SPONGE Please create 3 flow maps of different types of food chains. *Remember to start with a producer Producer Consumer
13. 6 Pyramid Models Objective Students will learn how to trace the flow of energy through an ecosystem, using an energy pyramid AND how to relate energy pyramids to food chains and trophic levels.
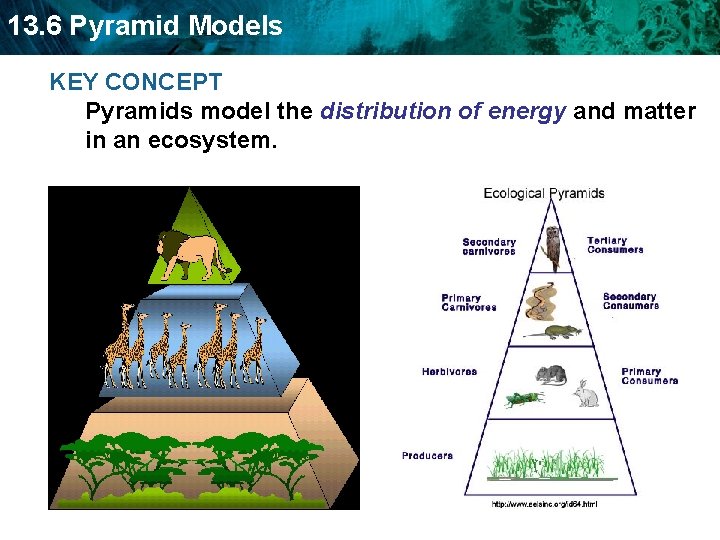
13. 6 Pyramid Models KEY CONCEPT Pyramids model the distribution of energy and matter in an ecosystem.
13. 6 Pyramid Models • Ecosystems get their energy from sunlight Sunlight provides the energy for photosynthesis, and that energy flows up the food chain. However…along the way energy is LOST
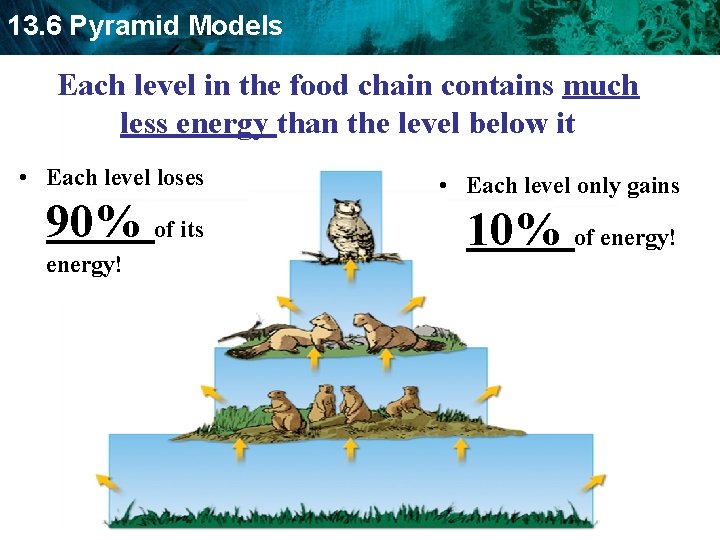
13. 6 Pyramid Models Each level in the food chain contains much less energy than the level below it • Each level loses 90% of its energy! • Each level only gains 10% of energy!
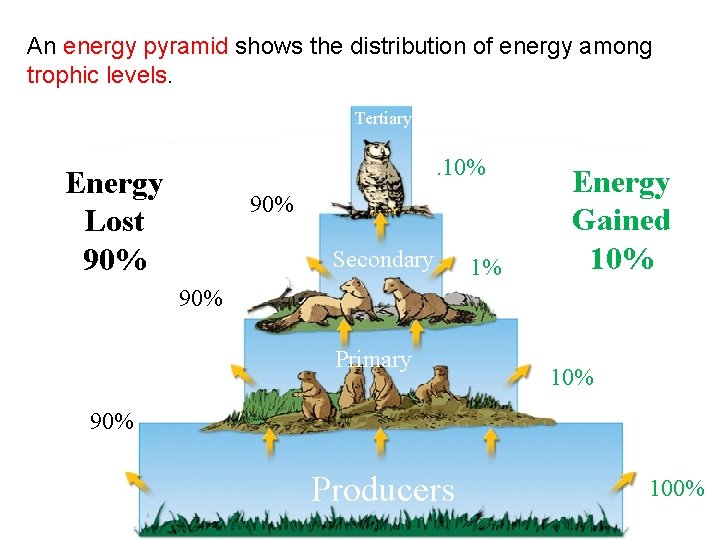
13. 6 Pyramid Models An energy pyramid shows the distribution of energy among trophic levels. Tertiary . 10% Energy Lost 90% Secondary 1% Energy Gained 10% 90% Primary 10% 90% Producers 100%
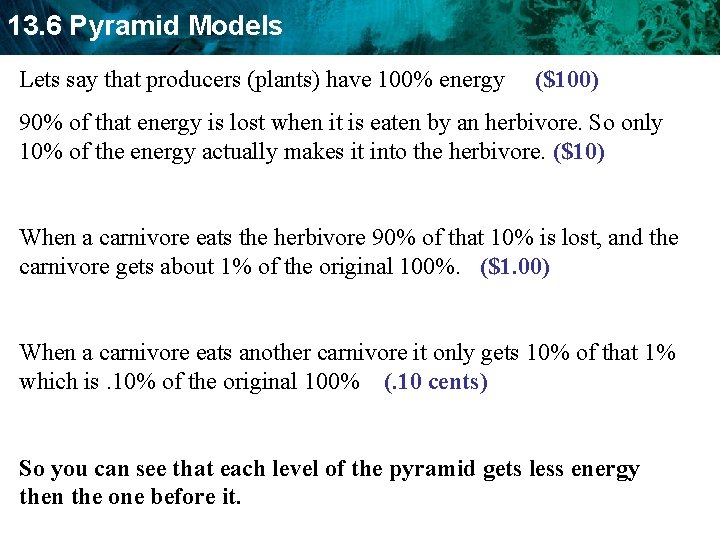
13. 6 Pyramid Models Lets say that producers (plants) have 100% energy ($100) 90% of that energy is lost when it is eaten by an herbivore. So only 10% of the energy actually makes it into the herbivore. ($10) When a carnivore eats the herbivore 90% of that 10% is lost, and the carnivore gets about 1% of the original 100%. ($1. 00) When a carnivore eats another carnivore it only gets 10% of that 1% which is. 10% of the original 100% (. 10 cents) So you can see that each level of the pyramid gets less energy then the one before it.
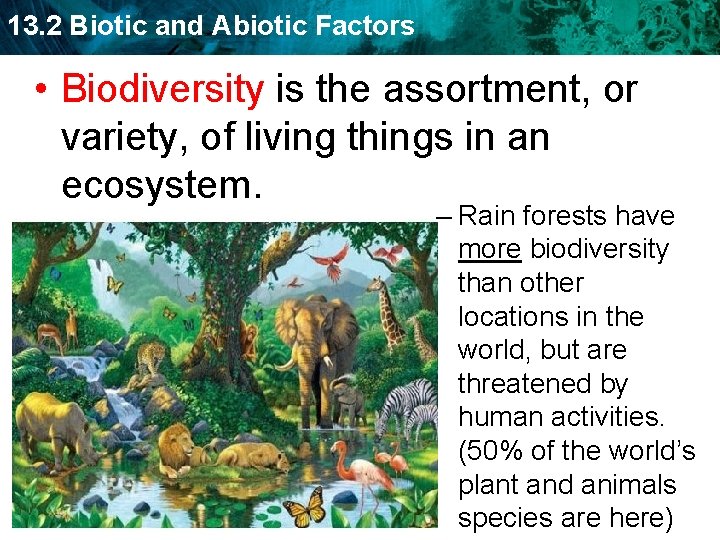
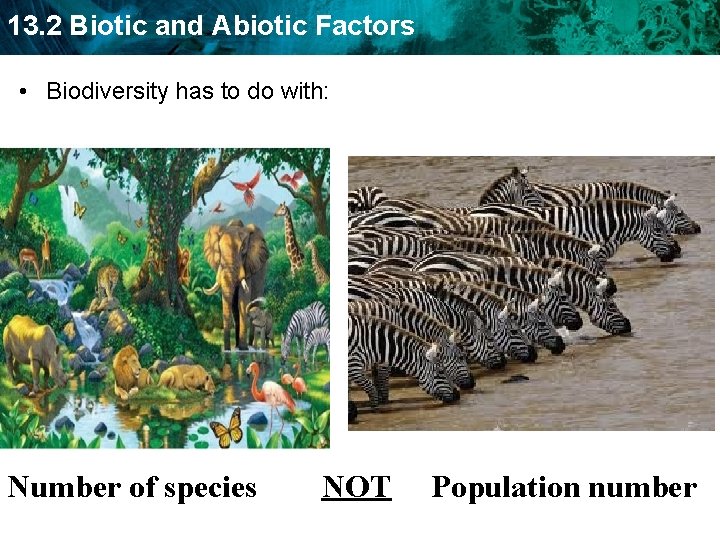
13. 2 Biotic and Abiotic Factors • Biodiversity is the assortment, or variety, of living things in an ecosystem. – Rain forests have more biodiversity than other locations in the world, but are threatened by human activities. (50% of the world’s plant and animals species are here)
13. 2 Biotic and Abiotic Factors • Biodiversity has to do with: Number of species NOT Population number
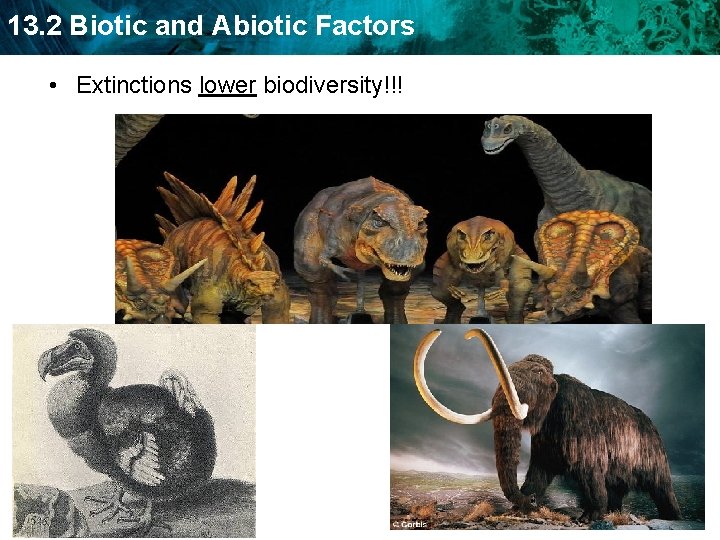
13. 2 Biotic and Abiotic Factors • Extinctions lower biodiversity!!!
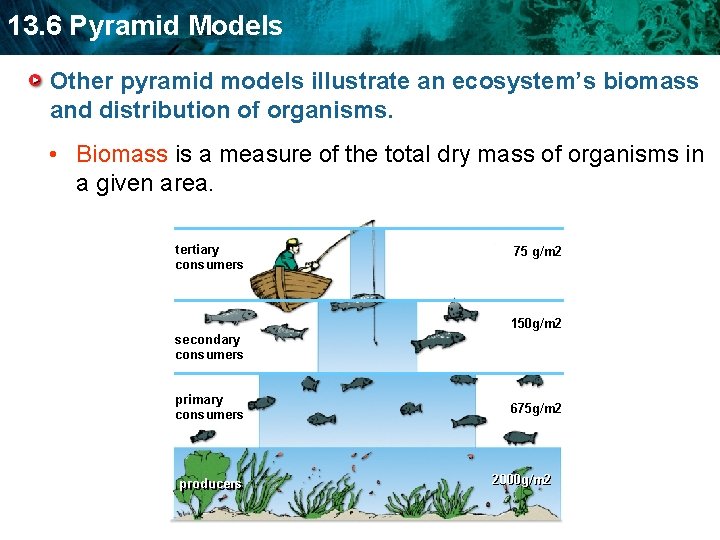
13. 6 Pyramid Models Other pyramid models illustrate an ecosystem’s biomass and distribution of organisms. • Biomass is a measure of the total dry mass of organisms in a given area. tertiary consumers 75 g/m 2 150 g/m 2 secondary consumers primary consumers producers 675 g/m 2 2000 g/m 2
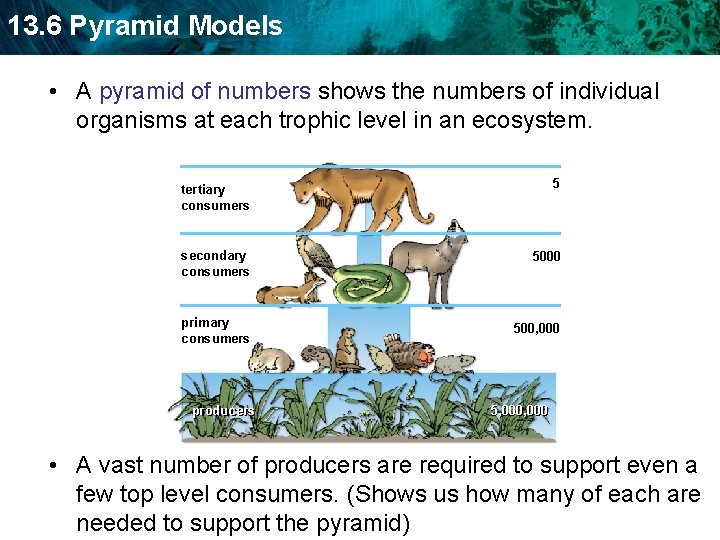
13. 6 Pyramid Models • A pyramid of numbers shows the numbers of individual organisms at each trophic level in an ecosystem. tertiary consumers 5 secondary consumers 5000 primary consumers 500, 000 producers 5, 000 • A vast number of producers are required to support even a few top level consumers. (Shows us how many of each are needed to support the pyramid)
13. 6 Pyramid Models Summary You should know that an energy pyramid shows the distribution of energy among trophic levels Other pyramid models illustrate an ecosystem’s biomass and distribution of organisms