Year 8 Scatter Diagrams Dr J Frost jfrosttiffin
- Slides: 11
Year 8 Scatter Diagrams Dr J Frost (jfrost@tiffin. kingston. sch. uk) Objectives: Understand the purpose of a scatter diagram, spotting correlation in data, and how to draw a line of best fit. Last modified: 24 th November 2013
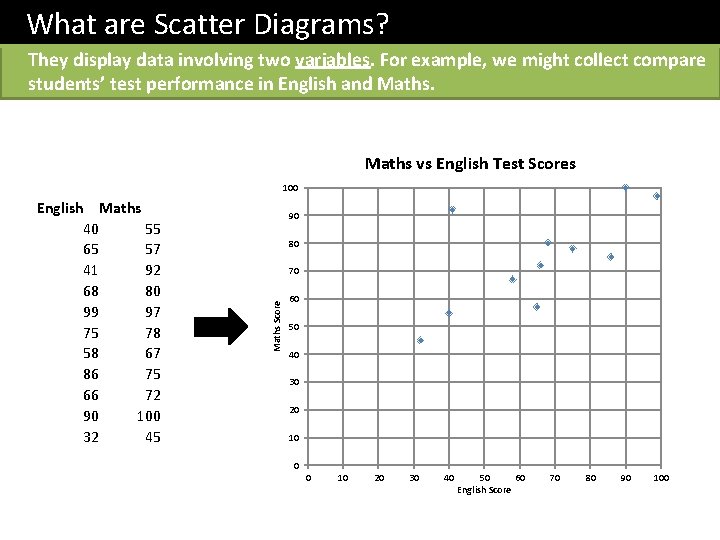
What are Scatter Diagrams? They display data involving two variables. For example, we might collect compare students’ test performance in English and Maths vs English Test Scores 100 90 80 70 Maths Score English Maths 40 55 65 57 41 92 68 80 99 97 75 78 58 67 86 75 66 72 90 100 32 45 60 50 40 30 20 10 0 0 10 20 30 40 50 60 English Score 70 80 90 100
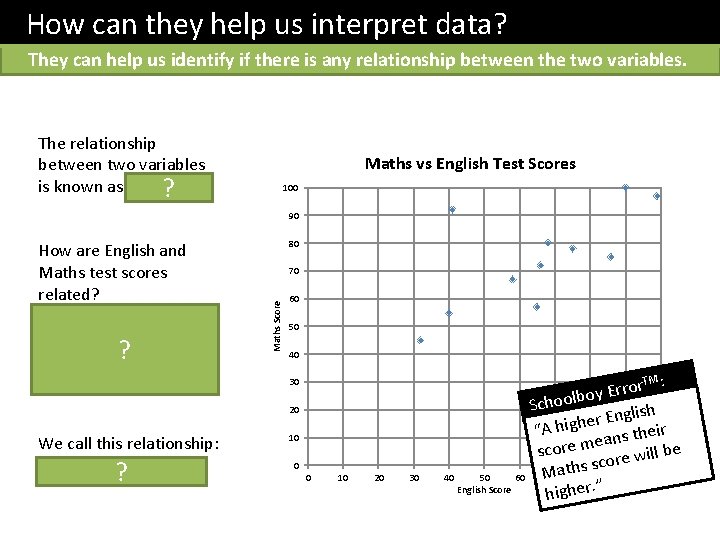
How can they help us interpret data? They can help us identify if there is any relationship between the two variables. The relationship between two variables is known as correlation. ? Maths vs English Test Scores 100 90 80 70 Maths Score How are English and Maths test scores related? If someone’s English test score is higher, their Maths? score tends to be higher. 60 50 40 30 20 We call this relationship: Positive correlation ? 10 0 0 10 20 30 TM : r o r r oy E Schoolb lish g n E r e “A high ns their ea score m re will be s sco h t a M 40 50 60 70 80 90 100 ”. r English Score e h hig
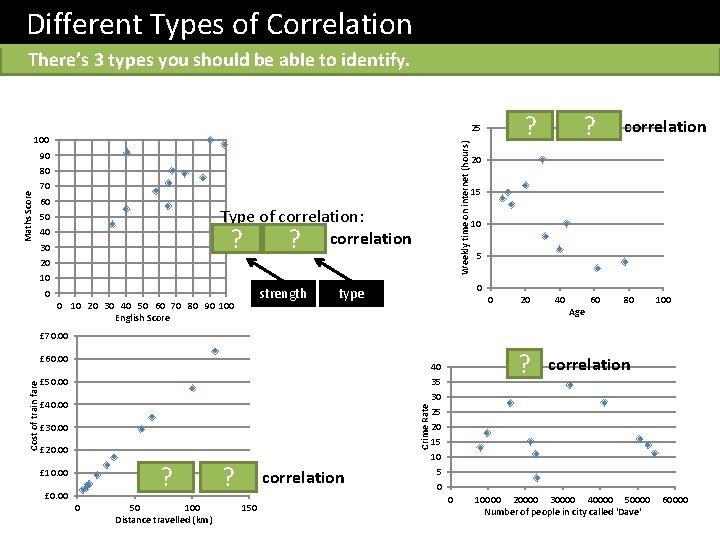
Different Types of Correlation There’s 3 types you should be able to identify. Weekly time on internet (hours) 90 80 Maths Score Weak ? negative ? correlation 25 100 70 60 Type of correlation: Weak ? positive ? correlation 50 40 30 20 10 strength 0 0 10 20 30 40 50 60 70 80 90 100 English Score 20 15 10 5 0 type 0 20 40 Age 60 80 100 £ 70. 00 £ 50. 00 £ 40. 00 Crime Rate Cost of train fare £ 60. 00 £ 30. 00 £ 20. 00 Strong ? positive ? correlation £ 10. 00 £ 0. 00 0 50 100 Distance travelled (km) 150 No ? correlation 40 35 30 25 20 15 10 5 0 0 10000 20000 30000 40000 50000 Number of people in city called 'Dave' 60000
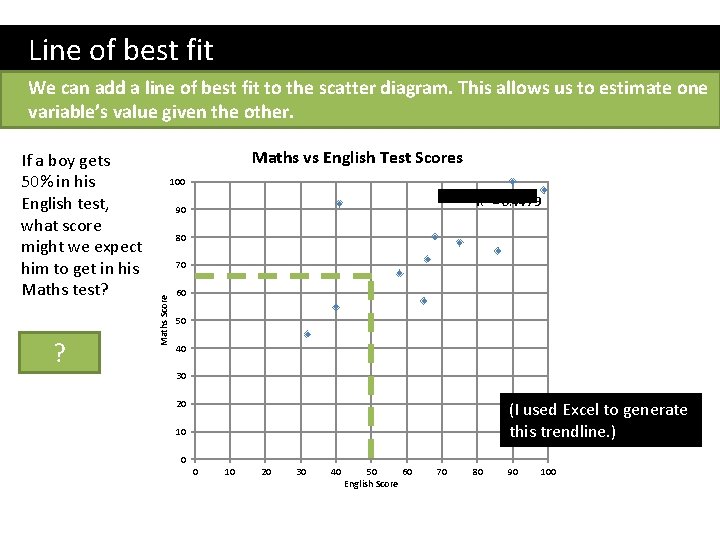
Line of best fit We can add a line of best fit to the scatter diagram. This allows us to estimate one variable’s value given the other. ? 65% Maths vs English Test Scores 100 R 2 = 0. 4479 90 80 70 Maths Score If a boy gets 50% in his English test, what score might we expect him to get in his Maths test? 60 50 40 30 20 (I used Excel to generate this trendline. ) 10 0 0 10 20 30 40 50 60 English Score 70 80 90 100
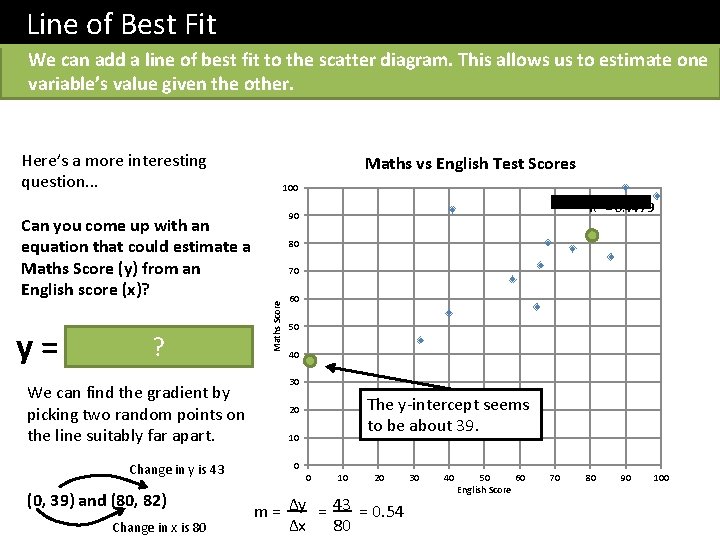
Line of Best Fit We can add a line of best fit to the scatter diagram. This allows us to estimate one variable’s value given the other. Here’s a more interesting question. . . Maths vs English Test Scores 100 Can you come up with an equation that could estimate a Maths Score (y) from an English score (x)? We can find the gradient by picking two random points on the line suitably far apart. Change in y is 43 (0, 39) and (80, 82) Change in x is 80 80 70 Maths Score y = 0. 55 x ? + 38. 5 R 2 = 0. 4479 90 60 50 40 30 The y-intercept seems to be about 39. 20 10 0 0 10 20 m = Δy = 43 = 0. 54 Δx 80 30 40 50 60 English Score 70 80 90 100
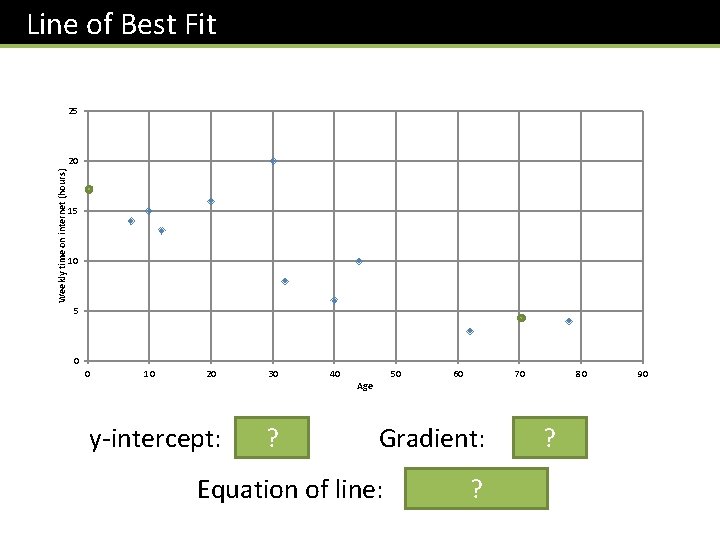
Line of Best Fit 25 Weekly time on internet (hours) 20 15 10 5 0 0 10 20 y-intercept: 30 ? 17 40 50 Age 60 Gradient: Equation of line: 70 ? -0. 18 ? + 17 -0. 18 x 80 90
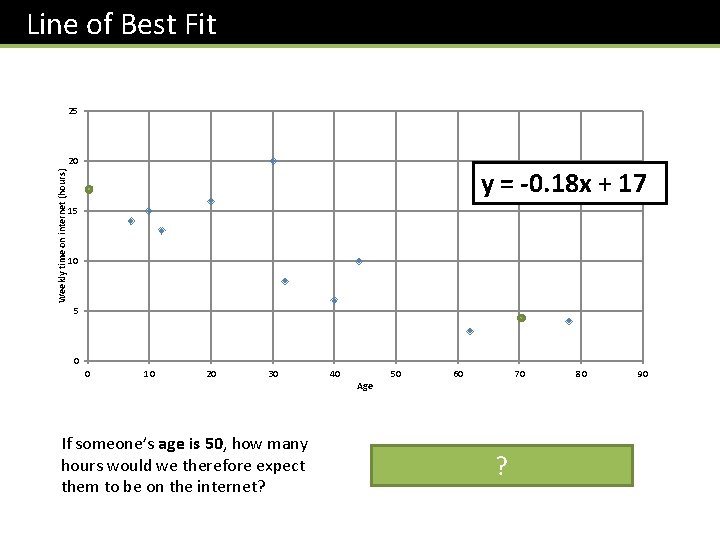
Line of Best Fit 25 Weekly time on internet (hours) 20 y = -0. 18 x + 17 15 10 5 0 0 10 20 30 If someone’s age is 50, how many hours would we therefore expect them to be on the internet? 40 Age 50 60 70 80 (-0. 18 x 50) ? + 17 = 8 90
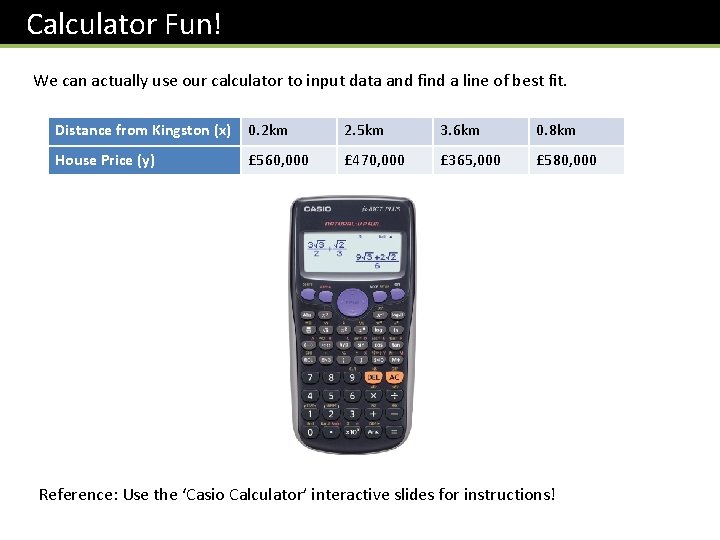
Calculator Fun! We can actually use our calculator to input data and find a line of best fit. Distance from Kingston (x) 0. 2 km 2. 5 km 3. 6 km 0. 8 km House Price (y) £ 560, 000 £ 470, 000 £ 365, 000 £ 580, 000 Reference: Use the ‘Casio Calculator’ interactive slides for instructions!
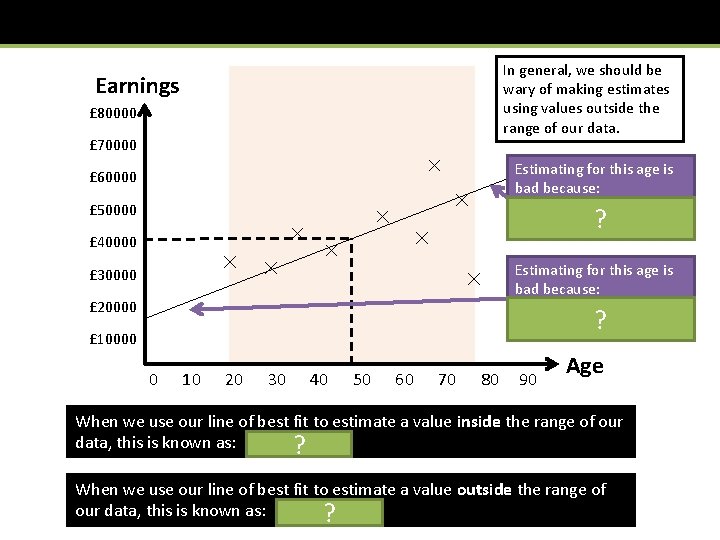
In general, we should be wary of making estimates using values outside the range of our data. Earnings £ 80000 £ 70000 Estimating for this age is bad because: The person may have retired. £ 60000 £ 50000 ? £ 40000 Estimating for this age is bad because: Children don’t have fulltime jobs. £ 30000 £ 20000 ? £ 10000 0 10 20 30 40 50 60 70 80 90 Age When we use our line of best fit to estimate a value inside the range of our data, this is known as: interpolation ? When we use our line of best fit to estimate a value outside the range of our data, this is known as: extrapolation ?
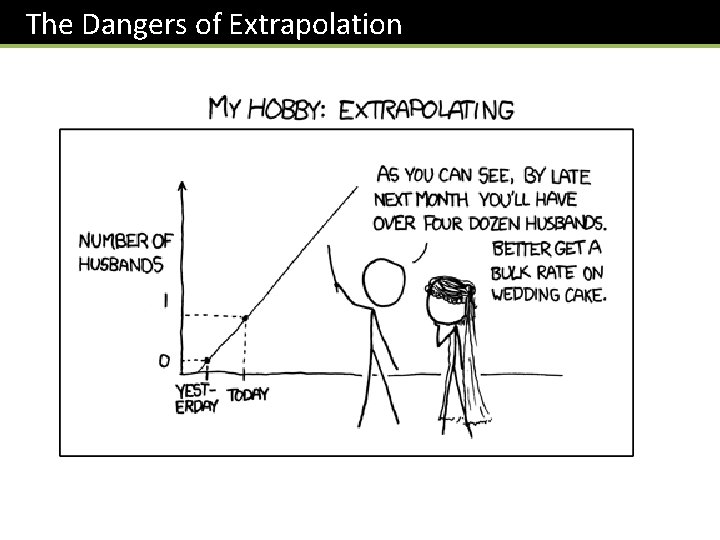
The Dangers of Extrapolation