4 1 Coordinates and Scatter Plots Objective 1

4. 1 Coordinates and Scatter Plots • Objective 1 – Plot points in a coordinate plane • Objective 2 – Draw a scatter plot and make predictions about real life situations

• A coordinate plane is formed by two real number lines that intersect at a right angle • Each point in the plane corresponds to an ordered pair of real numbers (x, y) y • The first number in an ordered pair is the x – coordinate vertical or y axis • The second number in an ordered pair is the y – coordinate • The ordered pair (3, -2) has an x – coordinate of 3 and a y – coordinate of -2 horizontal or x axis x O origin (0, 0) (3, -2)
 Quadrant II Quadrant I (-, +) (+, +) (0, -2) Quadrant III")
(5, 4) Quadrant II Quadrant I (-, +) (+, +) (0, -2) Quadrant III Quadrant IV (-, -) (+, -)
")
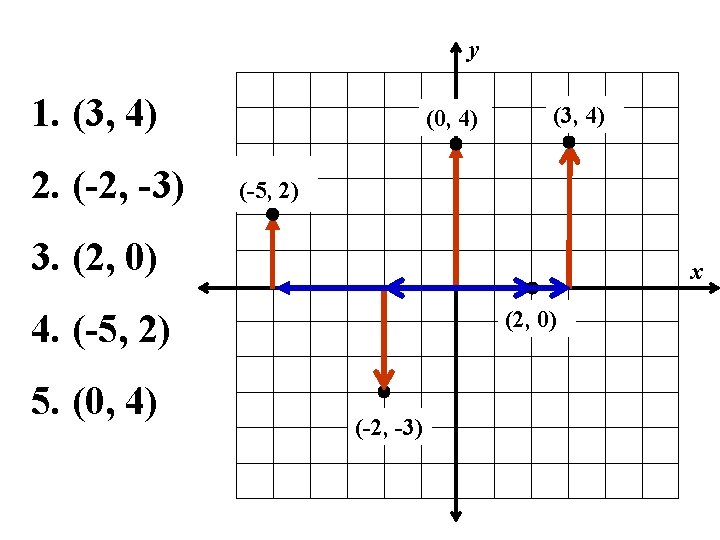
EXAMPLES Plotting Points in a coordinate Plane 1. 2. 3. 4. 5. (3, 4) (-2, -3) (2, 0) (-5, 2) (0, 4)

Winter Sports Equipment Year 1990 1991 1992 1993 1994 1995 1996 Snowboards 322 362 391 515 715 924 970 Skis 606 577 627 611 652 607 644 a) Draw a scatter plot for each set of data in the same coordinate plane b) Describe the pattern of the amount spent on Snowboards c) Describe the pattern of the amount spent on Skis
 Scatter plot Snowboards Skis b) c) Amount spent on Snowboards has been increasing")
a) Scatter plot Snowboards Skis b) c) Amount spent on Snowboards has been increasing Amount spent on Skis has been mostly constant

A C B A. Positive Correlation B. Negative Correlation C. No Correlation
- Slides: 8