www dcjs virginia gov Health Criminal Justice Data

- Slides: 20
www. dcjs. virginia. gov Health & Criminal Justice Data Committee Report to the Governor’s Task Force on Prescription Drug and Heroin Abuse Includes preliminary 2015 data May 4, 2016 Presenting data from the Department of Forensic Science, and the Office of the Chief Medical Examiner and Office of Family Health Services at the Virginia Department of Health
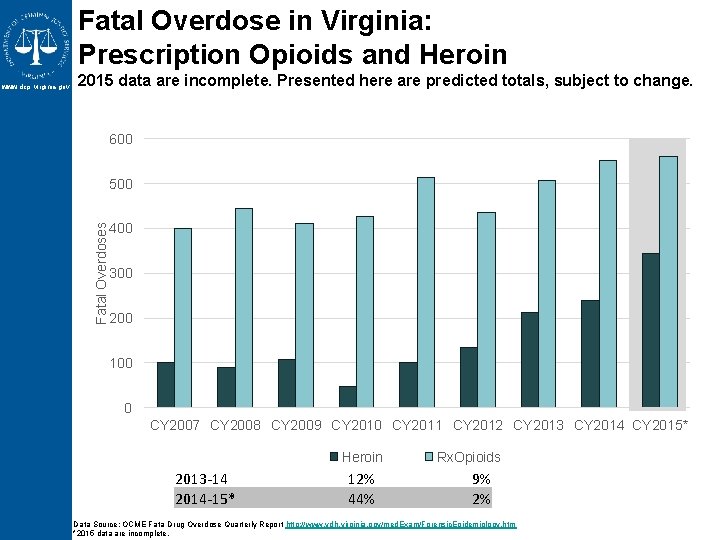
Fatal Overdose in Virginia: Prescription Opioids and Heroin 2015 data are incomplete. Presented here are predicted totals, subject to change. 600 500 Fatal Overdoses www. dcjs. virginia. gov 400 300 200 100 0 CY 2007 CY 2008 CY 2009 CY 2010 CY 2011 CY 2012 CY 2013 CY 2014 CY 2015* Heroin 2013 -14 2014 -15* 12% 44% Rx. Opioids 9% 2% Data Source: OCME Fata Drug Overdose Quarterly Report http: //www. vdh. virginia. gov/med. Exam/Forensic. Epidemiology. htm *2015 data are incomplete.
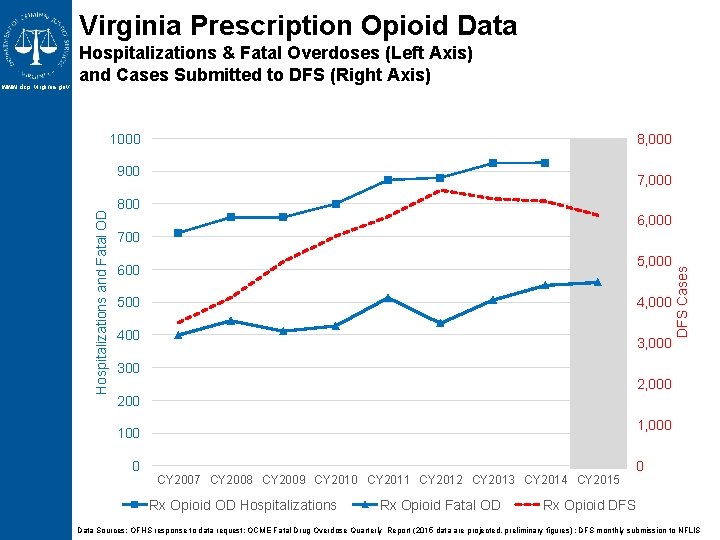
Virginia Prescription Opioid Data 1000 8, 000 900 7, 000 800 6, 000 700 5, 000 600 500 4, 000 400 3, 000 DFS Cases Hospitalizations and Fatal OD www. dcjs. virginia. gov Hospitalizations & Fatal Overdoses (Left Axis) and Cases Submitted to DFS (Right Axis) 300 2, 000 200 1, 000 100 0 CY 2007 CY 2008 CY 2009 CY 2010 CY 2011 CY 2012 CY 2013 CY 2014 CY 2015 Rx Opioid OD Hospitalizations Rx Opioid Fatal OD 0 Rx Opioid DFS Data Sources: OFHS response to data request; OCME Fatal Drug Overdose Quarterly Report (2015 data are projected, preliminary figures) ; DFS monthly submission to NFLIS
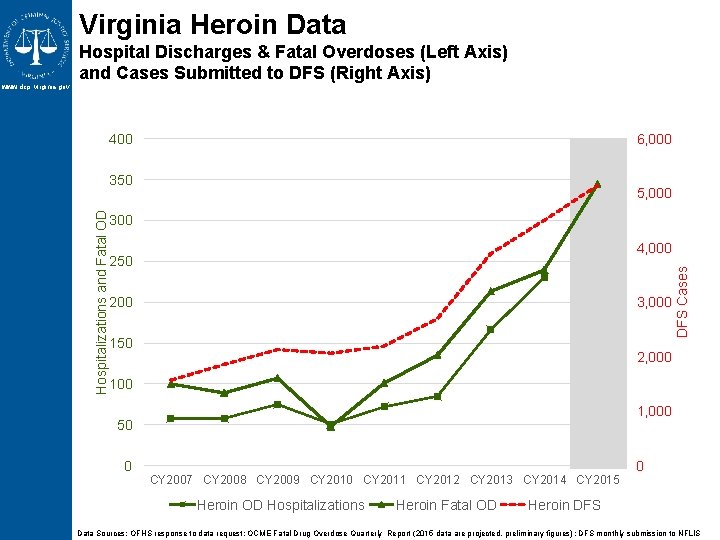
Virginia Heroin Data 400 6, 000 350 5, 000 300 4, 000 250 200 3, 000 150 DFS Cases Hospitalizations and Fatal OD www. dcjs. virginia. gov Hospital Discharges & Fatal Overdoses (Left Axis) and Cases Submitted to DFS (Right Axis) 2, 000 1, 000 50 0 CY 2007 CY 2008 CY 2009 CY 2010 CY 2011 CY 2012 CY 2013 CY 2014 CY 2015 Heroin OD Hospitalizations Heroin Fatal OD 0 Heroin DFS Data Sources: OFHS response to data request; OCME Fatal Drug Overdose Quarterly Report (2015 data are projected, preliminary figures); DFS monthly submission to NFLIS
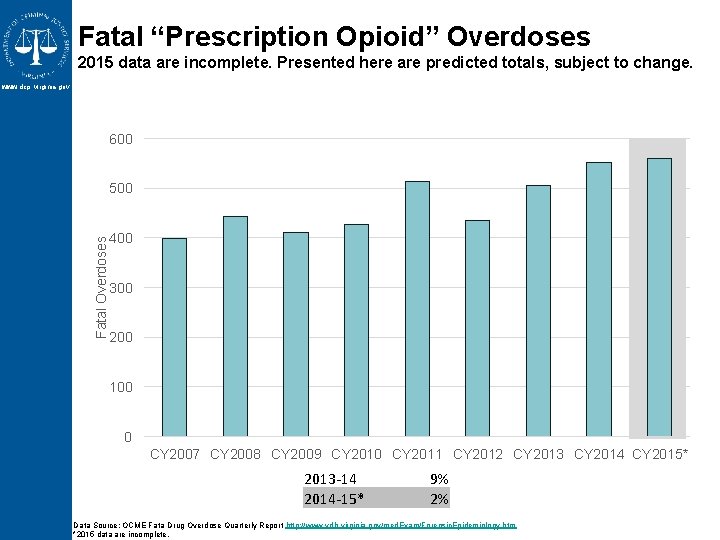
Fatal “Prescription Opioid” Overdoses 2015 data are incomplete. Presented here are predicted totals, subject to change. www. dcjs. virginia. gov 600 Fatal Overdoses 500 400 300 200 100 0 CY 2007 CY 2008 CY 2009 CY 2010 CY 2011 CY 2012 CY 2013 CY 2014 CY 2015* 2013 -14 2014 -15* 9% 2% Data Source: OCME Fata Drug Overdose Quarterly Report http: //www. vdh. virginia. gov/med. Exam/Forensic. Epidemiology. htm *2015 data are incomplete.
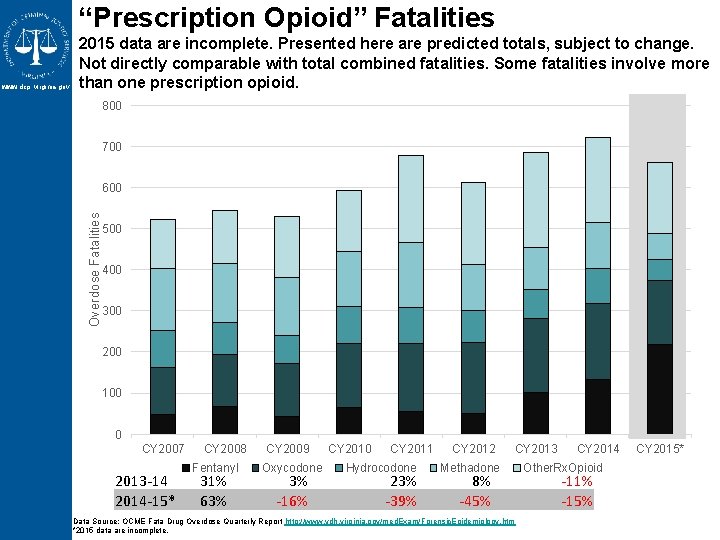
“Prescription Opioid” Fatalities 800 700 600 Overdose Fatalities www. dcjs. virginia. gov 2015 data are incomplete. Presented here are predicted totals, subject to change. Not directly comparable with total combined fatalities. Some fatalities involve more than one prescription opioid. 500 400 300 200 100 0 CY 2007 2013 -14 2014 -15* CY 2008 Fentanyl 31% 63% CY 2009 Oxycodone 3% -16% CY 2010 CY 2011 Hydrocodone 23% -39% CY 2012 CY 2013 Methadone 8% -45% Data Source: OCME Fata Drug Overdose Quarterly Report http: //www. vdh. virginia. gov/med. Exam/Forensic. Epidemiology. htm *2015 data are incomplete. CY 2014 Other. Rx. Opioid -11% -15% CY 2015*
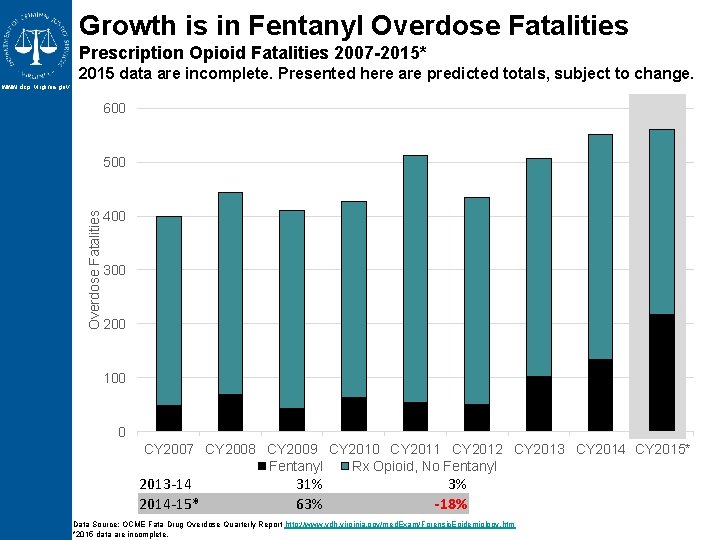
Growth is in Fentanyl Overdose Fatalities Prescription Opioid Fatalities 2007 -2015* 2015 data are incomplete. Presented here are predicted totals, subject to change. www. dcjs. virginia. gov 600 Overdose Fatalities 500 400 300 200 100 0 CY 2007 CY 2008 CY 2009 CY 2010 CY 2011 CY 2012 CY 2013 CY 2014 CY 2015* Fentanyl Rx Opioid, No Fentanyl 2013 -14 2014 -15* 31% 63% 3% -18% Data Source: OCME Fata Drug Overdose Quarterly Report http: //www. vdh. virginia. gov/med. Exam/Forensic. Epidemiology. htm *2015 data are incomplete.
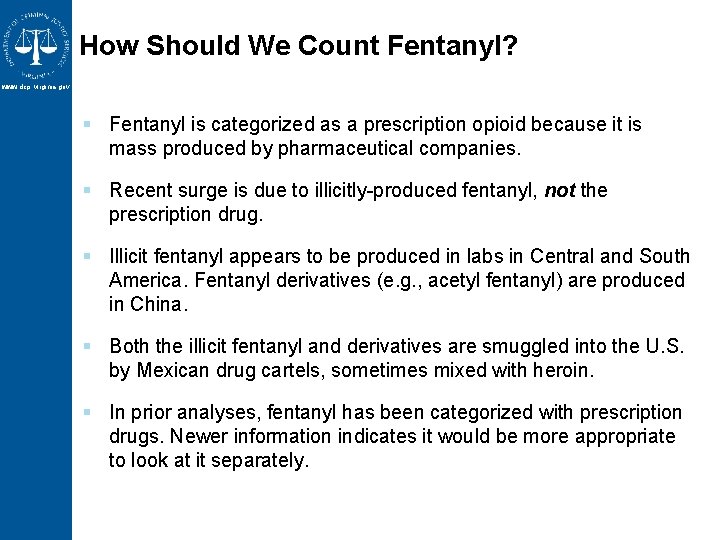
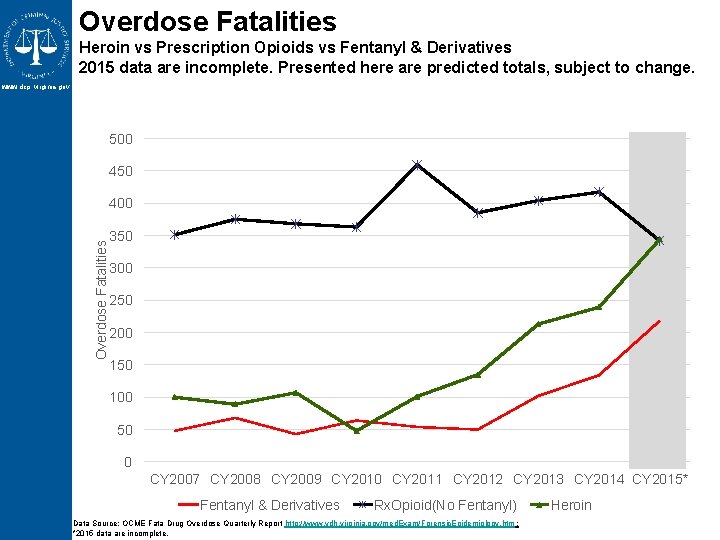
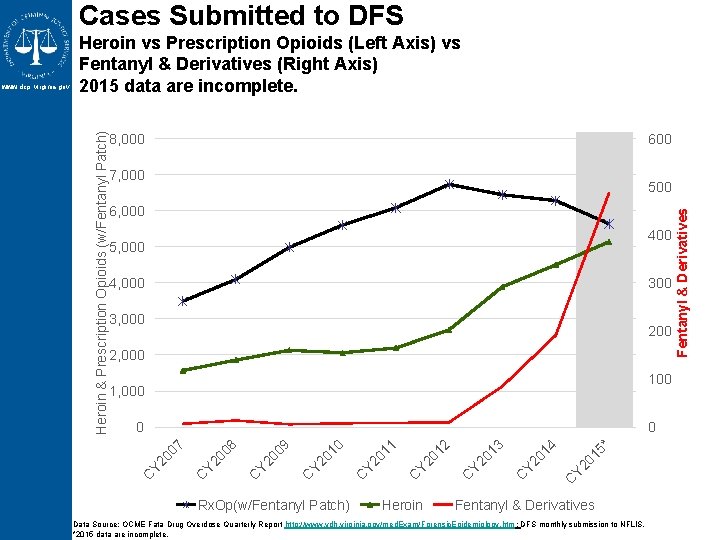
How Should We Count Fentanyl? www. dcjs. virginia. gov § Fentanyl is categorized as a prescription opioid because it is mass produced by pharmaceutical companies. § Recent surge is due to illicitly-produced fentanyl, not the prescription drug. § Illicit fentanyl appears to be produced in labs in Central and South America. Fentanyl derivatives (e. g. , acetyl fentanyl) are produced in China. § Both the illicit fentanyl and derivatives are smuggled into the U. S. by Mexican drug cartels, sometimes mixed with heroin. § In prior analyses, fentanyl has been categorized with prescription drugs. Newer information indicates it would be more appropriate to look at it separately.
Overdose Fatalities Heroin vs Prescription Opioids vs Fentanyl & Derivatives 2015 data are incomplete. Presented here are predicted totals, subject to change. www. dcjs. virginia. gov 500 450 Overdose Fatalities 400 350 300 250 200 150 100 50 0 CY 2007 CY 2008 CY 2009 CY 2010 CY 2011 CY 2012 CY 2013 CY 2014 CY 2015* Fentanyl & Derivatives Rx. Opioid(No Fentanyl) Data Source: OCME Fata Drug Overdose Quarterly Report http: //www. vdh. virginia. gov/med. Exam/Forensic. Epidemiology. htm ; *2015 data are incomplete. Heroin
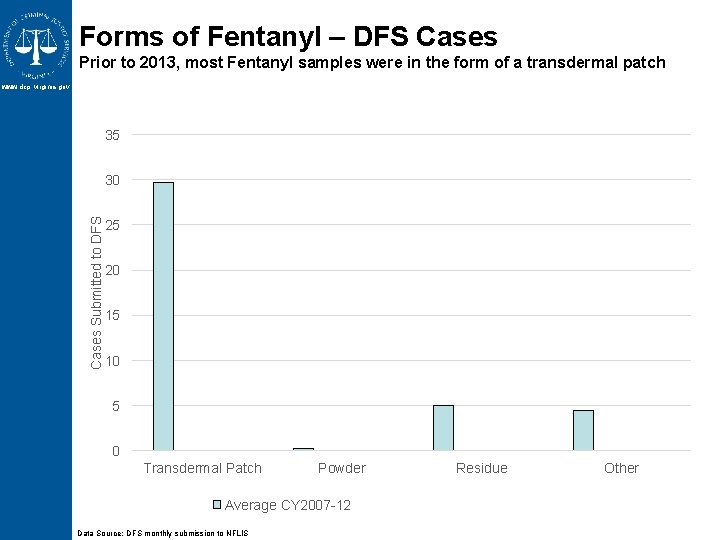
Forms of Fentanyl – DFS Cases Prior to 2013, most Fentanyl samples were in the form of a transdermal patch www. dcjs. virginia. gov 35 Cases Submitted to DFS 30 25 20 15 10 5 0 Transdermal Patch Powder Average CY 2007 -12 Data Source: DFS monthly submission to NFLIS Residue CY 2013 CY 2014 Other CY 2015
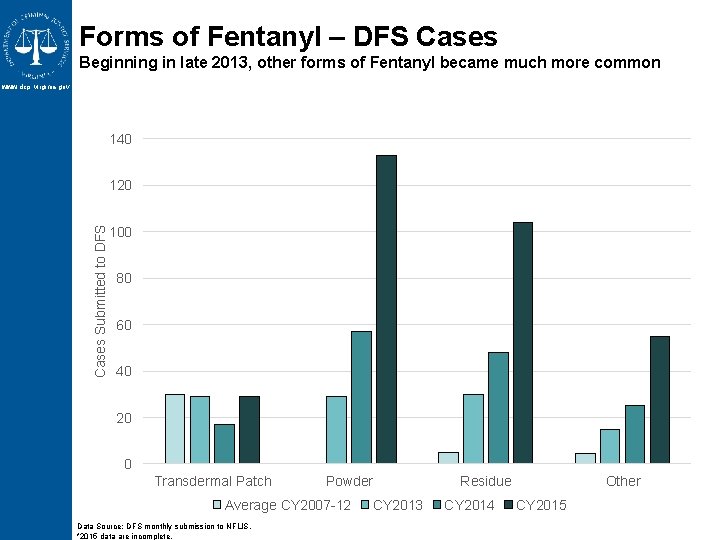
Forms of Fentanyl – DFS Cases Beginning in late 2013, other forms of Fentanyl became much more common www. dcjs. virginia. gov 140 Cases Submitted to DFS 120 100 80 60 40 20 0 Transdermal Patch Powder Average CY 2007 -12 Data Source: DFS monthly submission to NFLIS. *2015 data are incomplete. CY 2013 Residue CY 2014 Other CY 2015
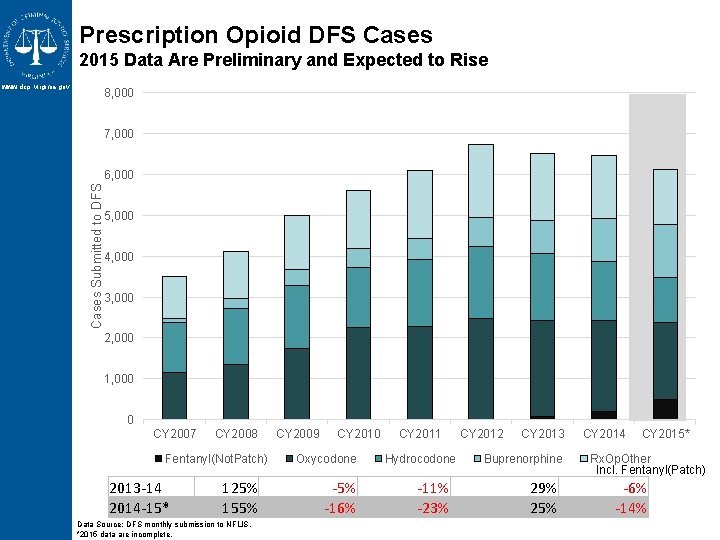
Prescription Opioid DFS Cases 2015 Data Are Preliminary and Expected to Rise www. dcjs. virginia. gov 8, 000 7, 000 Cases Submitted to DFS 6, 000 5, 000 4, 000 3, 000 2, 000 1, 000 0 CY 2007 CY 2008 Fentanyl(Not. Patch) 2013 -14 2014 -15* 125% 155% Data Source: DFS monthly submission to NFLIS. *2015 data are incomplete. CY 2009 CY 2010 Oxycodone -5% -16% CY 2011 Hydrocodone -11% -23% CY 2012 CY 2013 Buprenorphine 29% 25% CY 2014 CY 2015* Rx. Op. Other Incl. Fentanyl(Patch) -6% -14%
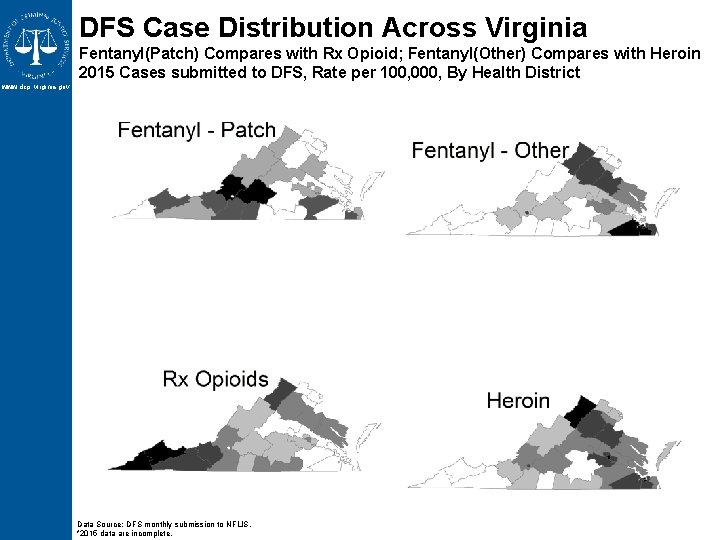
DFS Case Distribution Across Virginia Fentanyl(Patch) Compares with Rx Opioid; Fentanyl(Other) Compares with Heroin 2015 Cases submitted to DFS, Rate per 100, 000, By Health District www. dcjs. virginia. gov Data Source: DFS monthly submission to NFLIS. *2015 data are incomplete.
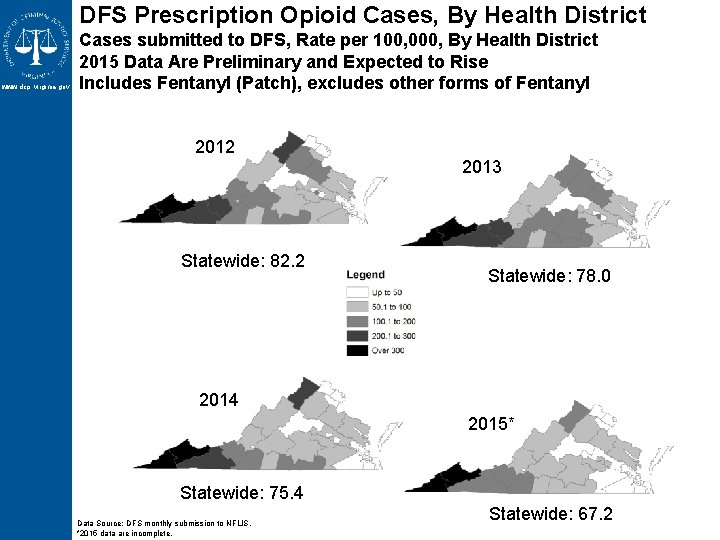
DFS Prescription Opioid Cases, By Health District www. dcjs. virginia. gov Cases submitted to DFS, Rate per 100, 000, By Health District 2015 Data Are Preliminary and Expected to Rise Includes Fentanyl (Patch), excludes other forms of Fentanyl 2012 Statewide: 82. 2 2013 Statewide: 78. 0 2014 2015* Statewide: 75. 4 Data Source: DFS monthly submission to NFLIS. *2015 data are incomplete. Statewide: 67. 2
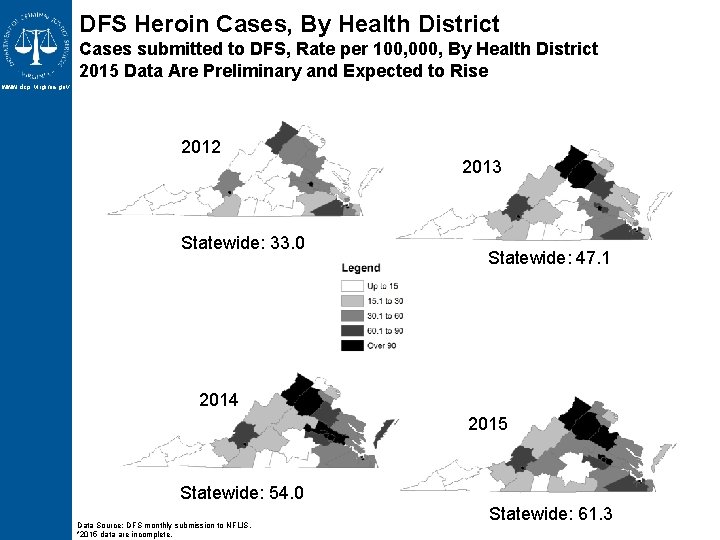
DFS Heroin Cases, By Health District Cases submitted to DFS, Rate per 100, 000, By Health District 2015 Data Are Preliminary and Expected to Rise www. dcjs. virginia. gov 2012 Statewide: 33. 0 2013 Statewide: 47. 1 2014 2015 Statewide: 54. 0 Data Source: DFS monthly submission to NFLIS. *2015 data are incomplete. Statewide: 61. 3
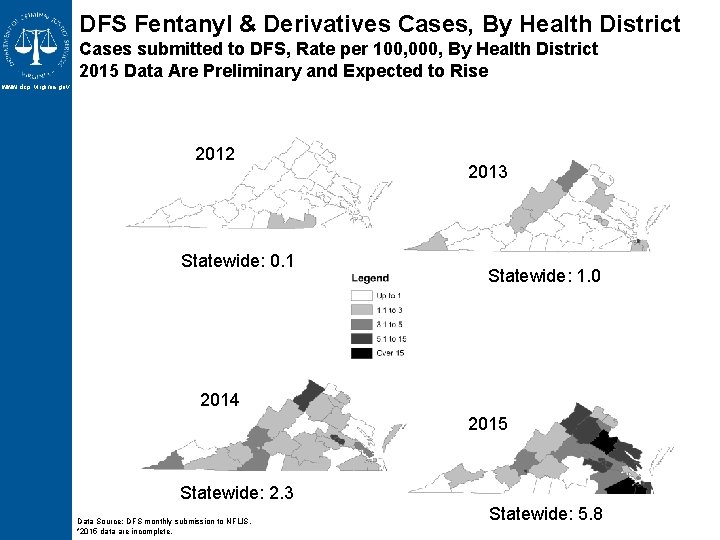
DFS Fentanyl & Derivatives Cases, By Health District Cases submitted to DFS, Rate per 100, 000, By Health District 2015 Data Are Preliminary and Expected to Rise www. dcjs. virginia. gov 2012 Statewide: 0. 1 2013 Statewide: 1. 0 2014 2015 Statewide: 2. 3 Data Source: DFS monthly submission to NFLIS. *2015 data are incomplete. Statewide: 5. 8
Cases Submitted to DFS 8, 000 600 7, 000 6, 000 400 5, 000 4, 000 3, 000 2, 000 1, 000 Rx. Op(w/Fentanyl Patch) Heroin * 01 5 Y 2 C C Y 2 01 4 01 3 Y 2 C 01 2 Y 2 C 01 1 Y 2 C 00 8 Y 2 C 01 0 0 00 9 0 Fentanyl & Derivatives Data Source: OCME Fata Drug Overdose Quarterly Report http: //www. vdh. virginia. gov/med. Exam/Forensic. Epidemiology. htm ; DFS monthly submission to NFLIS. *2015 data are incomplete. Fentanyl & Derivatives 500 00 7 Heroin & Prescription Opioids (w/Fentanyl Patch) www. dcjs. virginia. gov Heroin vs Prescription Opioids (Left Axis) vs Fentanyl & Derivatives (Right Axis) 2015 data are incomplete.
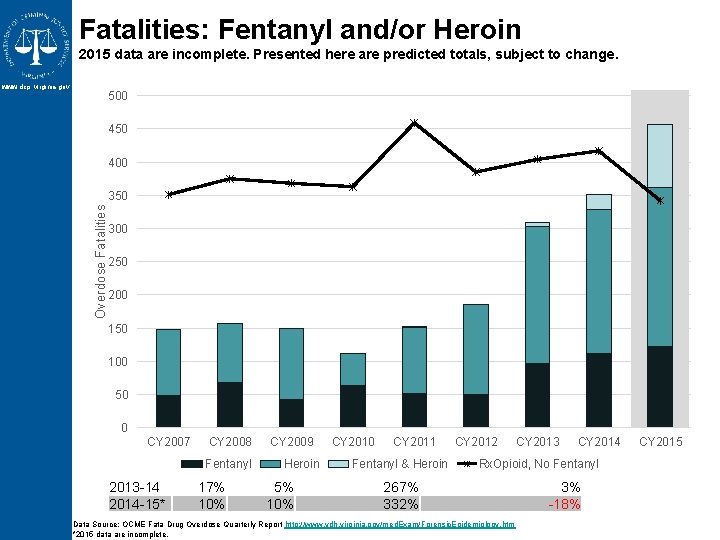
Fatalities: Fentanyl and/or Heroin 2015 data are incomplete. Presented here are predicted totals, subject to change. www. dcjs. virginia. gov 500 450 400 Overdose Fatalities 350 300 250 200 150 100 50 0 CY 2007 CY 2008 Fentanyl 2013 -14 2014 -15* 17% 10% CY 2009 Heroin 5% 10% CY 2010 CY 2011 Fentanyl & Heroin CY 2012 CY 2013 CY 2014 Rx. Opioid, No Fentanyl 267% 332% Data Source: OCME Fata Drug Overdose Quarterly Report http: //www. vdh. virginia. gov/med. Exam/Forensic. Epidemiology. htm *2015 data are incomplete. 3% -18% CY 2015
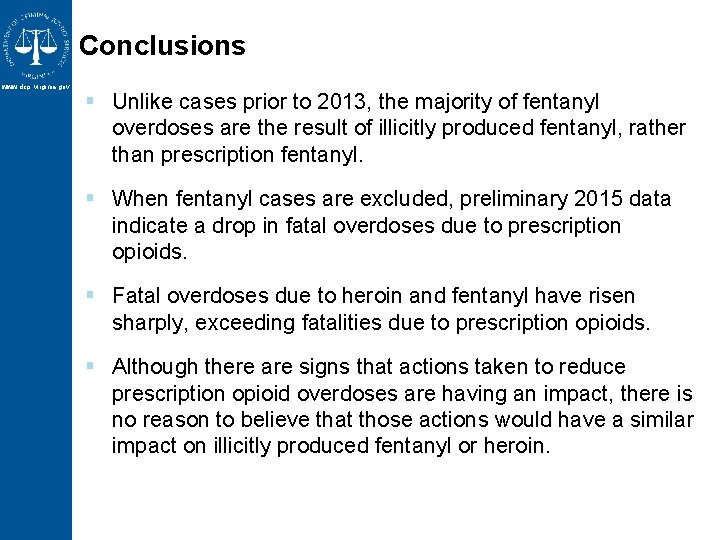
Conclusions www. dcjs. virginia. gov § Unlike cases prior to 2013, the majority of fentanyl overdoses are the result of illicitly produced fentanyl, rather than prescription fentanyl. § When fentanyl cases are excluded, preliminary 2015 data indicate a drop in fatal overdoses due to prescription opioids. § Fatal overdoses due to heroin and fentanyl have risen sharply, exceeding fatalities due to prescription opioids. § Although there are signs that actions taken to reduce prescription opioid overdoses are having an impact, there is no reason to believe that those actions would have a similar impact on illicitly produced fentanyl or heroin.
Acknowledgments www. dcjs. virginia. gov Special thanks to: – Rosie Hobron, OCME – John Przybylski, DFS – Anne Zehner, OFHS