Where and when should one hope to find

- Slides: 24
Where and when should one hope to find added value from dynamical downscaling of GCM data? René Laprise Director, Centre ESCER (Étude et Simulation du Climat à l’Échelle Régionale) Professor, UQAM (Université du Québec à Montréal) WCRP Regional Climate Workshop: Facilitating the production of climate information and its use in impact and adaptation work Lille (France), 14 -16 June 2010
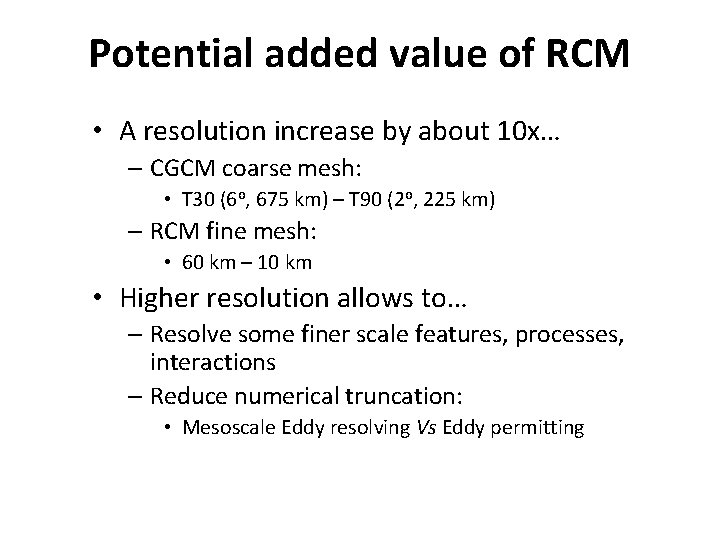
Potential added value of RCM • A resolution increase by about 10 x… – CGCM coarse mesh: • T 30 (6 o, 675 km) – T 90 (2 o, 225 km) – RCM fine mesh: • 60 km – 10 km • Higher resolution allows to… – Resolve some finer scale features, processes, interactions – Reduce numerical truncation: • Mesoscale Eddy resolving Vs Eddy permitting
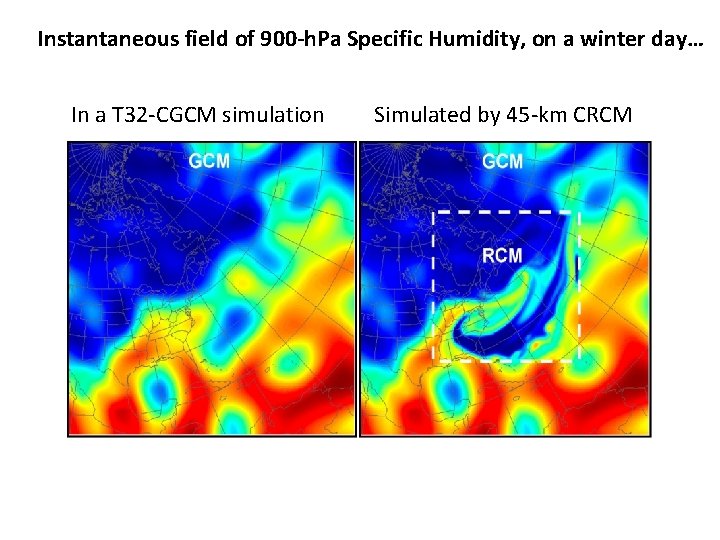
Instantaneous field of 900 -h. Pa Specific Humidity, on a winter day… In a T 32 -CGCM simulation Simulated by 45 -km CRCM
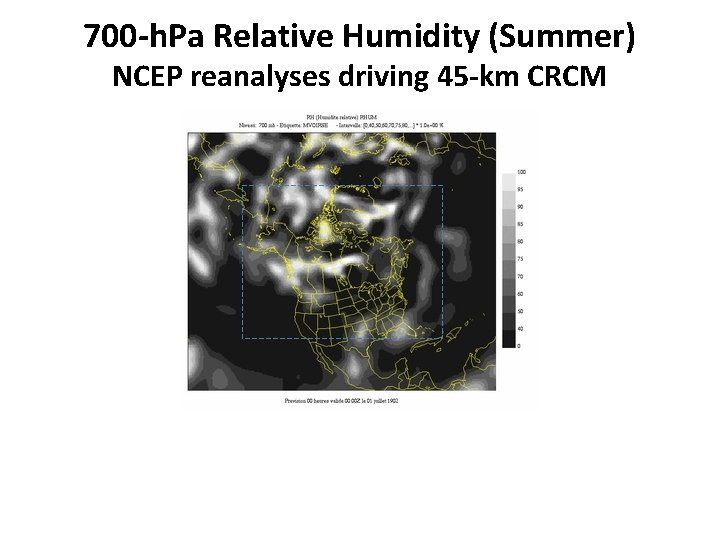
700 -h. Pa Relative Humidity (Summer) NCEP reanalyses driving 45 -km CRCM
– Clear to the naked eye in the time evolution of RCM-simulated fields – But what about climatological (timemean) fields?
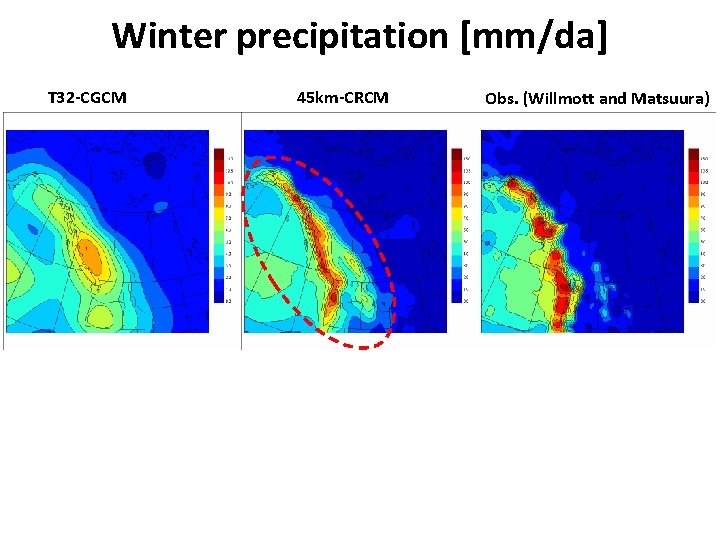
Winter precipitation [mm/da] T 32 -CGCM 45 km-CRCM Obs. (Willmott and Matsuura)
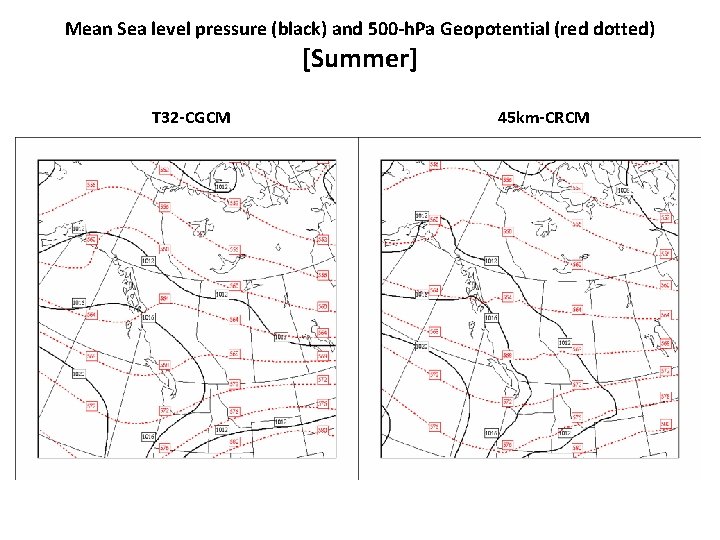
Mean Sea level pressure (black) and 500 -h. Pa Geopotential (red dotted) [Summer] T 32 -CGCM 45 km-CRCM
– Clear to the naked eye in the time evolution of RCM-simulated fields – But what about climatological (time-mean) fields? • Yes for fields strongly affected by local, stationary forcings, such as mountains, land-sea contrast, etc. • Usually not for other fields • But there are exceptions…
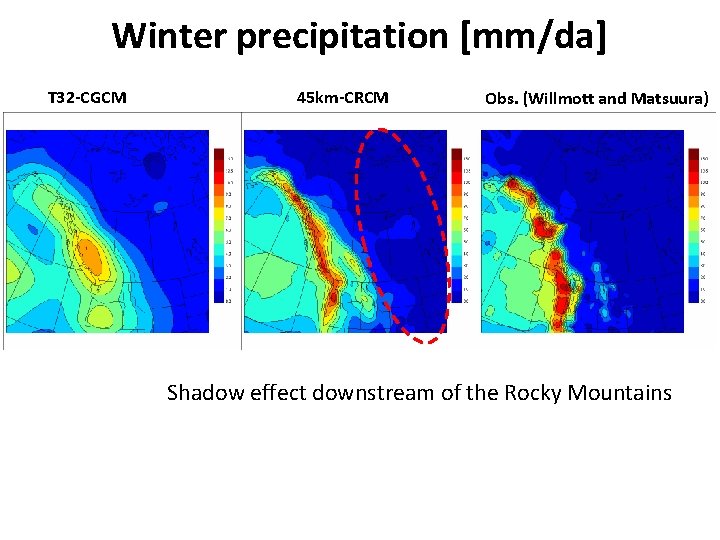
Winter precipitation [mm/da] T 32 -CGCM 45 km-CRCM Obs. (Willmott and Matsuura) Shadow effect downstream of the Rocky Mountains
– Clear to the naked eye in the time evolution of RCMsimulated fields – But what about climatological (time-mean) fields? • Yes for fields strongly affected by local, stationary forcings, such as mountains, land-sea contrast, etc. • Usually not for other fields • But on occasion there are detectable “large-scale” effects resulting from “fine-scale” forcing: A sort of indirect effect of reduced truncation
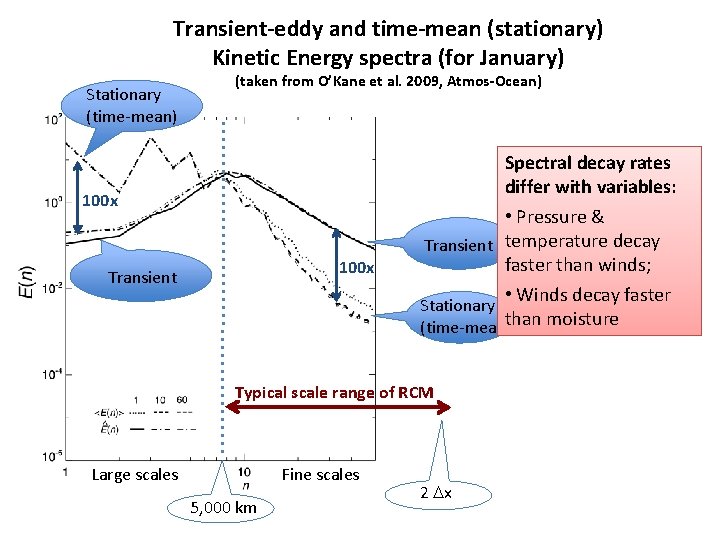
Transient-eddy and time-mean (stationary) Kinetic Energy spectra (for January) Stationary (time-mean) (taken from O’Kane et al. 2009, Atmos-Ocean) 100 x Transient Spectral decay rates differ with variables: • Pressure & Transient temperature decay faster than winds; • Winds decay faster Stationary (time-mean)than moisture Typical scale range of RCM Fine scales Large scales 5, 000 km 2 Dx
– Clear to the naked eye in the time evolution of RCMsimulated fields – But what about climatological (time-mean) fields? • Yes for fields strongly affected by local, stationary forcings, such as mountains, land-sea contrast, etc. • Usually not for other fields: – Time-averaged (stationary-eddy) fields variance mostly contained in large-scale part of the spectrum; well resolved by coarse-mesh GCM – The small-scale part of the spectrum (added by hires RCM) is dominated by transient eddies (not seen in time-mean fields)
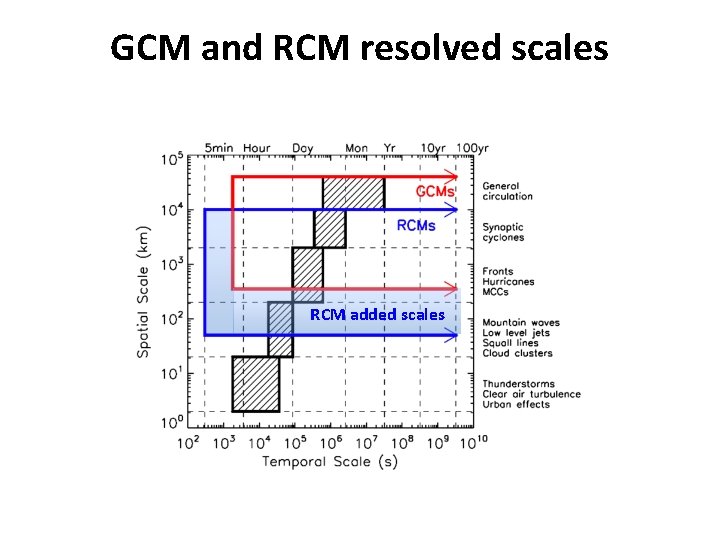
Scale separation • For most atmospheric fields, the variance spectrum of time-averaged (climatological) fields is dominated by large scales: – This hides the potential added value of increased resolution contained in fine scales • Scale separation is a useful (sometimes necessary) tool to identify RCM potential added value
GCM and RCM resolved scales RCM added scales
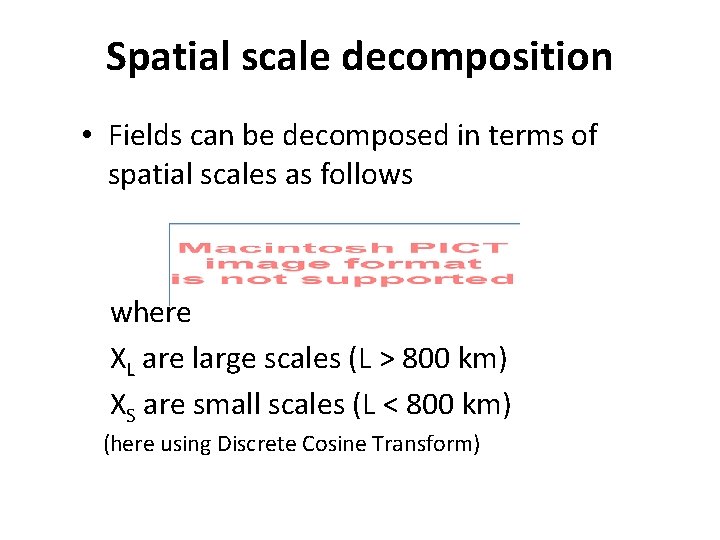
Spatial scale decomposition • Fields can be decomposed in terms of spatial scales as follows where XL are large scales (L > 800 km) XS are small scales (L < 800 km) (here using Discrete Cosine Transform)
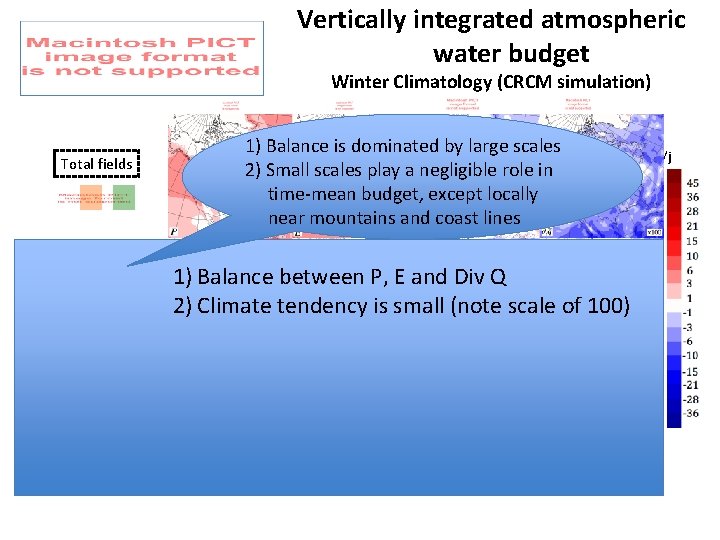
Vertically integrated atmospheric water budget Winter Climatology (CRCM simulation) Total fields Large scales L > 800 km Small scales L < 800 km 1) Balance is dominated by large scales 2) Small scales play a negligible role in time-mean budget, except locally near mountains and coast lines 1) Balance between P, E and Div Q 2) Climate tendency is small (note scale of 100) mm/j
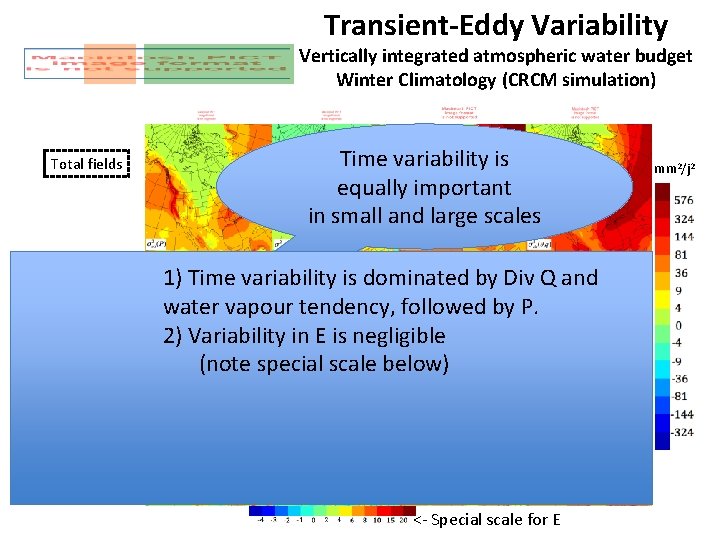
Transient-Eddy Variability Vertically integrated atmospheric water budget Winter Climatology (CRCM simulation) Total fields Large scales L > 800 km Time variability is equally important in small and large scales 1) Time variability is dominated by Div Q and water vapour tendency, followed by P. 2) Variability in E is negligible (note special scale below) Small scales L < 800 km <- Special scale for E mm 2/j 2
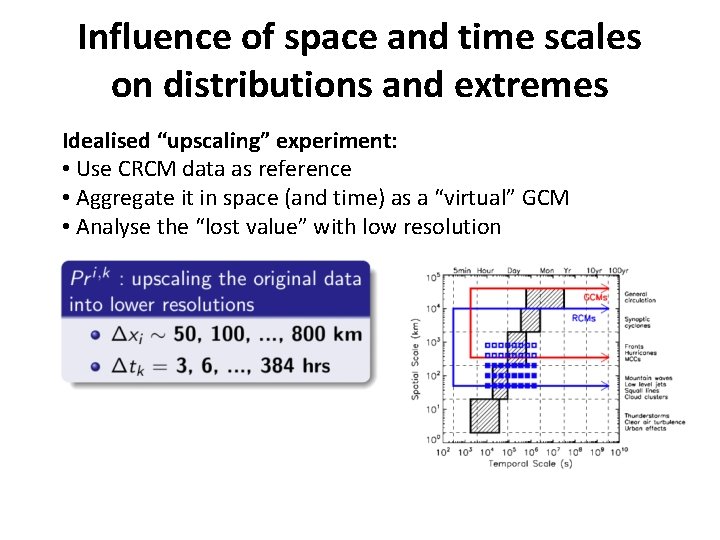
Influence of space and time scales on distributions and extremes Idealised “upscaling” experiment: • Use CRCM data as reference • Aggregate it in space (and time) as a “virtual” GCM • Analyse the “lost value” with low resolution
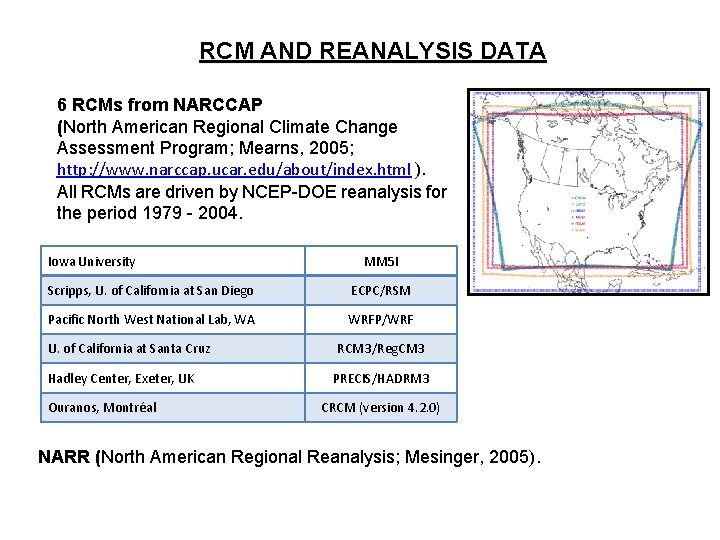
RCM AND REANALYSIS DATA 6 RCMs from NARCCAP (North American Regional Climate Change Assessment Program; Mearns, 2005; http: //www. narccap. ucar. edu/about/index. html ). All RCMs are driven by NCEP-DOE reanalysis for the period 1979 - 2004. Iowa University MM 5 I Scripps, U. of California at San Diego ECPC/RSM Pacific North West National Lab, WA WRFP/WRF U. of California at Santa Cruz Hadley Center, Exeter, UK Ouranos, Montréal RCM 3/Reg. CM 3 PRECIS/HADRM 3 CRCM (version 4. 2. 0) NARR (North American Regional Reanalysis; Mesinger, 2005).
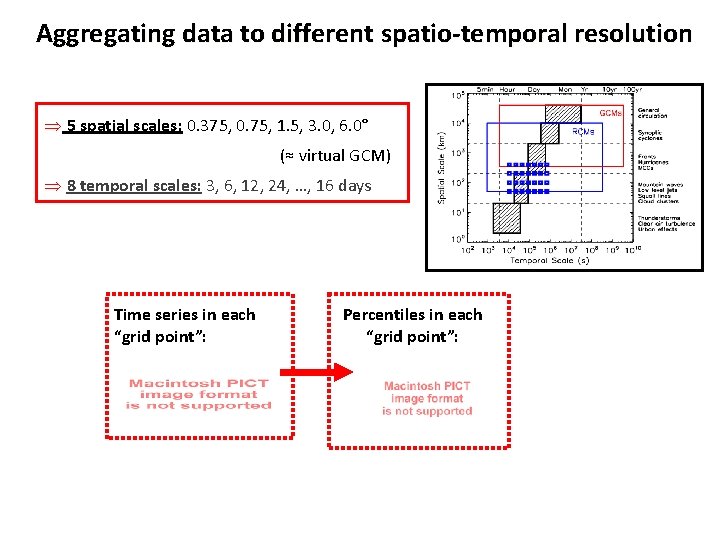
Aggregating data to different spatio-temporal resolution Þ 5 spatial scales: 0. 375, 0. 75, 1. 5, 3. 0, 6. 0° (≈ virtual GCM) Þ 8 temporal scales: 3, 6, 12, 24, …, 16 days Time series in each “grid point”: Percentiles in each “grid point”:
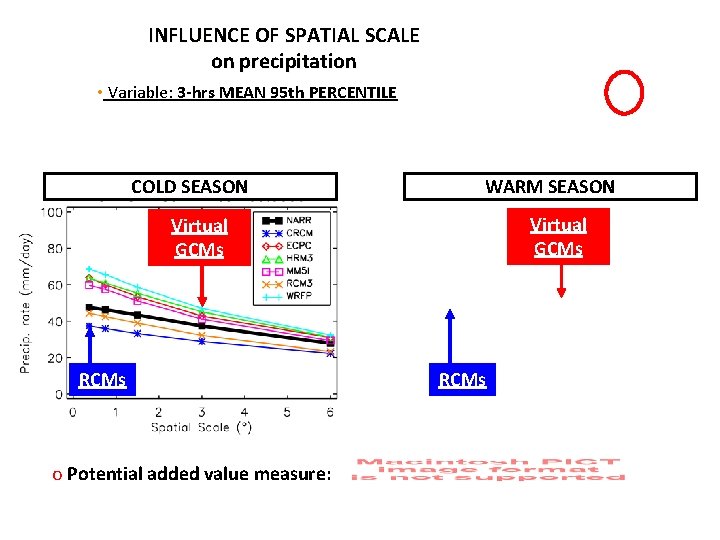
INFLUENCE OF SPATIAL SCALE on precipitation • Variable: 3 -hrs MEAN 95 th PERCENTILE COLD SEASON WARM SEASON Virtual GCMs RCMs o Potential added value measure: RCMs
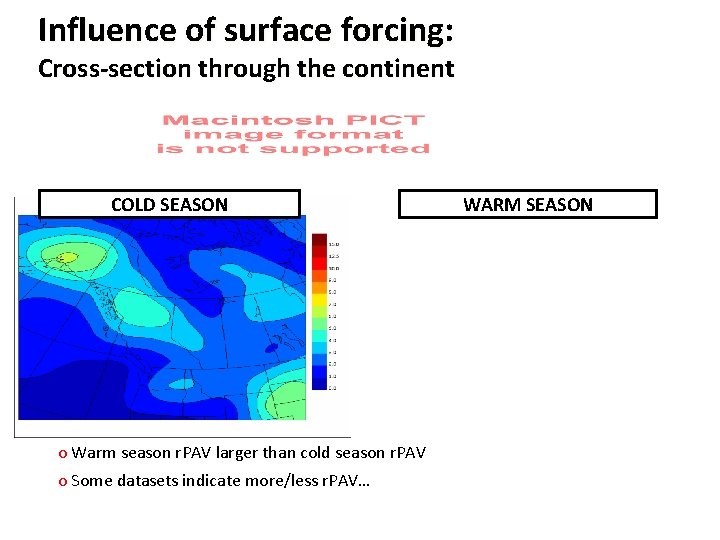
Influence of surface forcing: Cross-section through the continent COLD SEASON o Warm season r. PAV larger than cold season r. PAV o Some datasets indicate more/less r. PAV… WARM SEASON
Conclusions • The main potential added value (PAV) of high-resolution RCM is contained in the fine scales – Although some large-scale effects may be felt as a result of small-scale processes affecting large scales • Do not look for PAV in time-averaged, climatological quantities: – Except where there is strong local stationary forcing (e. g. mountains, land-sea contrast), time averaging tends to remove small scales – Scale separation is a useful, sometimes necessary, tool to identify PAV • Look for PAV in variability statistics: – Transient-eddy variability – Extremes in distributions References: • Laprise, R. de Elía, D. Caya, S. Biner, Ph. Lucas-Picher, E. P. Diaconescu, M. Leduc, A. Alexandru and L. Separovic, 2008: Challenging some tenets of Regional Climate Modelling. Meteor. Atmos. Phys. 100 • Bresson, R. , and R. Laprise, 2009: Scale-decomposed atmospheric water budget over North America as simulated by the Canadian Regional Climate Model for current and future climates. Clim. Dyn. 1 -20 • Di Luca, A. , R. de Elía and R. Laprise: Assessment of the potential added value in multi-RCM simulated precipitation (in preparation)