Warmup Graph the following and find the amplitude

- Slides: 8
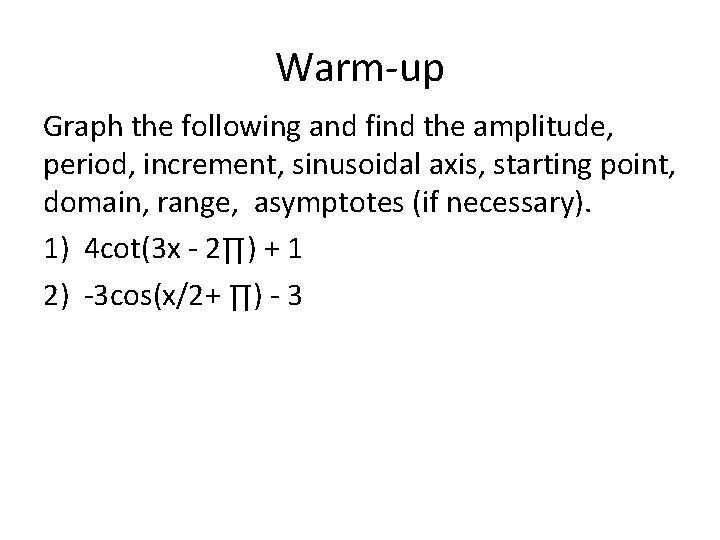
Warm-up Graph the following and find the amplitude, period, increment, sinusoidal axis, starting point, domain, range, asymptotes (if necessary). 1) 4 cot(3 x - 2∏) + 1 2) -3 cos(x/2+ ∏) - 3
Graphing Secant and Cosecant
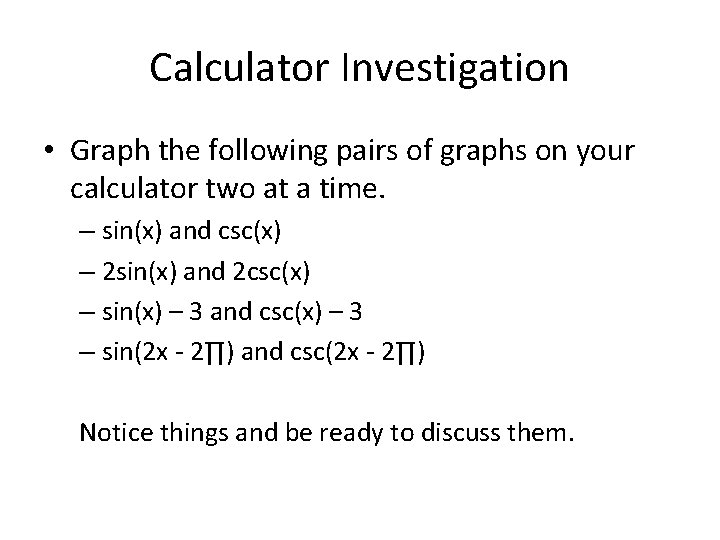
Calculator Investigation • Graph the following pairs of graphs on your calculator two at a time. – sin(x) and csc(x) – 2 sin(x) and 2 csc(x) – sin(x) – 3 and csc(x) – 3 – sin(2 x - 2∏) and csc(2 x - 2∏) Notice things and be ready to discuss them.
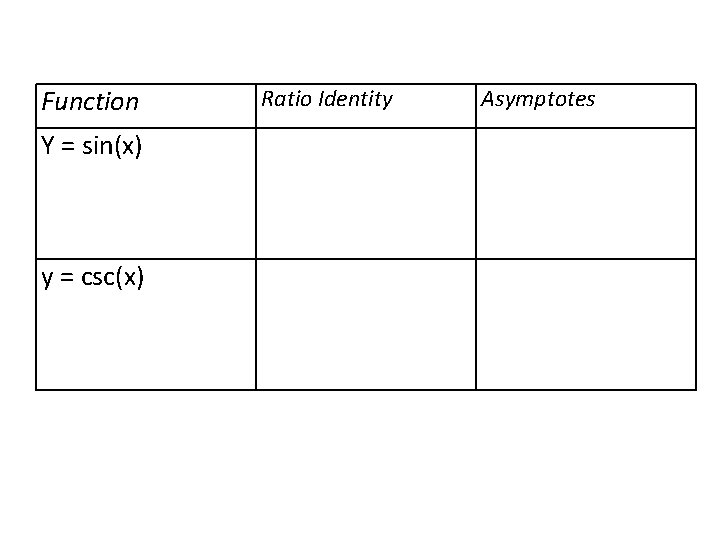
Function Ratio Identity Asymptotes Y = sin(x) y = csc(x)
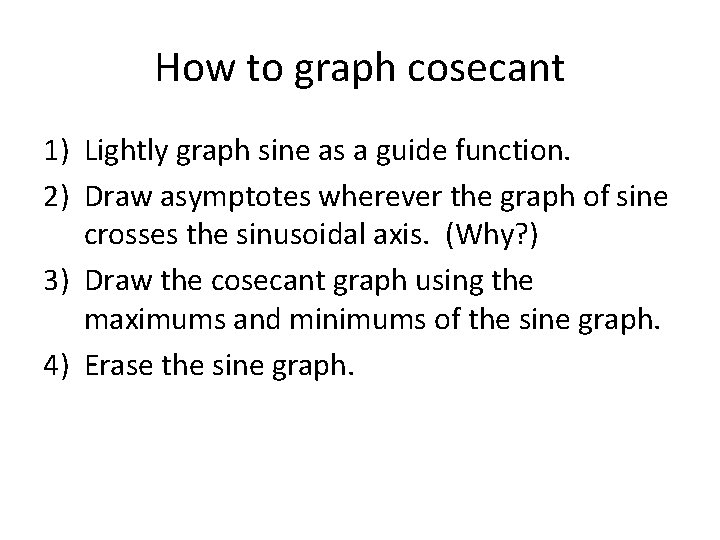
How to graph cosecant 1) Lightly graph sine as a guide function. 2) Draw asymptotes wherever the graph of sine crosses the sinusoidal axis. (Why? ) 3) Draw the cosecant graph using the maximums and minimums of the sine graph. 4) Erase the sine graph.
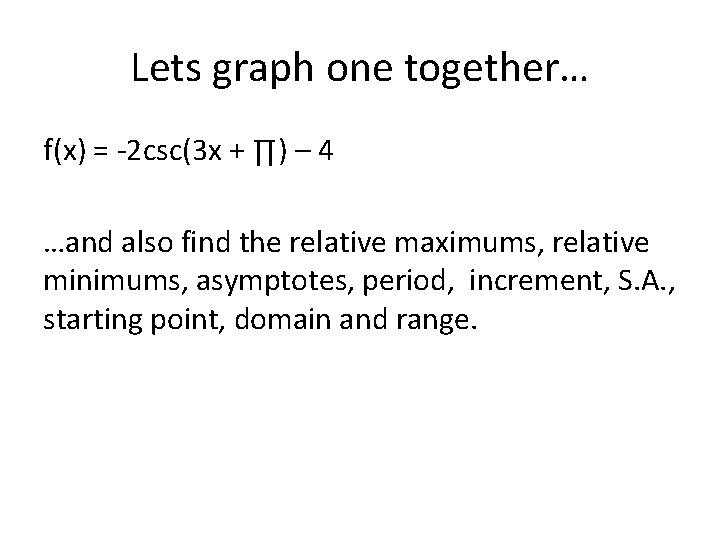
Lets graph one together… f(x) = -2 csc(3 x + ∏) – 4 …and also find the relative maximums, relative minimums, asymptotes, period, increment, S. A. , starting point, domain and range.
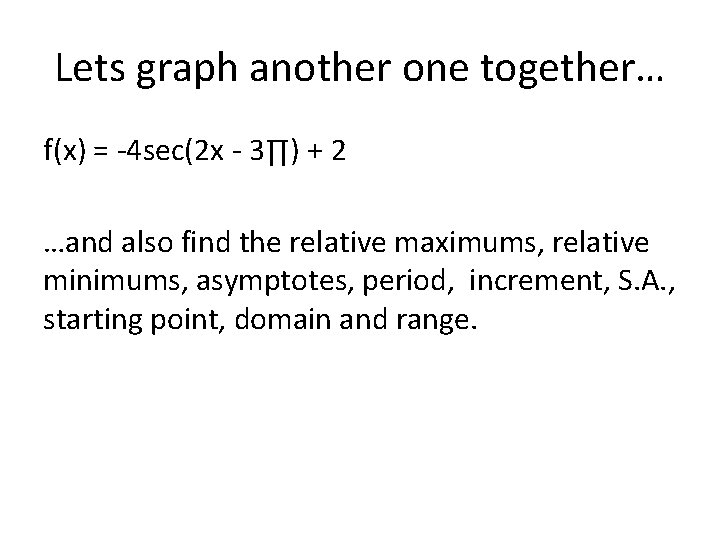
Lets graph another one together… f(x) = -4 sec(2 x - 3∏) + 2 …and also find the relative maximums, relative minimums, asymptotes, period, increment, S. A. , starting point, domain and range.
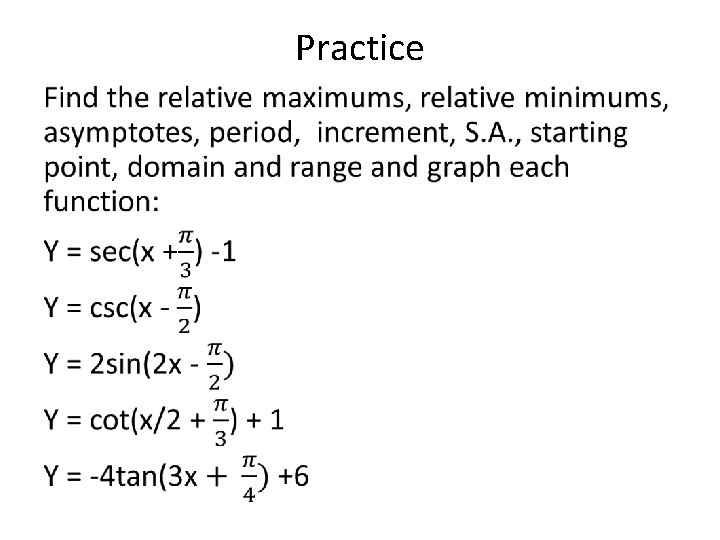
Practice •