Using nighttime imagery to estimate Gross Domestic Product


 Nightlight to GDP simple linear proportionality for")


- Slides: 19
Using nighttime imagery to estimate Gross Domestic Product at subnational levels in Africa Professor Paul C. Sutton Department of Geography & the Environment University of Denver, CO 80208 Association of American Geographers Annual Conference April, 2018 New Orleans, LA 1
Co-Conspirators This work resulted from a collaboration amongst several people from the Geography Department and the school of International Studies at the University of Denver. Xuantong Wang Phd Student – Department of Geography & the Environment University of Denver Mickey Rafa and Jonathan Moyer Pardee Center for International Futures Josef Korbel School of International Studies University of Denver 2
Background Using nighttime satellite imagery as a proxy of economic activity Been doing this for a while but no one really noticed. . .
Micky Rafa and Jonathan Moyer at Pardee Center for International Futures were looking into methods of sub-national GDP estimation for USAID work they were doing in Uganda and saw that some of the authors on papers they were reading were less than 100 yards away. . . We collaborated to produce this report:
UGANDA SUB-NATIONAL DATA AVAILABILITY
This garnered significant media attention in Uganda – Made cover of biggest Newspaper in Uganda
Best available sub-national GDP data was GEcon Grids Drawbacks -accuracy -big grid cells -no match to admin boundaries
Light intensity model of GDP derived from DMSP nighttime Satellite image Benefits -More accurate -Can be matched to admin boundaries -Available in time series - Objective & uniform in coverage - DMSP to VIIRS improvements coming
Population Density model of GDP derived from Landscan population grid Highly correlated With light intensity model R 2=0. 90
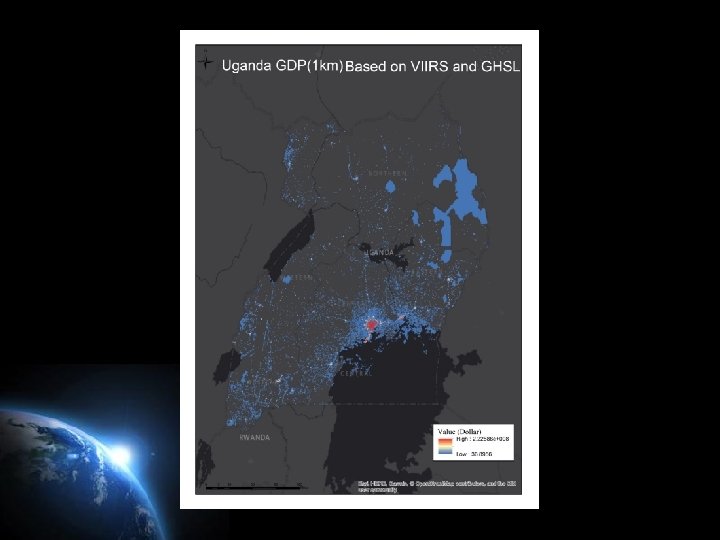
How the spatial allocation models worked 1) Nightlight to GDP simple linear proportionality for lit areas only. 2) Population Density to GDP simple linear proportionality for dark areas. 3) Agricultural Production ratios (Quantity and Price) for dark areas. There is no validation data of sub-national GDP for the districts of Uganda These methods have been shown to be accurate for other countries. All of these models are highly intercorrelated. US AID experts preferred the model that incorporated Agricultural data.
Characterizing Inequality amongst districts
Aerial Photo of Kampala
KEY FINDINGS: SPATIAL GDP ANALYSIS GDP is concentrated in Central Uganda. • The top 19 economies in Uganda make up 75% of the total GDP of Uganda, leaving the remaining 25% of the national economy coming from 97 districts. • Kampala, Wakiso, and Mukono account for nearly half of Uganda's total GDP, while comprising only about 10% of Uganda's population.
Lorenz Curve for the 116 Districts of Uganda - a mechanism for estimating GINI coefficient
Future Applications USAID is interested in using these kinds of methods to do the following: 1)Estimate electricity consumption 2)Estimate access to education and health care 3)IMF is interested in using for grid level GDP estimates in Rwanda and East Africa in general.
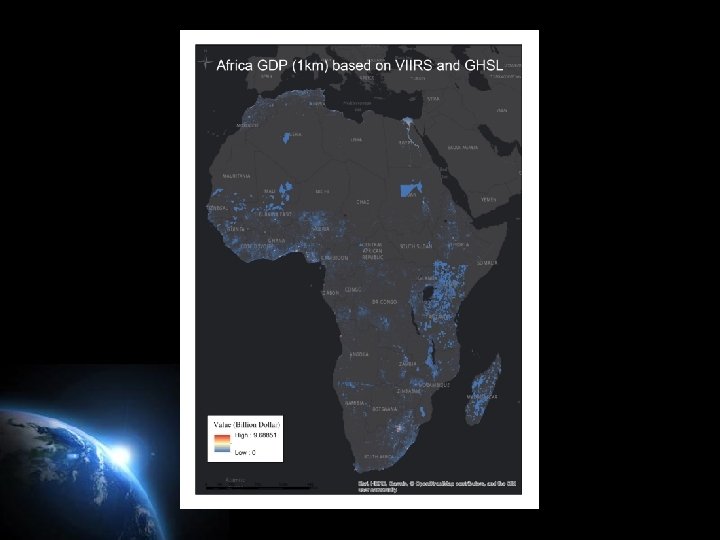
Abstract Subnational socio-economic data are often difficult to obtain in low-income country contexts. Gross Domestic Product (GDP) data – and by extension, GDP per capita – do not exist for the 116 districts of Uganda, but there are many ways of constructing estimates with conceptual validity. This paper compares traditional regression-based approaches for estimation with geospatial models that use nighttime satellite imagery (from the Defense Meteorological Satellite Program-Operational Line Scanner, DMSP-OLS) and grid-based population density (from Landscan) to allocate Uganda’s national GDP to the district level. This paper also includes district-level data on agricultural production and the market value of associated crops to represent iwithin country variations in agriculture’s contribution to GDP. We apply these methods to all countries in Africa to produce a spatially disaggregated map of GDP and GDP per capita at a spatial resolution of 1 km 2. Keywords: GDP Proxy measure, sub-national GDP Estimation, Uganda
Questions? Silverback at Bwindi Impenetrable Forest National Park