Tropical forest monitoring networks Yadvinder Malhi University of
- Slides: 20
Tropical forest monitoring networks Yadvinder Malhi University of Oxford
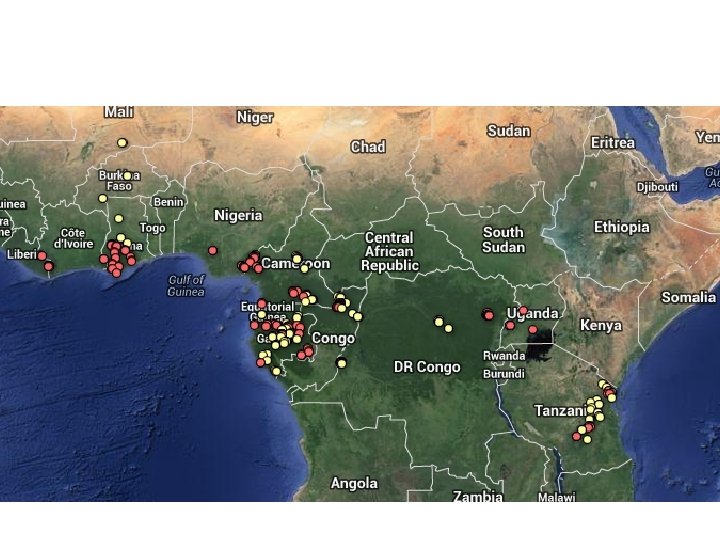
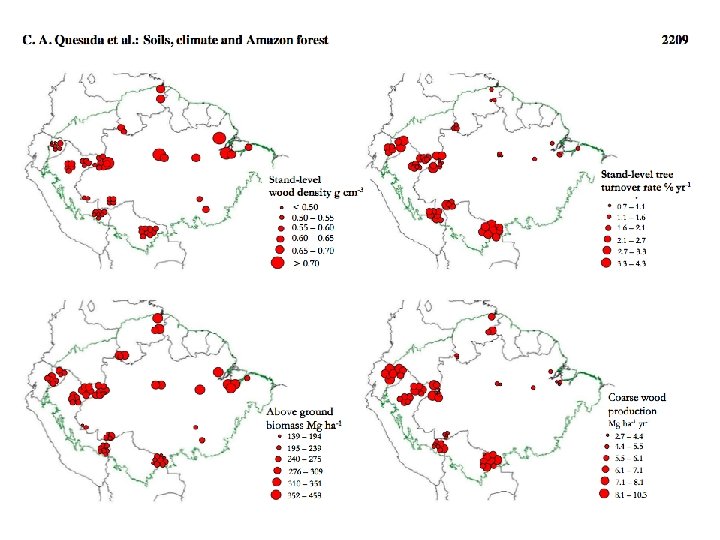
Tropical forests are variable in soils, climate, faunal and floral composition, disturbance history and biogeographical context
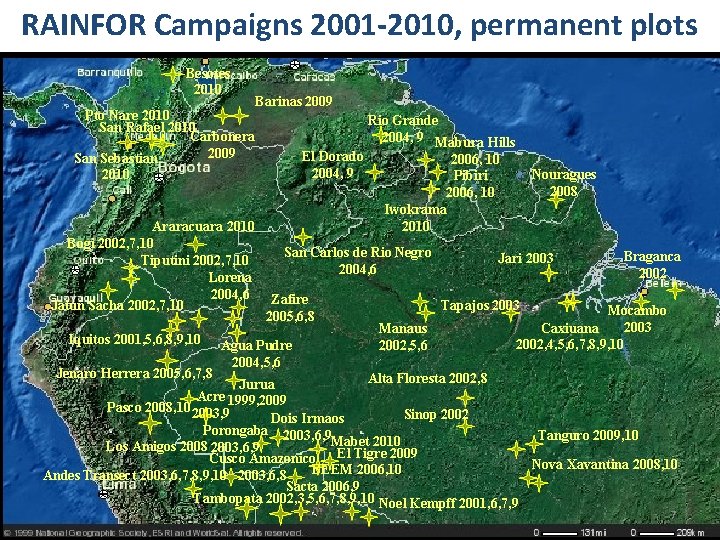
RAINFOR Campaigns 2001 -2010, permanent plots Besotes 2010 Pto Nare 2010 San Rafael 2010 Carbonera 2009 San Sebastian Barinas 2009 El Dorado 2004, 9 2010 Araracuara 2010 Bogi 2002, 7, 10 Tiputini 2002, 7, 10 Lorena 2004, 6 Jatun Sacha 2002, 7, 10 Iquitos 2001, 5, 6, 8, 9, 10 Jenaro Herrera 2005, 6, 7, 8 Rio Grande 2004, 9 Mabura Hills 2006, 10 Pibiri 2006, 10 Iwokrama 2010 San Carlos de Rio Negro 2004, 6 Zafire 2005, 6, 8 Agua Pudre 2004, 5, 6 Nouragues 2008 Jari 2003 Braganca 2002 Tapajos 2003 Manaus 2002, 5, 6 Mocambo 2003 Caxiuana 2002, 4, 5, 6, 7, 8, 9, 10 Alta Floresta 2002, 8 Jurua Acre Pasco 2008, 10 2003, 91999, 2009 Sinop 2002 Dois Irmaos Porongaba 2003, 6, 9 Tanguro 2009, 10 Mabet 2010 Los Amigos 2008 2003, 6, 9 El Tigre 2009 Cusco Amazonico Nova Xavantina 2008, 10 BEEM 2006, 10 Andes Transect 2003, 6, 7, 8, 9, 10 2003, 6, 8 Sacta 2006, 9 Tambopata 2002, 3, 5, 6, 7, 8, 9, 10 Noel Kempff 2001, 6, 7, 9 7
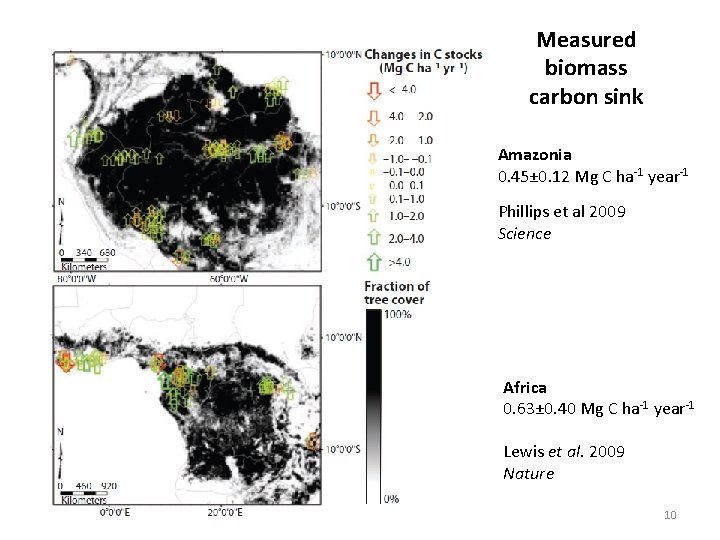
Measured biomass carbon sink Amazonia 0. 45± 0. 12 Mg C ha-1 year-1 Phillips et al 2009 Science Africa 0. 63± 0. 40 Mg C ha-1 year-1 Lewis et al. 2009 Nature 10
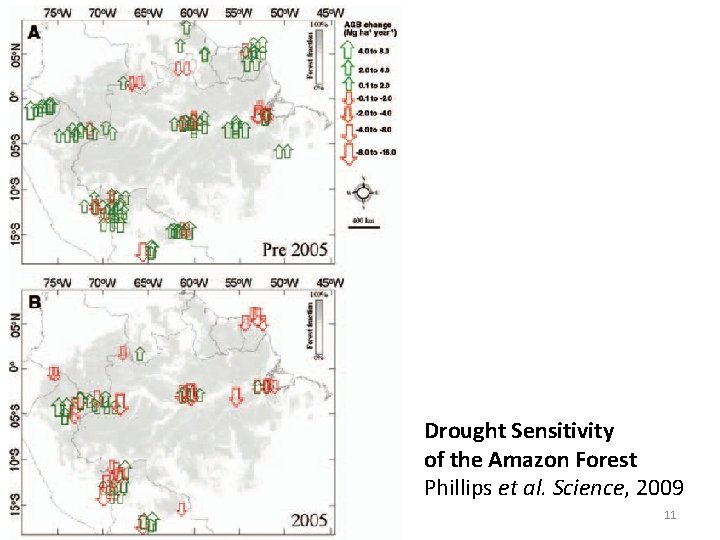
Drought Sensitivity of the Amazon Forest Phillips et al. Science, 2009 11
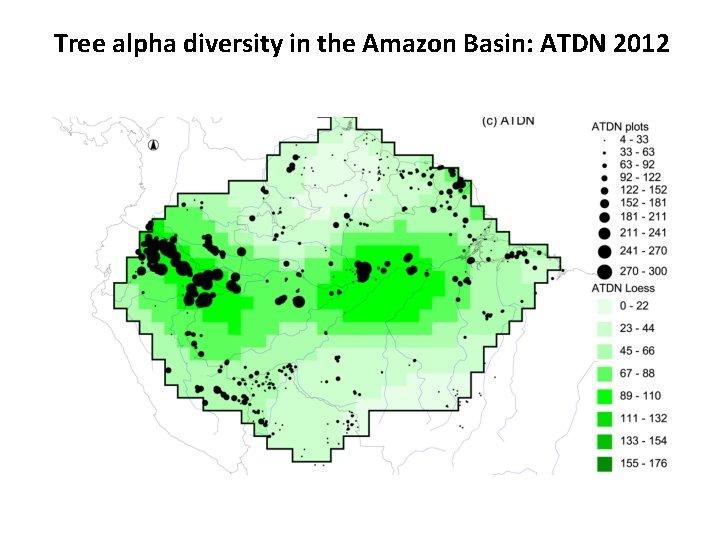
Tree alpha diversity in the Amazon Basin: ATDN 2012
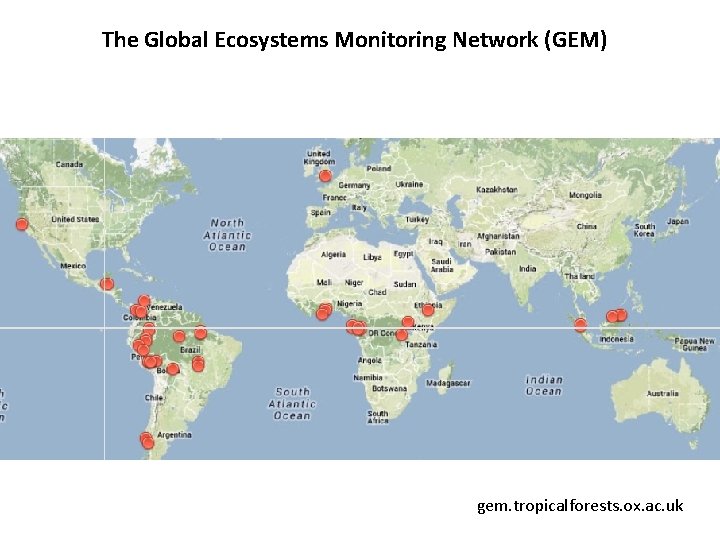
The Global Ecosystems Monitoring Network (GEM) gem. tropicalforests. ox. ac. uk
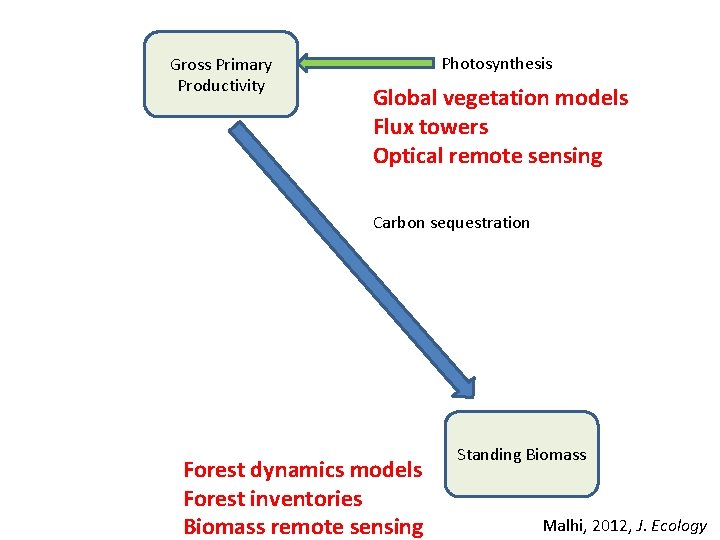
Gross Primary Productivity Photosynthesis Global vegetation models Flux towers Optical remote sensing Carbon sequestration Forest dynamics models Forest inventories Biomass remote sensing Standing Biomass Malhi, 2012, J. Ecology
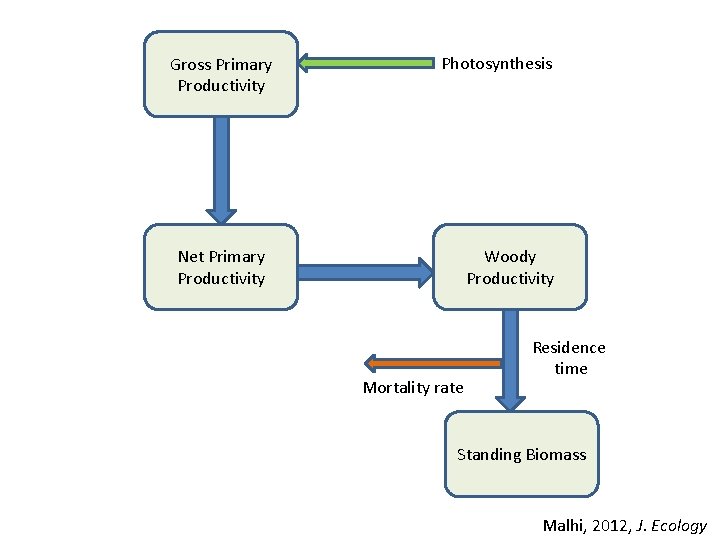
Gross Primary Productivity Photosynthesis Net Primary Productivity Woody Productivity Mortality rate Residence time Standing Biomass Malhi, 2012, J. Ecology
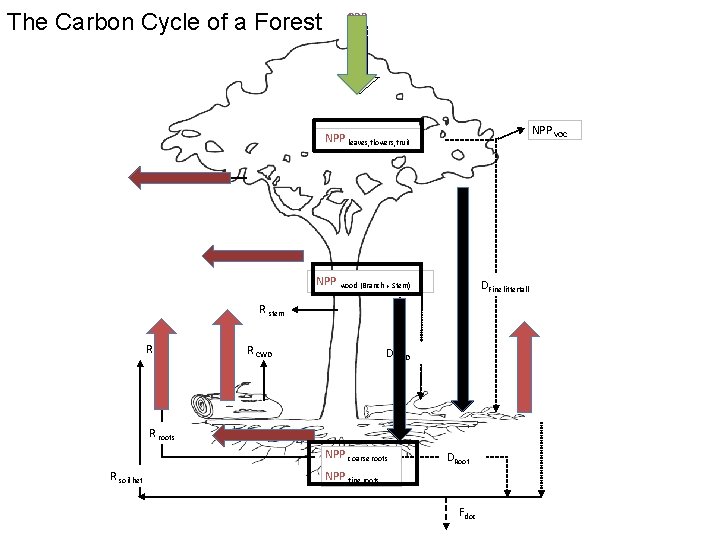
The Carbon Cycle of a Forest GPP NPP VOC NPP leaves, flowers, fruit R leaf NPP wood (Branch + Stem) DFine litterfall R stem R soil R CWD DCWD R roots NPP coarse roots R soil het DRoot NPP fine roots Fdoc
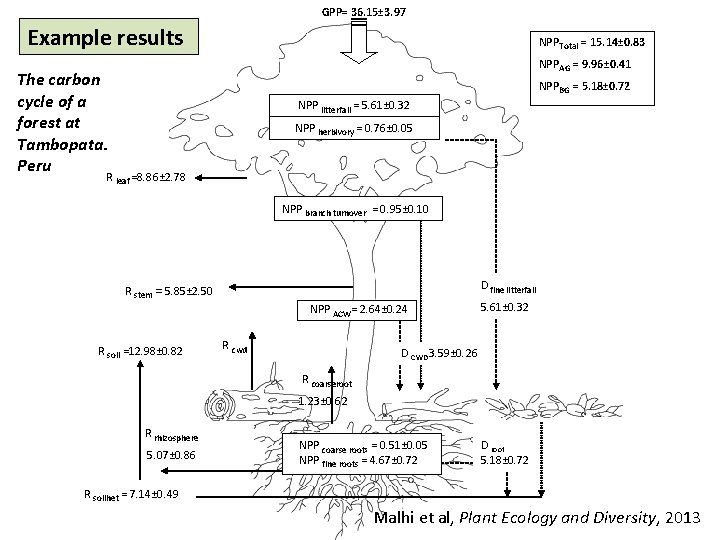
GPP= 36. 15± 3. 97 Example results NPPTotal = 15. 14± 0. 83 NPPAG = 9. 96± 0. 41 The carbon cycle of a forest at Tambopata. Peru NPPBG = 5. 18± 0. 72 NPP litterfall = 5. 61± 0. 32 NPP herbivory = 0. 76± 0. 05 R leaf =8. 86± 2. 78 NPP branch turnover = 0. 95± 0. 10 D fine litterfall R stem = 5. 85± 2. 50 NPP ACW= 2. 64± 0. 24 R soil =12. 98± 0. 82 R cwd 5. 61± 0. 32 D CWD 3. 59± 0. 26 R coarseroot 1. 23± 0. 62 R rhizosphere 5. 07± 0. 86 NPP coarse roots = 0. 51± 0. 05 NPP fine roots = 4. 67± 0. 72 D root 5. 18± 0. 72 R soilhet = 7. 14± 0. 49 Malhi et al, Plant Ecology and Diversity, 2013
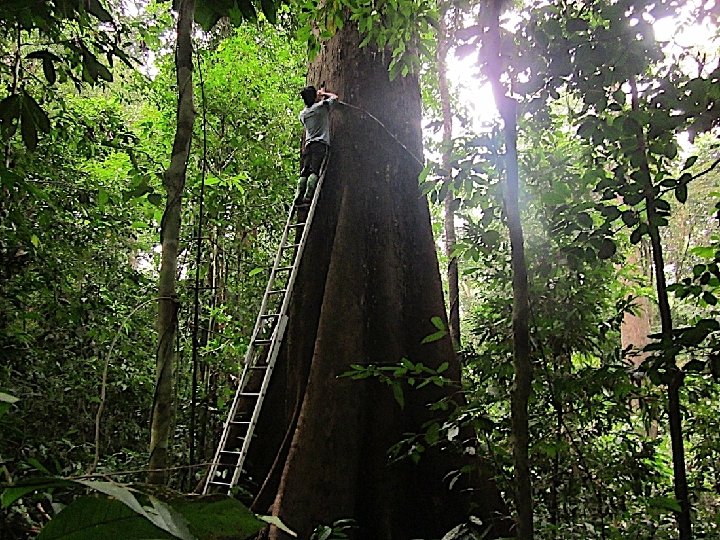
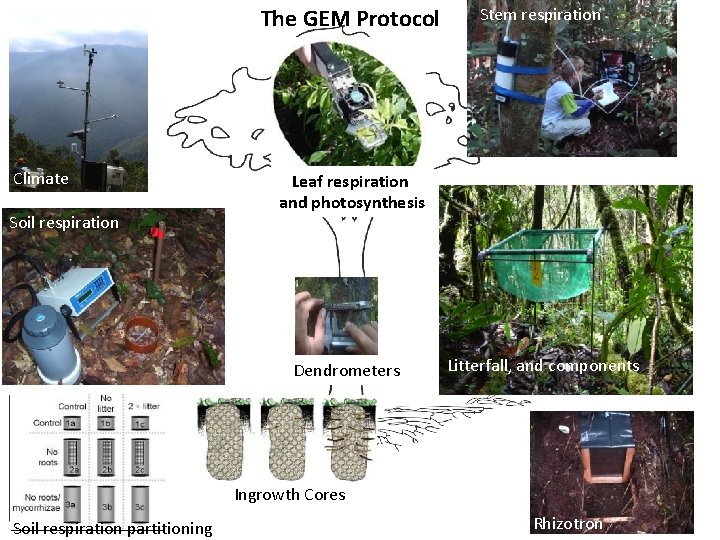
The GEM Protocol Climate Soil respiration Stem respiration Leaf respiration and photosynthesis Dendrometers Litterfall, and components Ingrowth Cores Soil respiration partitioning Rhizotron
Conclusions • Tropical forests are variable in soils, climate, faunal and floral composition, disturbance history and biogeographical context • Networks of forest plots are much greater than the sum of the parts • Standardization of measurement protocols are important for robust comparison • But the most important point is to reach out and build the networks