Ecosystems What Are They and How Do They


 Core")


 Precipitation Carbon dioxide (CO 2) Producer Secondary consumer (fox) Primary consumer")


 § Producers – autotrophs • Photosynthesis § Consumers – heterotrophs •")
 § Decomposers § Detrivores")


 Heat Producers (plants) Decomposers (bacteria, fungi)")


 Heat Second Trophic Third Trophic Fourth Trophic Level Primary")


 Tertiary consumers (human) 10 Secondary")
 § Net primary productivity")

")


 § Holds water molecules together – hydrogen bonding")
 § Dissolves a variety of compounds § Filters")
 § CO 2 makes up")
 Burning fossil fuels")


 §")


")


- Slides: 114
Ecosystems: What Are They and How Do They Work? Chapter 3
Core Case Study: Insects § Around for ~400 million years § Bad reputation § Useful to humans and ecosystems § Vital roles in sustaining life • Pollinators • Natural pest control • Renewing soils
Importance of Insects
3 -1 What Is Ecology? § Concept 3 -1 Ecology is a study of how organisms interact with one another and with their physical environment of matter and energy.
Cells Are the Basic Units of Life § Composition of an organism • • • Cells Cell nucleus Chromosome DNA Gene
A human body contains trillions of cells, each with an identical set of genes. Each human cell (except for red blood cells) contains a nucleus. Each cell nucleus has an identical set of chromosomes, which are found in pairs. A specific pair of chromosomes contains one chromosome from each parent. Each chromosome contains a long DNA molecule in the form of a coiled double helix. Genes are segments of DNA on chromosomes that contain instructions to make proteins—the building blocks of life. Fig. 3 -2, p. 40
A human body contains trillions of cells, each with an identical set of genes. Each human cell (except for red blood cells) contains a nucleus. Each cell nucleus has an identical set of chromosomes, which are found in pairs. A specific pair of chromosomes contains one chromosome from each parent. Each chromosome contains a long DNA molecule in the form of a coiled double helix. Genes are segments of DNA on chromosomes that contain instructions to make proteins—the building blocks of life. Stepped Art Fig. 3 -2, p. 40
Ecology § How organisms interact with biotic and abiotic environment – oikos and logos § Focuses on specific levels of matter: • • • Organism Population Community Ecosystem Biosphere
Biosphere Parts of the earth's air, water, and soil where life is found Ecosystem A community of different species interacting with one another and with their nonliving environment of matter and energy Community Populations of different species living in a particular place, and potentially interacting with each other Population A group of individuals of the same species living in a particular place Organism An individual living being Cell The fundamental structural and functional unit of life Molecule Chemical combination of two or more atoms of the same or different elements Atom Smallest unit of a chemical element that exhibits chemical properties Fig. 3 -3, p. 41
Biosphere Parts of the earth's air, water, and soil where life is found Ecosystem A community of different species interacting with one another and with their nonliving environment of matter and energy Community Populations of different species living in a particular place, and potentially interacting with each other Population A group of individuals of the same species living in a particular place Organism An individual living being Cell The fundamental structural and functional unit of life Molecule Chemical combination of two or more atoms of the same or different elements Atom Smallest unit of a chemical element that exhibits chemical properties Stepped Art Fig. 3 -3, p. 41
Genetic Diversity of a Caribbean Snail Fig. 3 -4, p. 41
Science Focus: Which Species Rule the World? § Microbes and microorganisms are everywhere • Bacteria • Fungi • Protozoa § Most microbes are useful and critical for individuals and ecosystems § Only a few microbes cause diseases
3 -2 What Keeps Us and Other Organisms Alive? § Concept 3 -2 Life is sustained by the flow of energy from the sun through the biosphere, the cycling of nutrients within the biosphere, and gravity.
Earth Has Four Major Life-Support Components § Atmosphere § Hydrosphere § Geosphere § Biosphere
Vegetation and animals Atmosphere Biosphere Soil Rock Lithosphere Crust Mantle Biosphere (living organisms) Core Mantle Geosphere (crust, mantle, core) Atmosphere (air) Crust (soil and rock) Hydrosphere (water) Fig. 3 -5, p. 42
Classification of the Biosphere § Biomes – terrestrial regions with similar vegetation § Aquatic life zones • Freshwater life zones • Marine life zones
Coastal mountain ranges Sierra Nevada Great American Desert Coastal chaparral Coniferous and scrub forest Rocky Mountains Desert Great Plains Coniferous forest Mississippi Appalachian River Valley Mountains Prairie grassland Deciduous forest Fig. 3 -6, p. 43
Three Factors Sustain Life on Earth § One-way flow of high-quality energy from the sun § Cycling of matter or nutrients through parts of the biosphere § Gravity
Solar Energy Reaching the Earth § Electromagnetic waves • Visible light • UV radiation • Heat § Natural greenhouse effect § Energy in = energy out § Human-enhanced global warming
Solar radiation Energy in = Energy out Reflected by atmosphere UV radiation Most absorbed by ozone Radiated by atmosphere as heat Lower Stratosphere (ozone layer) Visible light Troposphere Heat Absorbed by the earth Heat radiated by the earth Greenhouse effect Fig. 3 -7, p. 44
3 -3 What Are the Major Components of an Ecosystem? § Concept 3 -3 Some organisms produce the nutrients they need, others get the nutrients they need by consuming other organisms, and some recycle nutrients back to producers by decomposing the wastes and remains of organisms.
Living and Nonliving Components § Abiotic • • Water Air Nutrients Solar energy § Biotic • Plants • Animals • Microbes
Ecosystem Components
Oxygen (O 2) Precipitation Carbon dioxide (CO 2) Producer Secondary consumer (fox) Primary consumer (rabbit) Producers Water Decomposers Soluble mineral nutrients Fig. 3 -8, p. 45
Limiting Abiotic Factors § Limit number or organisms in a population § Common terrestrial factors • Precipitation • Soil nutrients • Temperature § Common aquatic factors • Dissolved oxygen • Salinity
Range of Tolerance
Abundance of organisms Lower limit of tolerance Few No organisms Population size Lower limit of tolerance Few No organisms Zone of intolerance physiological stress Low Optimum range Temperature Zone of physiological intolerance stress High Fig. 3 -9, p. 45
Trophic Levels (1) § Producers – autotrophs • Photosynthesis § Consumers – heterotrophs • Primary • Secondary • Third-level § Omnivores
Trophic Levels (2) § Decomposers § Detrivores
Detritus Feeders and Decomposers
Detritus feeders Decomposers Carpenter Termite and Bark beetle ant galleries carpenter engraving Dry rot ant work Long-horned fungus beetle holes Wood reduced Mushroom to powder Time progression Powder broken down by decomposers into plant nutrients in soil Fig. 3 -10, p. 47
Consumption of Energy § Chemical energy stored in food fuels life processes § Aerobic respiration § Anaerobic respiration
Energy Flow and Nutrient Recycling § Ecosystems sustained through: • One-way energy flow from the sun • Nutrient recycling
Structural Components of an Ecosystem
Heat Abiotic chemicals (carbon dioxide, oxygen, nitrogen, minerals) Heat Producers (plants) Decomposers (bacteria, fungi) Heat Solar energy Consumers (herbivores, carnivores) Heat Fig. 3 -11, p. 47
3 -4 What Is Biodiversity and Why Is It Important? § Concept 3 -4 A The biodiversity found in the earth’s genes, species, ecosystems, and ecosystem processes is vital to sustaining life on earth. § Concept 3 -4 B Soil is an important component of biodiversity that supplies most of the nutrients needed for plant growth and helps purify and store water and control levels of carbon dioxide in the atmosphere.
Biodiversity § Genetic diversity § Ecosystem diversity § Functional diversity
Biodiversity: Natural Capital
Functional Diversity The biological and chemical processes such as energy flow and matter recycling needed for the survival of species, communities, and ecosystems. Genetic Diversity The variety of genetic material within a species or a population. Ecological Diversity The variety of terrestrial and aquatic ecosystems found in an area or on the earth. Species Diversity The number and abundance of species present in different communities Fig. 3 -12, p. 48
Species Diversity
Science Focus: Soils § Base of life on land § Eroded rock, mineral nutrients, decaying organic matter, water, air, and organisms § Key component of biodiversity § Soil profiles
Soil Profiles and Soil Maturation
Wood sorrel Oak tree Fern Organic debris Earthworm builds up Rock Millipede Grasses and fragments Honey Mole small shrubs Moss fungus and lichen O horizon Leaf litter A horizon Topsoil Bedrock Immature soil B horizon Subsoil Young soil C horizon Parent material Mite Nematode Root system Mature soil Red earth mite Bacteria Fungus Fig. 3 -A, p. 49
3 -5 What Happens to Energy in an Ecosystem? § Concept 3 -5 As energy flows through ecosystems in food chains and webs, the amount of chemical energy available to organisms at each succeeding feeding level decreases.
Energy Flow in Ecosystems § Food chain • Sequence of organisms, each of which serves as a source of food for the next § Food web • Network of interconnected food chains • More complex than a food chain § Trophic levels
Terrestrial Food Chain
First Trophic Level Producers (plants) Heat Second Trophic Third Trophic Fourth Trophic Level Primary Secondary Tertiary consumers (herbivores) (carnivores) (top carnivores) Heat Solar energy Heat Decomposers and detritus feeders Fig. 3 -14, p. 51
As we go further along a food chain, there are fewer and fewer consumers. In other words, a large mass of living things at the base is required to support a few at the top. . . many herbivores are needed to support a few carnivores
Antarctic Ocean Food Web • Antarctic Ocean Food Web
Simplified Marine Antarctic Food Web
Humans Sperm whale Blue whale Elephant seal Crabeater seal Adelie penguin Killer whale Leopard seal Emperor penguin Squid Petrel Fish Carnivorous plankton Herbivorous zooplankton Krill Phytoplankton Fig. 3 -15, p. 51
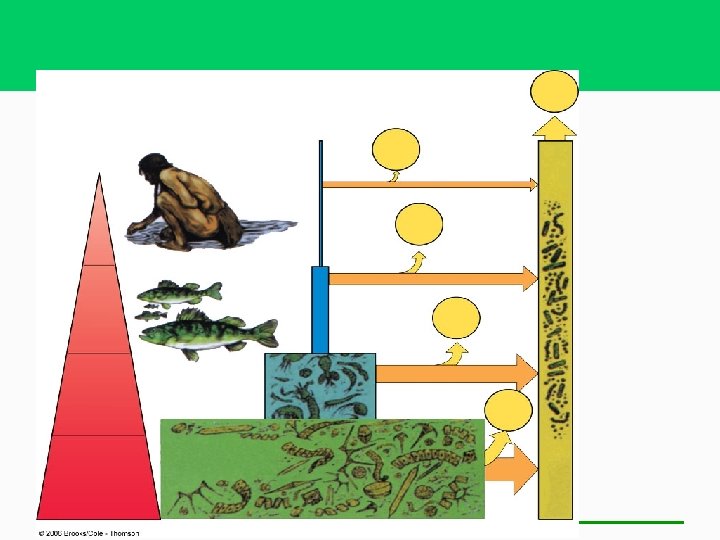
Usable Energy by Trophic Level § Energy flow follows the second law of thermodynamics § Biomass decreases with increasing trophic level § Ecological efficiency – typically 10% § Pyramid of energy flow
Pyramid of Energy • Energy Flow begins with PRIMARY PRODUCTIVITY, the amount of light energy converted to chemical energy (stored in organic molecules) by an ecosystem's autotrophs over a given period of time via the process of PHOTOSYNTHESIS.
Generalized Pyramid of Energy Flow
Usable energy available at each trophic level (in kilocalories) Tertiary consumers (human) 10 Secondary consumers (perch) 100 Primary consumers (zooplankton) Heat Decomposers Heat 1, 000 Heat 10, 000 Producers (phytoplankton) Fig. 3 -16, p. 52
Two Kinds of Primary Productivity § Gross primary productivity (GPP) § Net primary productivity (NPP) § Planet’s NPP limits number of consumers § Humans use, waste, or destroy up to 32% of NPP
Ecosystem Productivity
Terrestrial Ecosystems Swamps and marshes Tropical rain forest Temperate forest Northern coniferous forest (taiga) Savanna Agricultural land Woodland shrubland Temperate grassland Tundra (arctic and alpine) Desert scrub Extreme desert Aquatic Ecosystems Estuaries Lakes and streams Continental shelf Open ocean Fig. 3 -17, p. 53
3 -6 What Happens to Matter in an Ecosystem? § Concept 3 -6 Matter cycles within and among ecosystems and in the biosphere, and human activities are altering these chemical cycles.
Biogeochemical Cycles § Nutrient cycles § Reservoirs § Connect all organisms through time
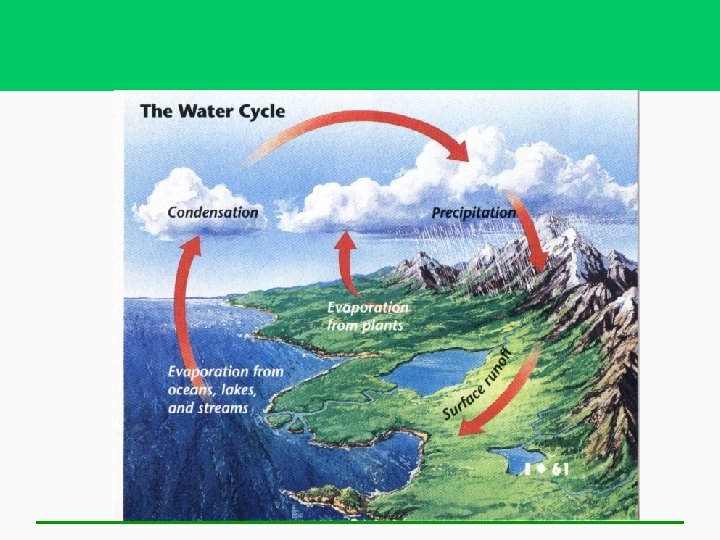
Hydrologic Cycle § Water vapor in the atmosphere comes from the oceans – 84% § Over land, ~90% of water reaching the atmosphere comes from transpiration § Only 0. 024% of earth’s water is available for human consumption
Model of the Hydrologic Cycle
Condensation Global warming Condensation Ice and snow Precipitation to land Transpiration Evaporation from plants from land Surface runoff Runoff Lakes and reservoirs Infiltration and percolation into aquifer Evaporation from ocean Reduced recharge of aquifers and flooding from covering land with crops and buildings Aquifer depletion from overpumping Precipitation to ocean Point source pollution Surface runoff Groundwater movement (slow) Increased flooding from wetland destruction Ocean Fig. 3 -18, p. 54
Science Focus: Water’s Unique Properties (1) § Holds water molecules together – hydrogen bonding § Liquid over a wide temperature range § Changes temperature slowly § Requires large amounts of energy to evaporate
Science Focus: Water’s Unique Properties (2) § Dissolves a variety of compounds § Filters out UV light from the sun § Adheres to a solid surface – hydrogen bonds § Expands as it freezes
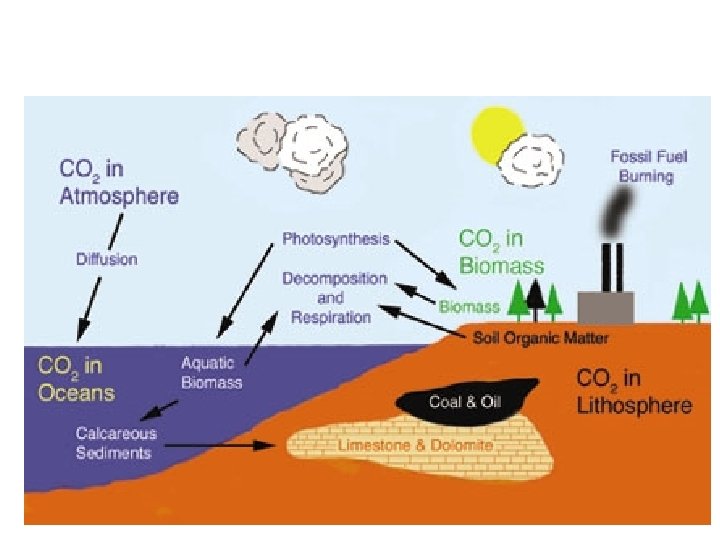
Carbon Cycle § Based on carbon dioxide (CO 2) § CO 2 makes up 0. 083% by volume of the atmosphere § Major cycle processes • Aerobic respiration • Photosynthesis • Forest fires § Fossil fuels add CO 2 to the atmosphere
Carbon dioxide in atmosphere Respiration Photosynthesis Forest fires Diffusion Animals (consumers) Burning fossil fuels Deforestation Transportation Carbon dioxide dissolved in ocean Marine food webs Producers, consumers, decomposers Carbon in limestone or dolomite sediments Respiration Plants (producers) Carbon in plants (producers) Carbon in animals (consumers) Decomposition Carbon in fossil fuels Compaction Fig. 3 -19, p. 56
383 ppm 2007; increasing at 2. 0 -2. 2 ppm/year Rate was 1. 3 ppm in 1970
By the early 1970's this curve was getting serious attention, and played a key role in launching a research program into the effect of rising CO 2 on climate. Since then, the rise has been relentless and shows a remarkably constant relationship with fossil-fuel burning, and can be well accounted for based on the simple premise that 57% of fossil-fuel emissions remain airborne. Here the number 57% was selected to fit the curve at the ends of the record, but what is significant is how well this link with fossil-fuel burning also fits the curvature in the record, sloping upwards less rapidly at the beginning, and more rapidly at the end. << Prev - Next >> http: //scrippsco 2. ucsd. edu/program_history/keeling_curve_lessons. html
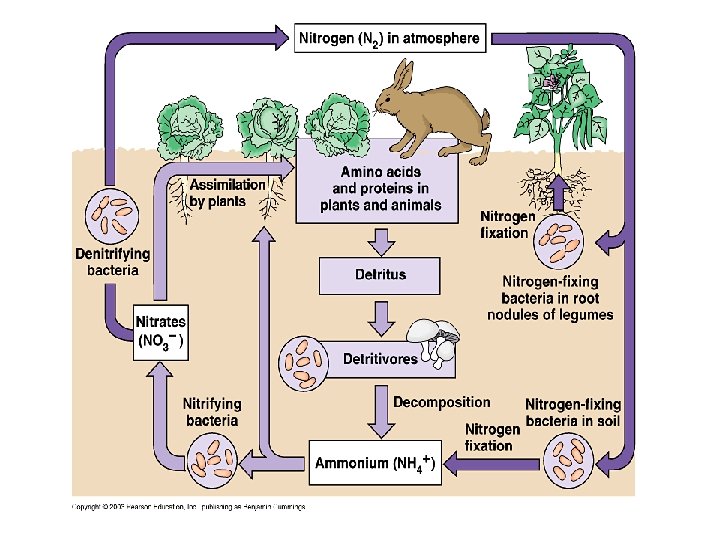
Nitrogen Cycle § Multicellular plants and animals cannot utilize atmospheric nitrogen (N 2) § Nitrogen-fixation § Nitrification § Ammonification § Denitrification
Nitrogen in atmosphere Denitrification by bacteria Electrical storms Nitrogen oxides from burning fuel Nitrates from fertilizer runoff and decomposition Volcanic activity Nitrogen in animals (consumers) Nitrification by bacteria Nitrogen in plants (producers) Decomposition Uptake by plants Nitrate in soil Nitrogen loss to deep ocean sediments Nitrogen in ocean sediments Bacteria Ammonia in soil Fig. 3 -20, p. 57
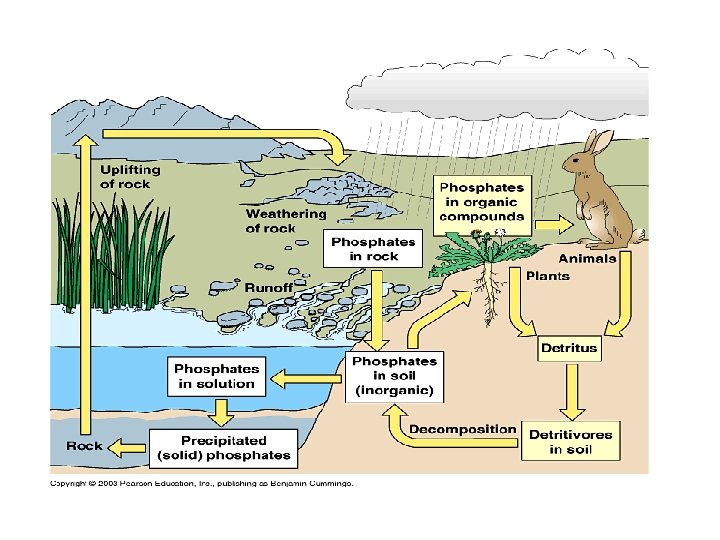
Phosphorus Cycle § Does not cycle through the atmosphere § Obtained from terrestrial rock formations § Limiting factor on land in freshwater ecosystems § Biologically important for producers and consumers
Phosphates in sewage Phosphates in mining waste Fertilizer phosphates Runoff Sea birds Runoff Erosion Animals (consumers) Phosphate dissolved in water Plants (producers) Plate tectonics Phosphate in rock (fossil bones, guano) Phosphate in shallow ocean sediments Ocean food chain Phosphate in deep ocean sediments Bacteria Fig. 3 -21, p. 58
3 -7 How Do Scientists Study Ecosystems? § Concept 3 -7 Scientists use field research, laboratory research, and mathematical and other models to learn about ecosystems.
Field Research § Collecting data in the field by scientists § Remote sensing devices § Geographic information systems (GIS)
Schindler’s Lakes - Canada
Remote Sensing Fig. 3 -22, p. 60
Geographic Information System (GIS)
Critical nesting site locations Habitat type Land ownership Wetlands Zoning Topography Real world Fig. 3 -23, p. 60
Laboratory Research § Simplified model ecosystems • • Culture tubes Bottles Greenhouses Chambers with controllable abiotic factors
Scientific Studies of Ecosystems § Models • Mathematical • Computer simulations § Models need to be fed real data collected in the field
Baseline Data to Measure Earth’s Health § Needed to measure changes over time § Lacking for many ecosystems § Call for massive program to develop baseline data
Animation: Levels of organization
Animation: Linked Processes
Animation: Feedback Control of Temperature
Animation: Diet of a Red Fox
Animation: Prairie Trophic Levels
Animation: Rainforest Food Web
Animation: Energy Flow in Silver Springs
Animation: Biomes Map
Animation: Prairie Food Web
Animation: Gause’s Competition Experiment
Animation: Visible Light
Animation: Energy Flow
Animation: Roles of Organisms in an Ecosystem
Animation: Matter Recycling and Energy Flow
Animation: Current and Projected Population Sizes by Region
Animation: Demographic Transition Model
Animation: Soil Profile
Animation: Species Diversity By Latitude
Animation: Area and Distance Effects
Animation: Linked Processes
Animation: Categories of Food Webs
Animation: Hydrologic Cycle
Animation: Carbon Cycle
Animation: Nitrogen Cycle
Animation: Phosphorous Cycle
Animation: Sulfur Cycle
Animation: Capture-Recapture Method