Theory of Production and cost Week 4 Theory


 Cost of Total")


- Slides: 18
Theory of Production and cost Week 4
Theory of Production and Cost Short and Long run production functions Behavior of Costs Law of Diminishing Returns Law of Returns to scale in theory of production Fixed Costs and Variable Costs Explicit Costs and Implicit Costs
What are Costs? “The Market Value of the inputs a firm uses in production” Total Revenue – the amount a firm receives for the sale of its outputs. Eg: Each Ice-Cream takes Rs. 10 to make and it is sold at Rs. 25 – Nelum sells 2000 ice-creams You know you're getting old when the candles cost more than the cake. Bob Hope
Economic Cost This is different to accounting cost What is accounting cost? Remember Nelum? – She made Rs. 30000 profit making ice-cream. Assume Nelum was an amazing programmer and she could earn Rs. 80000 a month programming. Her Opportunity cost = 80000 – 30000 = Rs. 50000 Which means she is losing Rs 50000 by making icecream.
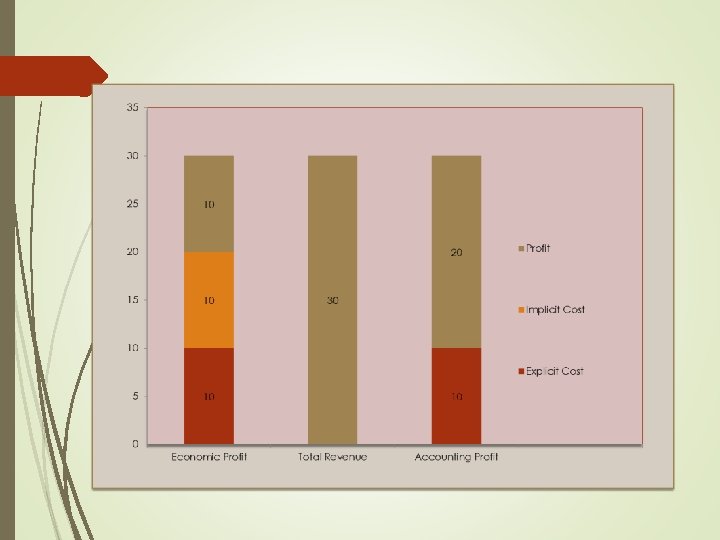
Implicit and Explicit Costs – input costs that require an outlay of money by the firm. Implicit costs – input costs that do not require an outlay of money by the firm. Accounting Profit = TR – Explicit Costs Economic Profit = TR – (Implicit Costs+ Explicit Costs) No other investment yields as great a return as the investment in education. An educated workforce is the foundation of every community and the future of every economy. Brad Henry
The production functions Two Assumptions Short Run Size of Nelum’s factory is fixed She can only vary the amount of ice-cream by increasing workers Long run – She can build a new factory. The production function The relationship between the quantity of inputs used to make a good and he quantity of outputs for that good.
Output per Marginal Hour product of labour Cost of factory (FC) Cost of Total Cost workers (VC) Number of Workers 0 0 0 30 1 50 50 30 10 40 2 90 40 30 20 50 3 120 30 30 30 60 4 140 20 30 40 70 5 150 10 30 50 80 6 155 5 30 60 90
Production Function Output per Hour 6, 155 5, 150 4, 140 3, 120 2, 90 1, 50 0, 0 0 1 2 3 4 5 6 7
Total Cost Curve Marginal Product The increase in output that arises from an additional unit of output Diminishing Marginal Product The property whereby the marginal product of an input declines as the quantity of the input increases.
Total Cost 100 90 80 70 60 50 Total Cost 40 30 20 10 0 0 20 40 60 80 100 120 140 160 180
Fixed and Variable Costs Fixed Costs that do not vary with the quantity of output produced Variable Costs that vary with the quantity of output produced. Average Total Cost – Total cost divided by the quantity of output Average Fixed Cost – Fixed cost divided by the quantity of output Average Variable Cost – Variable cost divided by the quantity of output Marginal Cost – The increase in total cost that arises from an extra unit of production.
Cups Per Total Hour Cost Fixed Cost Variable Average Cost Fixed Cost Average Variable Cost Average Marginal Total Cost 0 300 0 0 1 330 300 30 330 2 380 300 80 150 40 190 3 450 300 150 100 50 150 4 540 300 240 75 60 135 5 650 300 350 60 70 130 6 780 300 480 50 80 130 7 930 300 630 43 90 133 8 1100 300 800 38 100 138 9 1290 300 990 33 110 143 10 1500 300 1200 30 120 150
350 300 250 200 150 100 50 0 0 1 2 3 4 Average Fixed Cost Average Total Cost 5 6 7 8 9 10 Average Variable Cost
Observations Rising Marginal Cost MC rises with the quantity of out produced. This reflects the property of diminishing marginal product. U-Shaped Average Total Cost Average fixed costs always reduces Average variable costs typically rises as output increases because of diminishing marginal product The bottom of the U shaped curve occurs at the quantity that minimizes average total cost
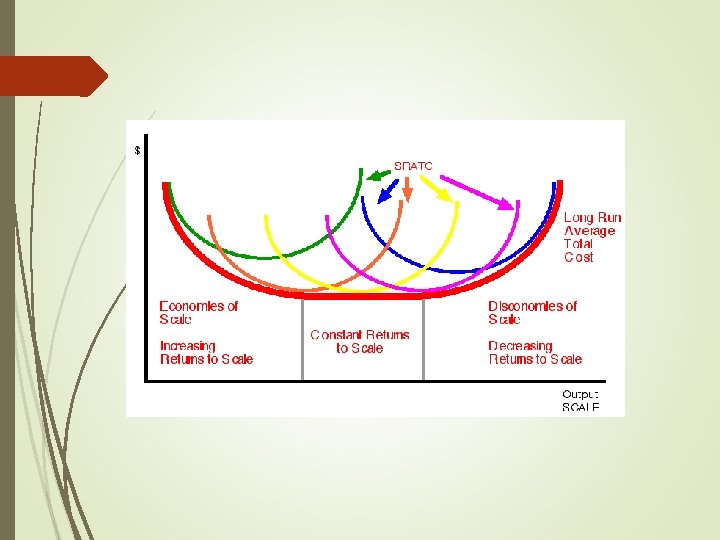
Long run costs curves In the short term you cannot increase the number of factories, only the number of workers In the long run this is not an issue. Economies of Scale – (Specialization) – When long run average total costs falls as the quantity of output increases Diseconomies of Scale – (Coordination Issue) – When LRATC increase as the output increases Constant returns of scale – When LRATC stays the same as the quantity of output changes.
Break Time!