THE ROLE OF ELECTRICAL ANHARMONICITY IN DETERMINING INTENSITY

- Slides: 20
THE ROLE OF ELECTRICAL ANHARMONICITY IN DETERMINING INTENSITY IN − 1 THE 2100 cm REGION OF THE WATER SPECTURM Ohio State (Current and recent): Laura Dzugan Jason Ford Meng Huang Zhou Lin Bernice Opoku-Agyeman. Andrew Petit Experimental Collaborators: Mark Johnson 69 th International Symposium on Molecular Spectroscopy, June 2014 Samantha Horvath Melanie Marlett Bethany Wellen
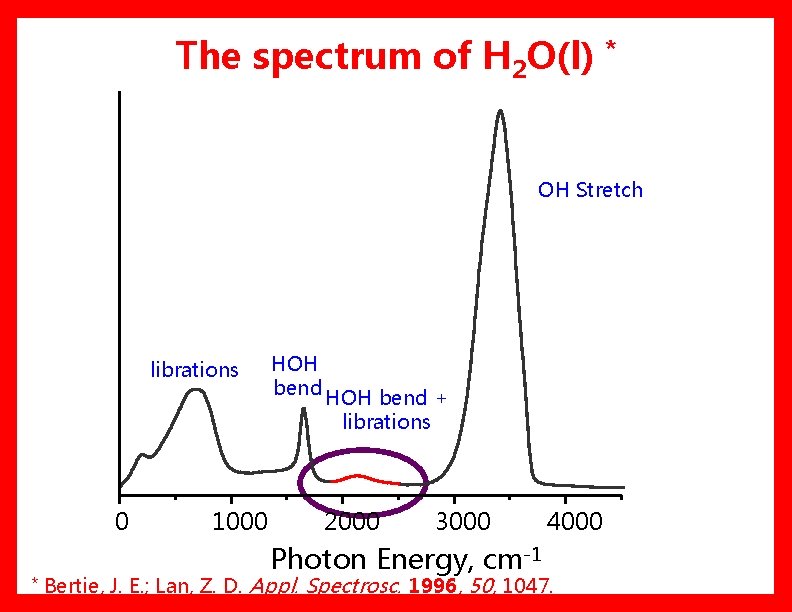
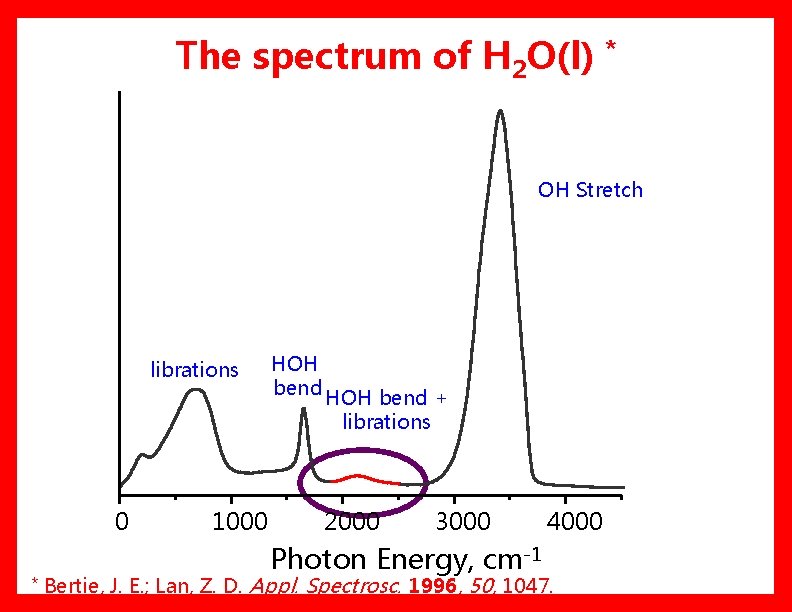
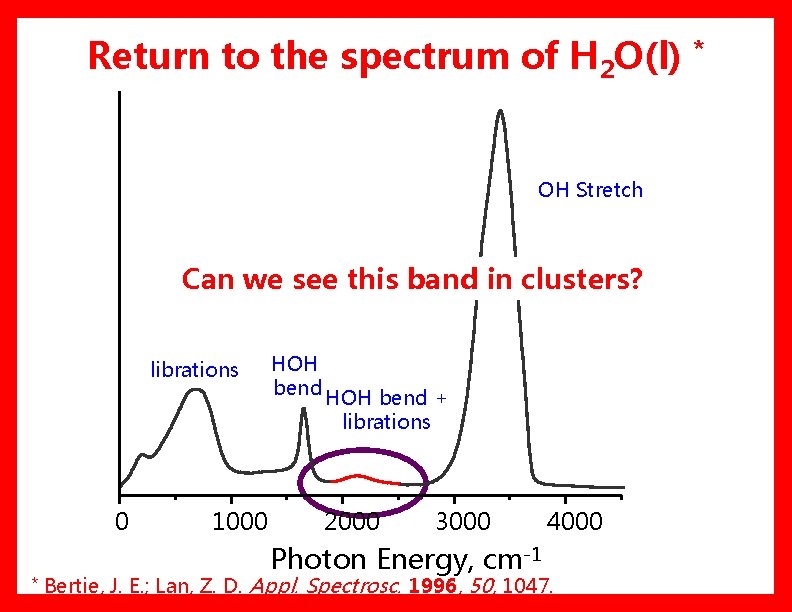
The spectrum of H 2 O(l) * OH Stretch librations 0 * 1000 HOH bend + librations 2000 3000 Photon Energy, cm-1 4000 Bertie, J. E. ; Lan, Z. D. Appl. Spectrosc. 1996, 50, 1047.
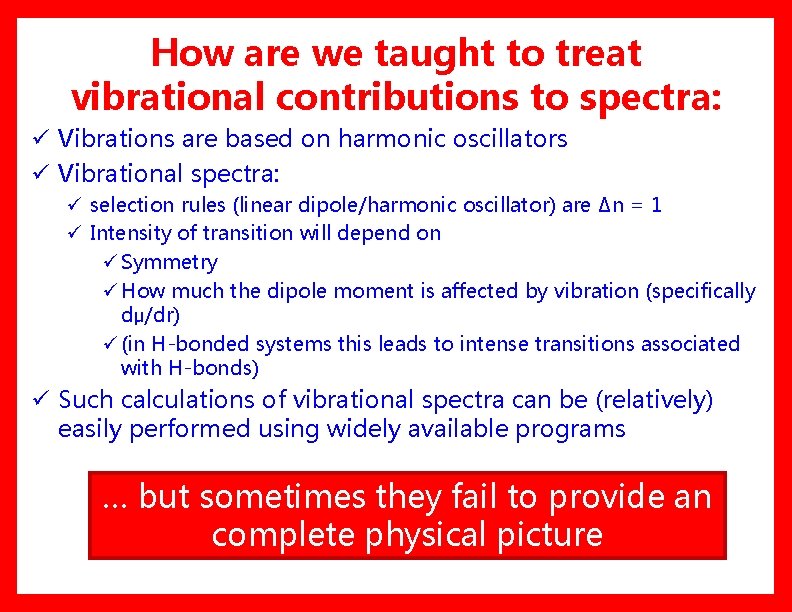
How are we taught to treat vibrational contributions to spectra: ü Vibrations are based on harmonic oscillators ü Vibrational spectra: ü selection rules (linear dipole/harmonic oscillator) are Δn = 1 ü Intensity of transition will depend on ü Symmetry ü How much the dipole moment is affected by vibration (specifically dμ/dr) ü (in H-bonded systems this leads to intense transitions associated with H-bonds) ü Such calculations of vibrational spectra can be (relatively) easily performed using widely available programs … but sometimes they fail to provide an complete physical picture
The spectrum of H 2 O(l) * OH Stretch librations 0 * 1000 HOH bend + librations 2000 3000 Photon Energy, cm-1 4000 Bertie, J. E. ; Lan, Z. D. Appl. Spectrosc. 1996, 50, 1047.
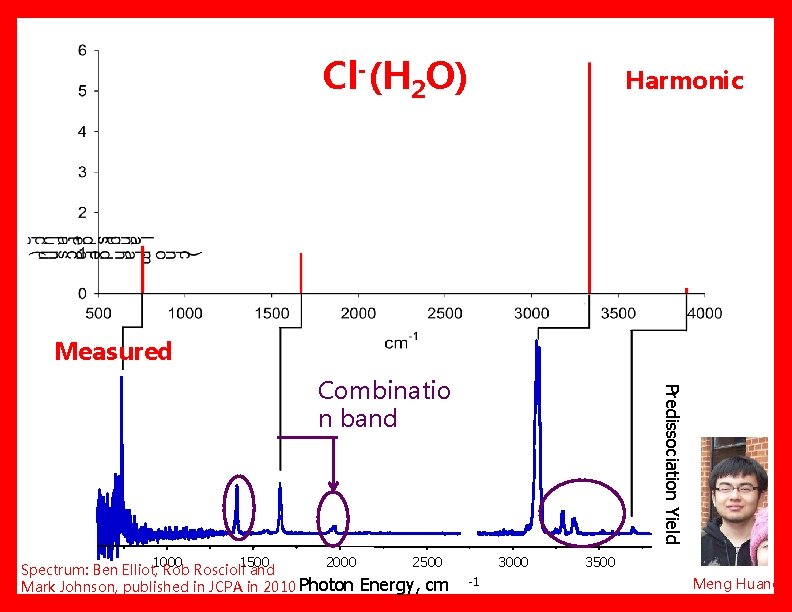
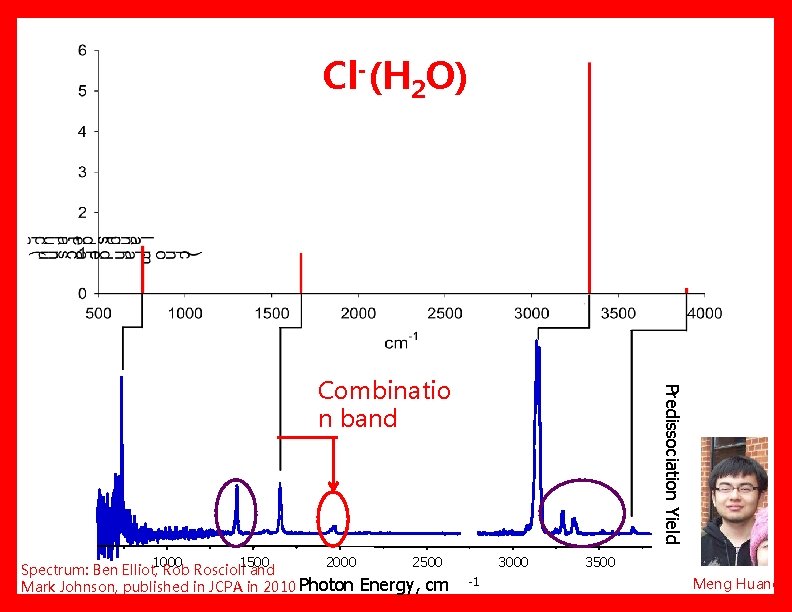
Cl-(H 2 O) Harmonic Measured 1000 1500 2000 2500 Spectrum: Ben Elliot, Rob Roscioli and Mark Johnson, published in JCPA in 2010 Photon Energy, cm Predissociation Yield Combinatio n band 3000 -1 3500 Meng Huang
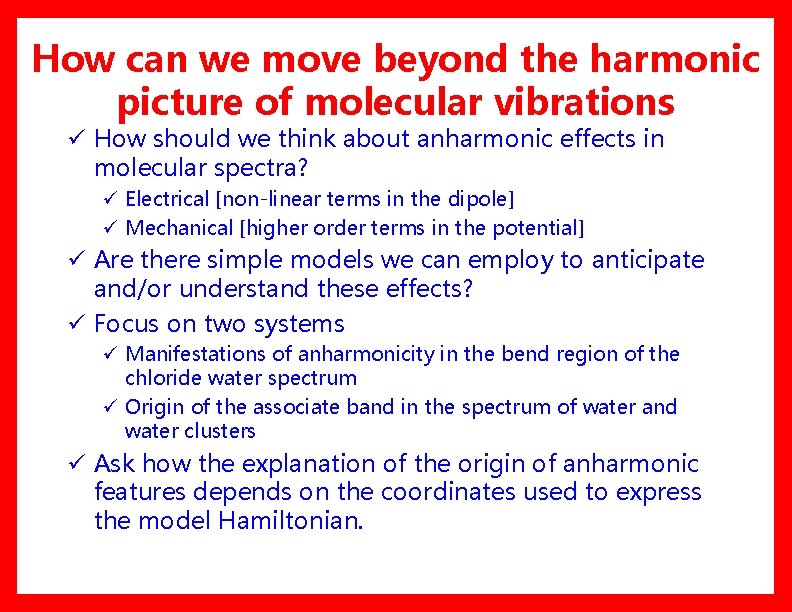
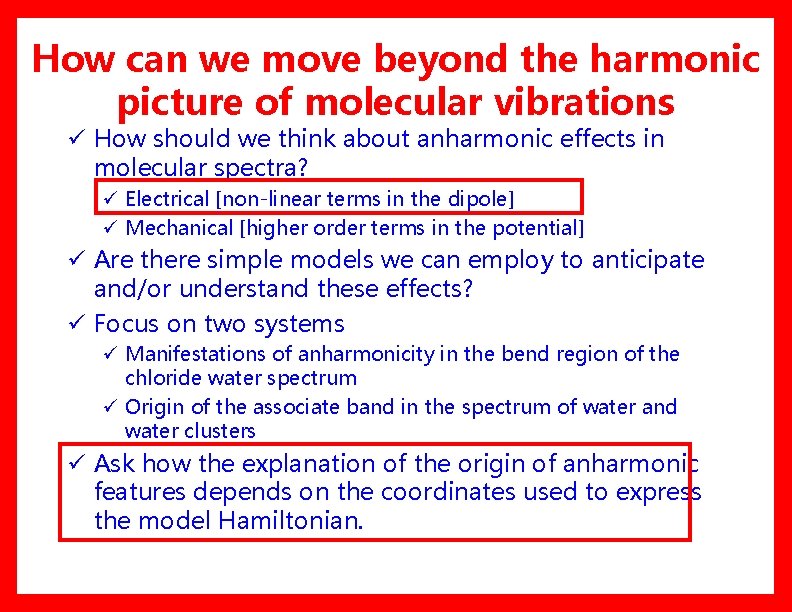
How can we move beyond the harmonic picture of molecular vibrations ü How should we think about anharmonic effects in molecular spectra? ü Electrical [non-linear terms in the dipole] ü Mechanical [higher order terms in the potential] ü Are there simple models we can employ to anticipate and/or understand these effects? ü Focus on two systems ü Manifestations of anharmonicity in the bend region of the chloride water spectrum ü Origin of the associate band in the spectrum of water and water clusters ü Ask how the explanation of the origin of anharmonic features depends on the coordinates used to express the model Hamiltonian.
How can we move beyond the harmonic picture of molecular vibrations ü How should we think about anharmonic effects in molecular spectra? ü Electrical [non-linear terms in the dipole] ü Mechanical [higher order terms in the potential] ü Are there simple models we can employ to anticipate and/or understand these effects? ü Focus on two systems ü Manifestations of anharmonicity in the bend region of the chloride water spectrum ü Origin of the associate band in the spectrum of water and water clusters ü Ask how the explanation of the origin of anharmonic features depends on the coordinates used to express the model Hamiltonian.
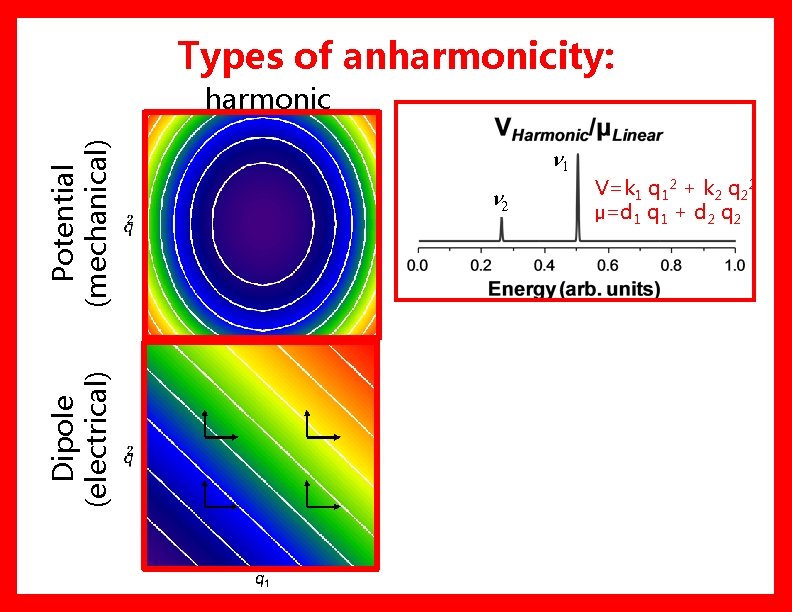
Types of anharmonicity: Dipole (electrical) Potential (mechanical) harmonic n 1 n 2 V=k 1 q 12 + k 2 q 22 μ=d 1 q 1 + d 2 q 2
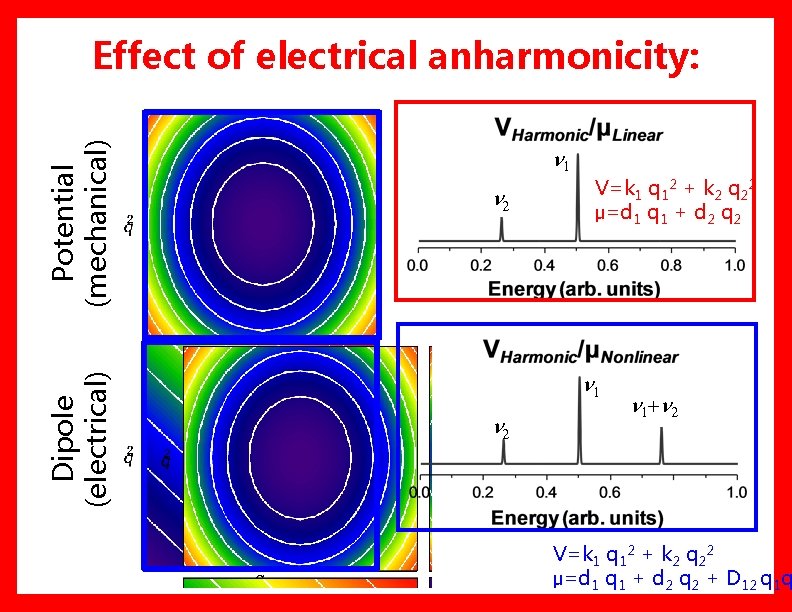
Dipole (electrical) Potential (mechanical) Effect of electrical anharmonicity: n 1 n 2 V=k 1 q 12 + k 2 q 22 μ=d 1 q 1 + d 2 q 2 n 1 n 2 n 1+n 2 V=k 1 q 12 + k 2 q 22 μ=d 1 q 1 + d 2 q 2 + D 12 q 1 q
Cl-(H 2 O) 1000 1500 2000 2500 Spectrum: Ben Elliot, Rob Roscioli and Mark Johnson, published in JCPA in 2010 Photon Energy, cm Predissociation Yield Combinatio n band 3000 -1 3500 Meng Huang
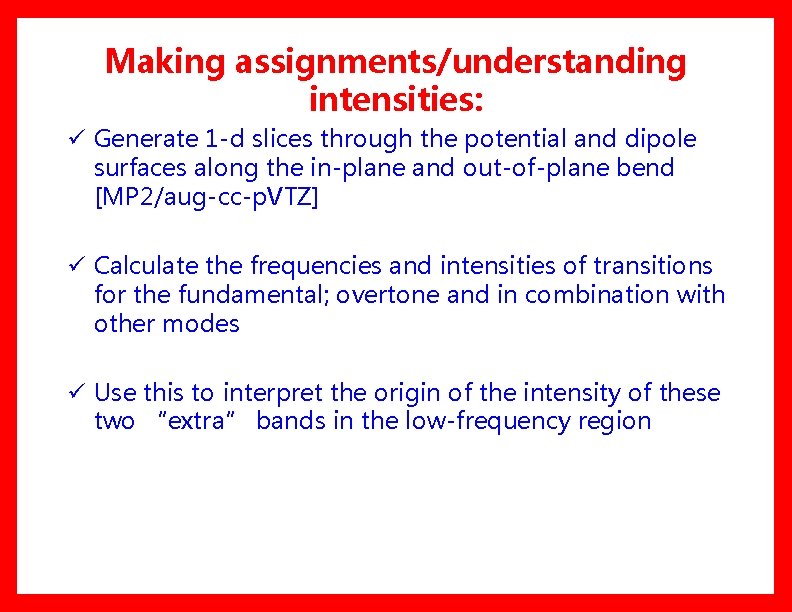
Making assignments/understanding intensities: ü Generate 1 -d slices through the potential and dipole surfaces along the in-plane and out-of-plane bend [MP 2/aug-cc-p. VTZ] ü Calculate the frequencies and intensities of transitions for the fundamental; overtone and in combination with other modes ü Use this to interpret the origin of the intensity of these two “extra” bands in the low-frequency region
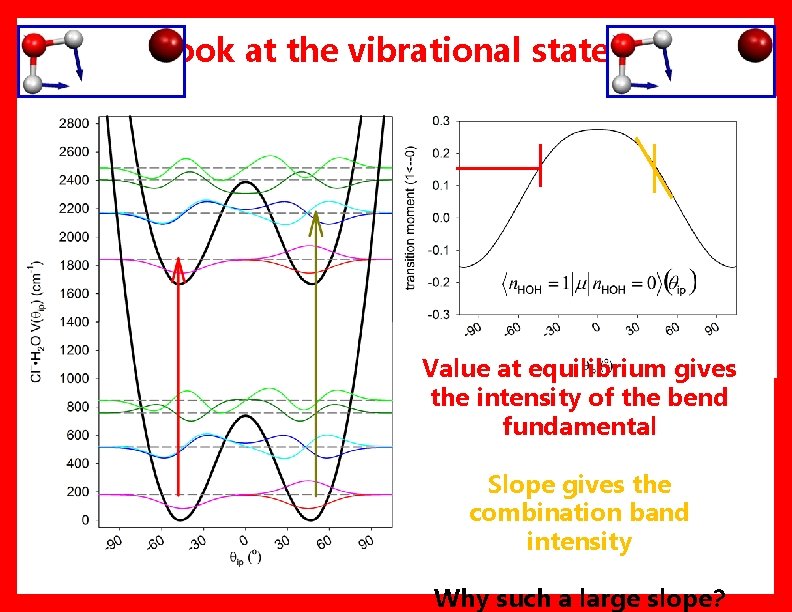
Look at the vibrational states: Value at equilibrium gives the intensity of the bend fundamental Slope gives the combination band intensity Why such a large slope?
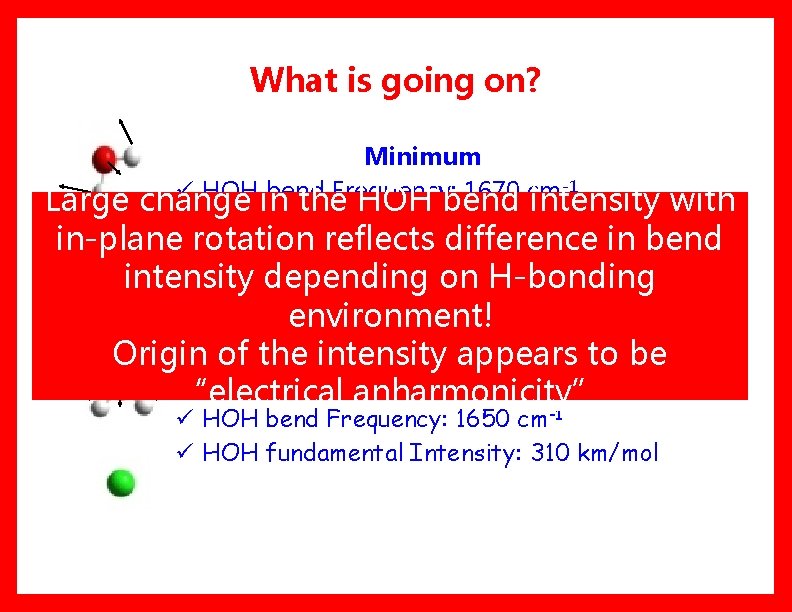
What is going on? Minimum ü HOH bend Frequency: 1670 cm-1 change in the HOH bend intensity with ü HOH fundamental Intensity: 100 km/mol Large in-plane rotation reflects difference in bend intensity depending on H-bonding environment! Origin of the intensity appears to be Transition State “electrical anharmonicity” ü HOH bend Frequency: 1650 cm-1 ü HOH fundamental Intensity: 310 km/mol
Return to the spectrum of H 2 O(l) * OH Stretch Can we see this band in clusters? librations 0 * 1000 HOH bend + librations 2000 3000 Photon Energy, cm-1 4000 Bertie, J. E. ; Lan, Z. D. Appl. Spectrosc. 1996, 50, 1047.
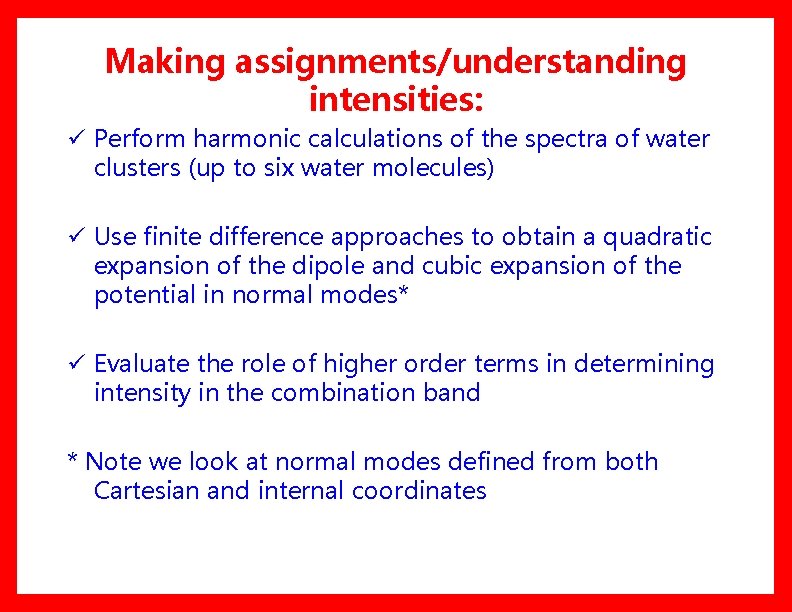
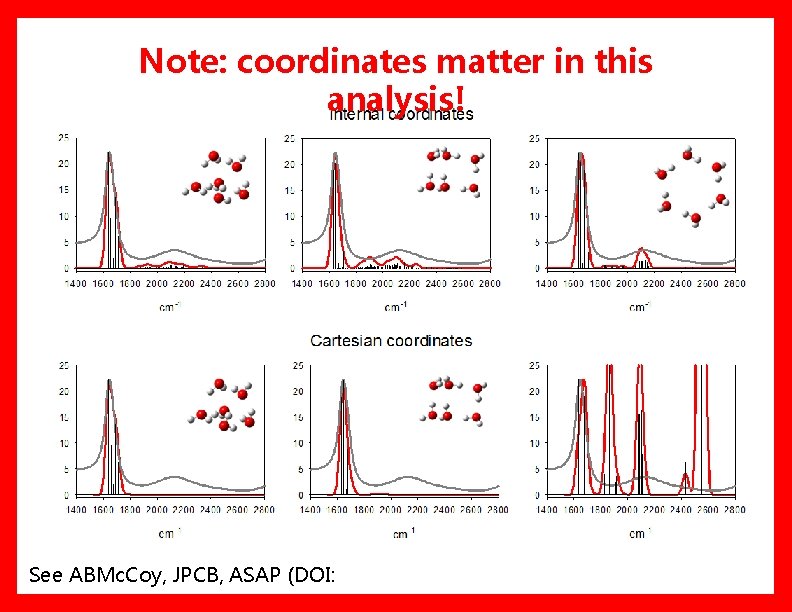
Making assignments/understanding intensities: ü Perform harmonic calculations of the spectra of water clusters (up to six water molecules) ü Use finite difference approaches to obtain a quadratic expansion of the dipole and cubic expansion of the potential in normal modes* ü Evaluate the role of higher order terms in determining intensity in the combination band * Note we look at normal modes defined from both Cartesian and internal coordinates
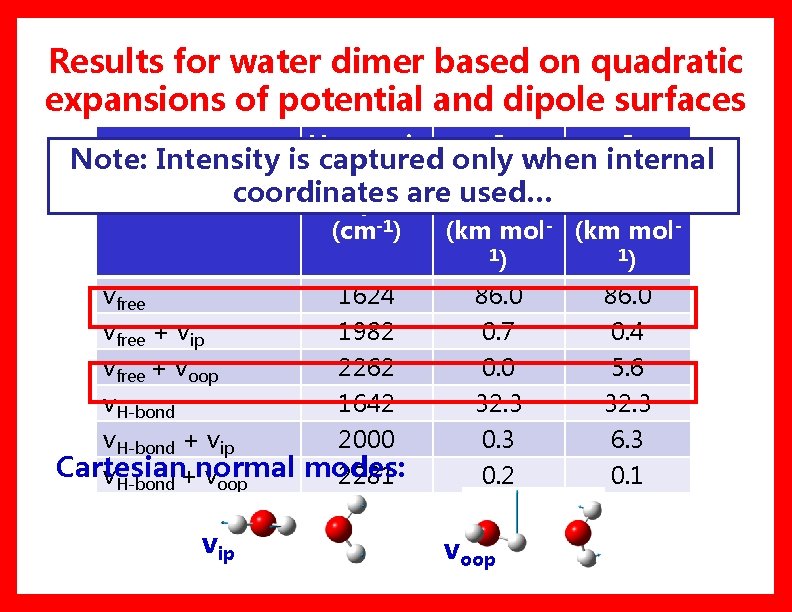
Results for water dimer based on quadratic expansions of potential and dipole surfaces Harmonic I I Note: Intensity is captured only when internal Frequenc (Cartesia (Internal State coordinates are used… y n) s) (cm-1) (km mol- (km mol 1) 1) vfree 1624 vfree + vip 1982 vfree + voop 2262 v. H-bond 1642 v. H-bond + vip 2000 Cartesian normal modes: v. H-bond + voop 2281 vip 86. 0 0. 7 0. 0 32. 3 0. 2 voop 86. 0 0. 4 5. 6 32. 3 6. 3 0. 1
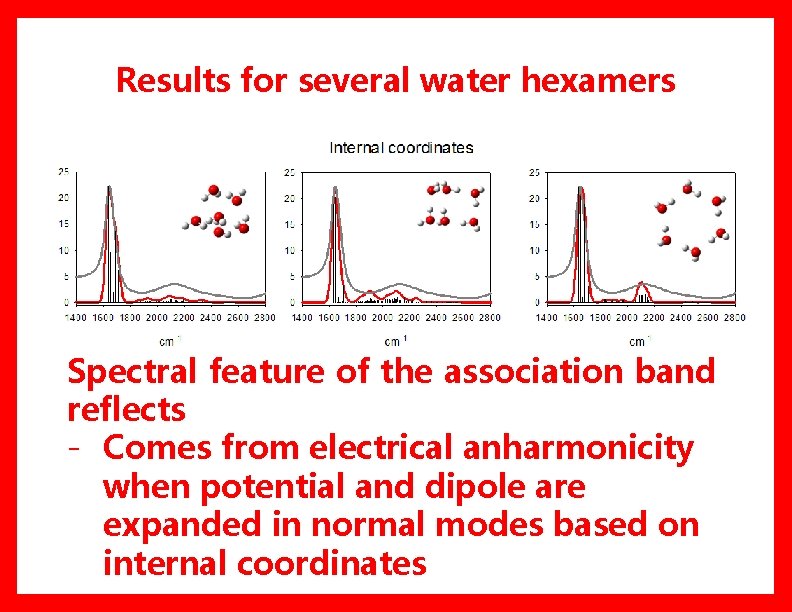
Results for several water hexamers Spectral feature of the association band reflects - Comes from electrical anharmonicity when potential and dipole are expanded in normal modes based on internal coordinates
Note: coordinates matter in this analysis! See ABMc. Coy, JPCB, ASAP (DOI:
Outlooks and challenges ü When we think about vibrational spectra of “floppy” systems we need to be aware of the prevalence of unexpected features that are not anticipated by harmonic pictures. ü These can reflect both electrical and mechanical anharmonicity ü Despite the large amplitude, often we can interpret the features through reduced dimensional pictures ü The origins of the “association band” in the water spectrum are assigned to the electrical anharmonicity (non-condon effects) ü This picture will depend on the choice of coordinates used for the expansion ü While full-dimensional results will be independent of this choice, the internal coordinates provide the more rapidly converging expansion of the potential and dipole surfaces
Acknowledgements: Experiment Mark Johnson (Yale) Tim Guasco Chris Leavitt Chris Johnson and the rest of the Johnson Lab RECENT GRADUATES: Samantha Horvath Andrew Petit Laura Dzugan Jason Ford Meng Huang Zhou Lin Funding: NSF Bernice Opoku- Menanie Marlett Agyeman