The New Content Management System of Statistics Finland


- Slides: 18
The New Content Management System of Statistics Finland Juhani Kauppo Nordic Web Meeting 23. 4. 2020 27 November 2020 Statistics Finland 1
What is happening with Statistics Finland’s website and related systems? • Statistics Finland is updating the core statistics publishing process and the related parts of the website during 2020 • Automation, efficiency and reliability of the publishing process are key goals • Flexibility and reusability of content are other goals • The new content model, process and systems will only cover the core publishing process during 2020, rest of the website, it’s content and publishing process will be moved to the new content management system (CMS) in the next 1 -3 years after 2020 27 November 2020 Statistics Finland 2
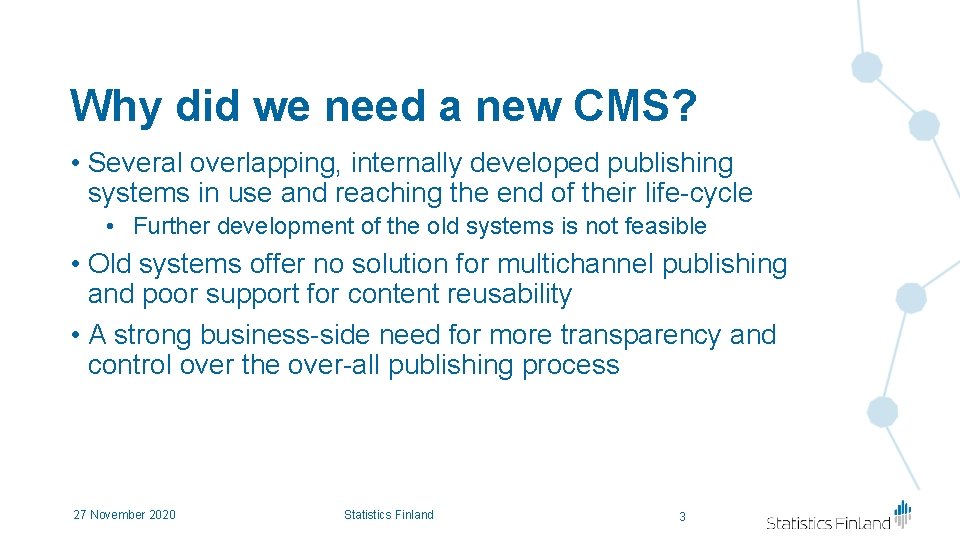
Why did we need a new CMS? • Several overlapping, internally developed publishing systems in use and reaching the end of their life-cycle • Further development of the old systems is not feasible • Old systems offer no solution for multichannel publishing and poor support for content reusability • A strong business-side need for more transparency and control over the over-all publishing process 27 November 2020 Statistics Finland 3
Graph. CMS – Our new Content Management System • Graph. QL native headless CMS provided using Software as a Service model • API-first thinking: no restricting templates or limitations on publishing formats/channels • Frontend agnostic: not tied in with any frameworks & content creation possible in parallel to frontend development • Content modelled as graphs • No built-in hierarchies in the model • More flexibility and possibilities for content reuse, but the resulting content model is more complex 27 November 2020 Statistics Finland 4
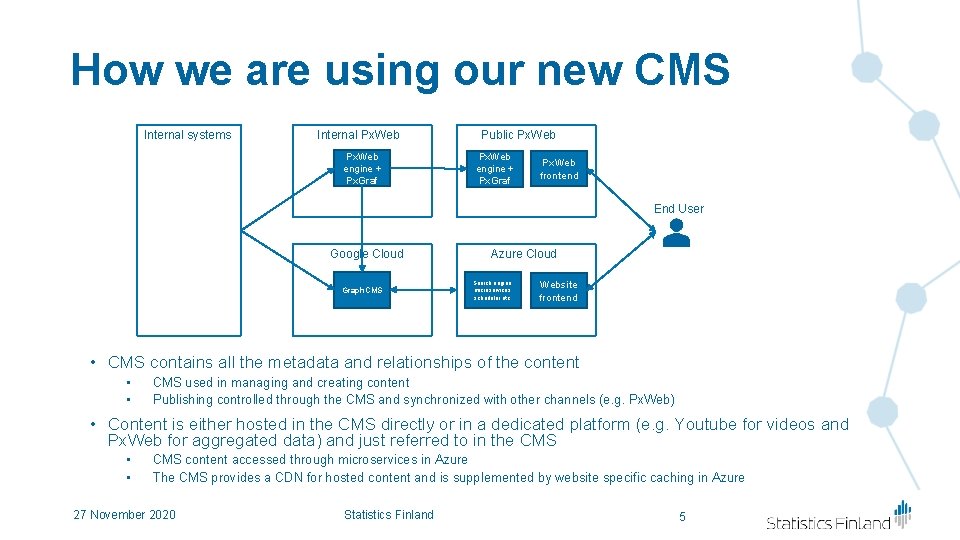
How we are using our new CMS Internal systems Internal Px. Web engine + Px. Graf Public Px. Web engine + Px. Graf Px. Web frontend End User Google Cloud Graph. CMS Azure Cloud Search engine, microservices, scheduler etc. Website frontend • CMS contains all the metadata and relationships of the content • • CMS used in managing and creating content Publishing controlled through the CMS and synchronized with other channels (e. g. Px. Web) • Content is either hosted in the CMS directly or in a dedicated platform (e. g. Youtube for videos and Px. Web for aggregated data) and just referred to in the CMS • • CMS content accessed through microservices in Azure The CMS provides a CDN for hosted content and is supplemented by website specific caching in Azure 27 November 2020 Statistics Finland 5
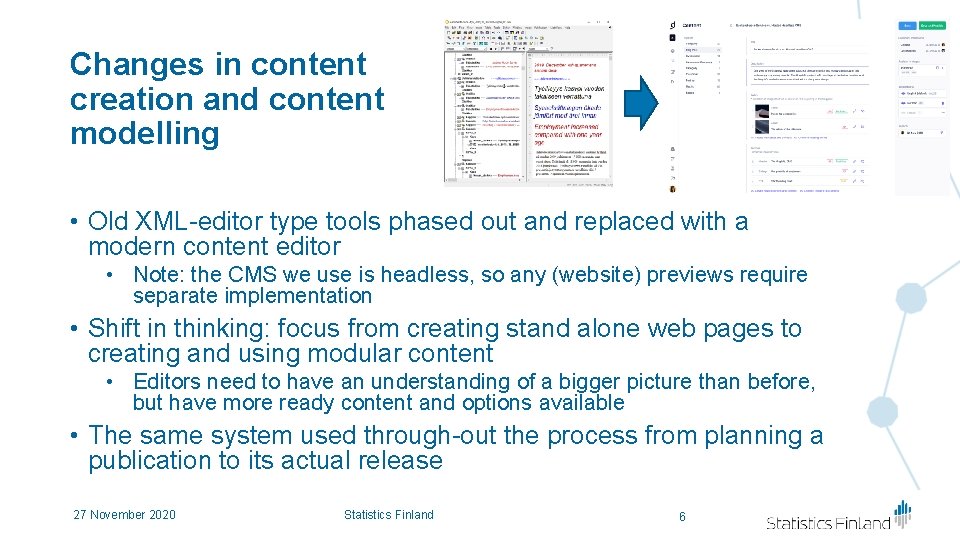
Changes in content creation and content modelling • Old XML-editor type tools phased out and replaced with a modern content editor • Note: the CMS we use is headless, so any (website) previews require separate implementation • Shift in thinking: focus from creating stand alone web pages to creating and using modular content • Editors need to have an understanding of a bigger picture than before, but have more ready content and options available • The same system used through-out the process from planning a publication to its actual release 27 November 2020 Statistics Finland 6
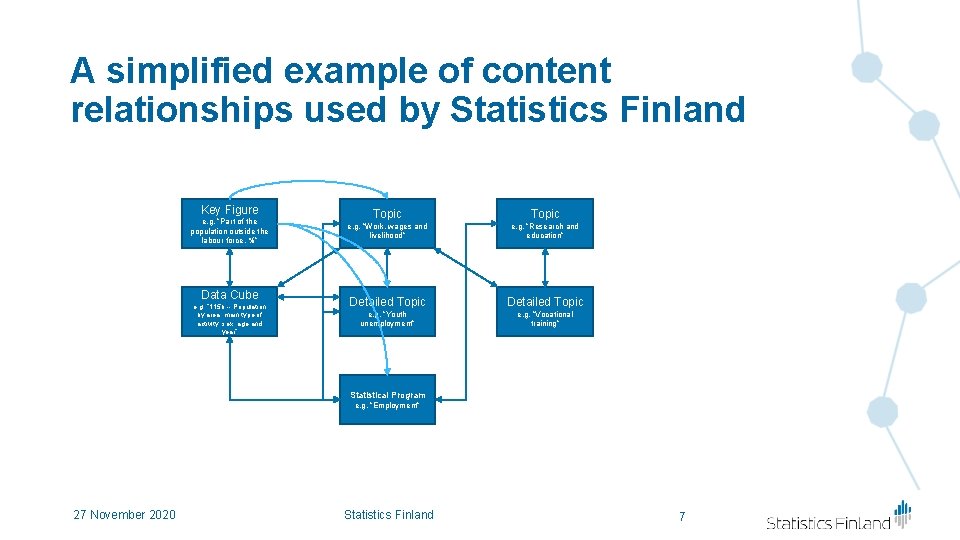
A simplified example of content relationships used by Statistics Finland Key Figure e. g. ”Part of the population outside the labour force, %” Data Cube e. g. ” 115 b -- Population by area, main type of activity, sex, age and year” Topic e. g. ”Work, wages and livelihood” e. g. ”Research and education” Detailed Topic e. g. ”Youth unemployment” e. g. ”Vocational training” Statistical Program e. g. ”Employment” 27 November 2020 Statistics Finland 7
New possibilities in publishing • Webhooks give the ability to subscribe to CMS events • Publishing an article may, for example, automatically trigger search engine indexing, archiving, RSS-feeds or ”alerts” to endusers • Creating and publishing separate content for other channels (such as social media or services with their own sites) is not required • Higher metadata quality opens up possibilities for new services that were previously unfeasible due to extra work 27 November 2020 Statistics Finland 8
The Px. Graf module connected to Px. Web 27 November 2020 Statistics Finland 9
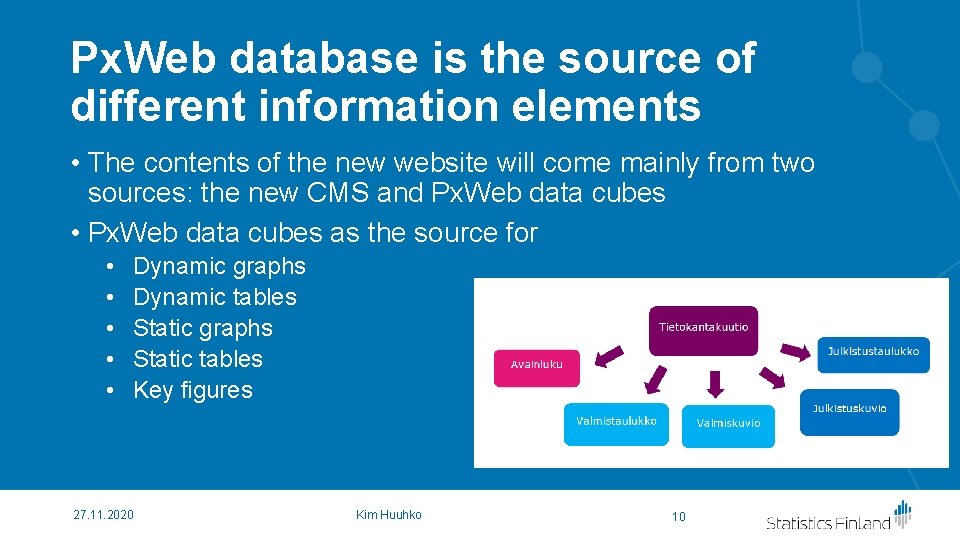
Px. Web database is the source of different information elements • The contents of the new website will come mainly from two sources: the new CMS and Px. Web data cubes • Px. Web data cubes as the source for • • • Dynamic graphs Dynamic tables Static graphs Static tables Key figures 27. 11. 2020 Kim Huuhko 10
Px. Graf generates several graph/table types • Traditional graph vs. browsable graph • Browsable graph/table contains as though several graphs/ tables – the end user can browse the values of the variables and choose the table/graph according his/her selections • Traditional graph - the user will see only one ready made graph • Dynamic graph vs. static graph • Graph/table can be dynamic – it will automatically be updated when the Px. Web datacube is updated • Graph/table can also be static – it will be frozen to the state of publishing date • Browsable graphs/tables can also be frozen 27. 11. 2020 Kim Huuhko 11
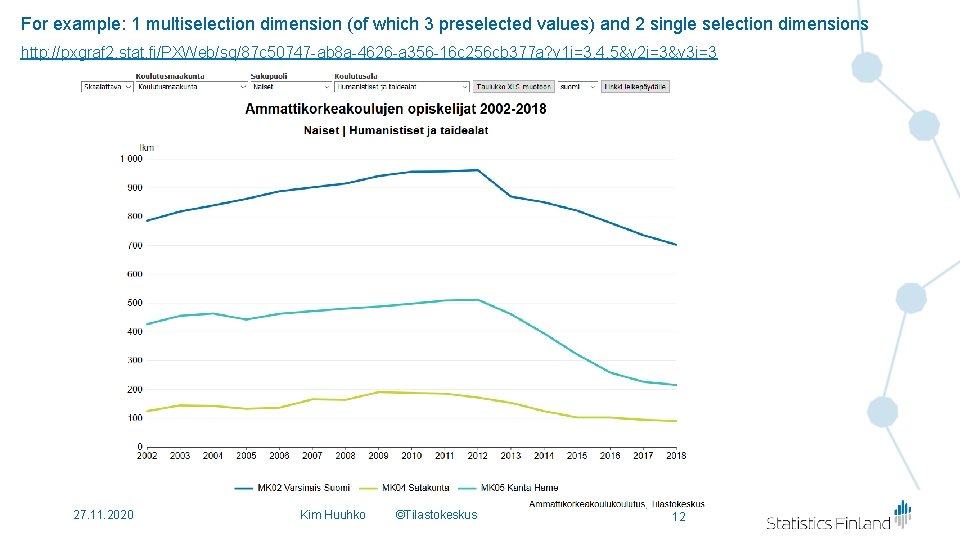
For example: 1 multiselection dimension (of which 3 preselected values) and 2 single selection dimensions http: //pxgraf 2. stat. fi/PXWeb/sq/87 c 50747 -ab 8 a-4626 -a 356 -16 c 256 cb 377 a? v 1 i=3, 4, 5&v 2 i=3&v 3 i=3 27. 11. 2020 Kim Huuhko ©Tilastokeskus 12
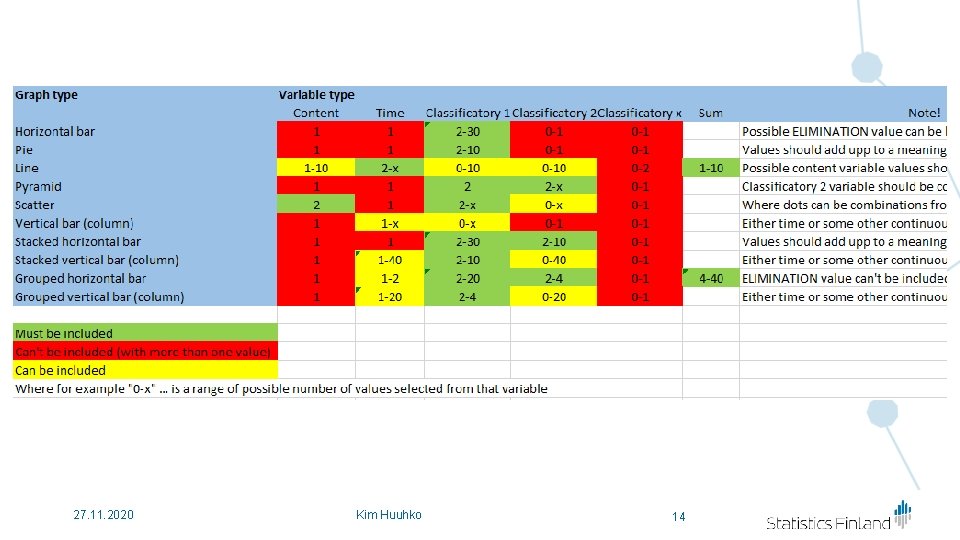
In-built intelligence • Data extract can always be presented in a table format. . . and in SOME CASES also as a graph. . . and in SOME CASES in several different optional graph types • Intelligent graph component recognizes right presentation methods for data in question • Based on VARIABLE-TYPE definitions and number of selected variables and their values • If time and content variables are not defined in px table, they are inquired from user • Single selected values are omitted from the pivoting (and underlying table structure) and placed to the title instead • Data is automatically pivoted for a right layout in charts 27 November 2020 Kim Huuhko 13
27. 11. 2020 Kim Huuhko 14
Two ways to use Px. Graf • Intelligent graph component • Graphical data output • Recognizes right presentation methods from data, doesn’t allow bad visualizations • Target group: End users • Graph engine • Tool to generate all kinds of data outputs for end users • Possible to create masses of graphs and tables with just one definition (easy to create and maintain) • url-parameters in web-service determine the outcome • type= screen, embed, filed, scroll • format=png, svg, html, xls • Many ways to re-define data selection: • Index position: e. g. 6 th value from variable 1 • Code: e. g. value with code ”SSS” from variable 2 • Target group: Service developers 27 November 2020 Kim Huuhko 15
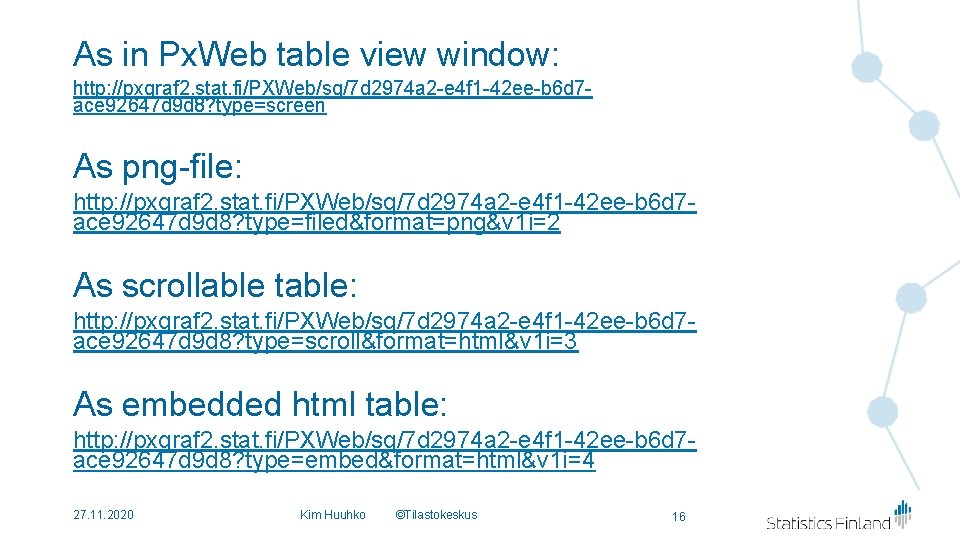
As in Px. Web table view window: http: //pxgraf 2. stat. fi/PXWeb/sq/7 d 2974 a 2 -e 4 f 1 -42 ee-b 6 d 7 ace 92647 d 9 d 8? type=screen As png-file: http: //pxgraf 2. stat. fi/PXWeb/sq/7 d 2974 a 2 -e 4 f 1 -42 ee-b 6 d 7 ace 92647 d 9 d 8? type=filed&format=png&v 1 i=2 As scrollable table: http: //pxgraf 2. stat. fi/PXWeb/sq/7 d 2974 a 2 -e 4 f 1 -42 ee-b 6 d 7 ace 92647 d 9 d 8? type=scroll&format=html&v 1 i=3 As embedded html table: http: //pxgraf 2. stat. fi/PXWeb/sq/7 d 2974 a 2 -e 4 f 1 -42 ee-b 6 d 7 ace 92647 d 9 d 8? type=embed&format=html&v 1 i=4 27. 11. 2020 Kim Huuhko ©Tilastokeskus 16
Future plans • Px. Graf generates the tables and graphs to the new web service of Statistics Finland • We hope Px. Graf would be an integral part of the official Px. Web xxxx/xx? 27 November 2020 Kim Huuhko 17
Thank you Juhani Kauppo (juhani. kauppo@stat. fi) Markku Huttunen (markku. huttunen@stat. fi) Kim Huuhko (kim. huuhko@stat. fi ) 27 November 2020 Statistics Finland 18