The Life Cycle of Stars The Life Cycle


- Slides: 15

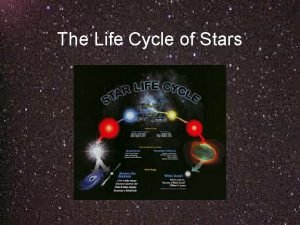
The Life Cycle of Stars

The Life Cycle of Stars “protostar”

The Life Cycle of Stars “protostar” “Main Sequence” (longest phase in a star’s cycle

The Life Cycle of Stars “protostar” “Main Sequence” “Red Giant”

The Life Cycle of Stars “protostar” “Main Sequence” “Red Giant” “White Dwarf”

The Life Cycle of Stars • Cycle for Massive Star: • Nebula • Main Sequence • Super Red Giant • Neutron Star, Pulsar, or Black Hole forms at end of its life cycle “protostar” “Main Sequence” “Red Giant” “White Dwarf”

Star Phases: Charted on H-R Diagram

Explaining the H-R Diagram • “H” = Hertzsprung • “R” = Russell • graph of temperature and brightness of all stars

A Closer Look at the H-R Diagram

Star Phases: Charted on H-R Diagram • The H-R Diagram shows the relationship between absolute magnitude, luminosity, classification, and effective temperatures of stars. • The H-R Diagram can be used to define different types of stars.

Explaining the H-R Diagram • Temperature: horizontal (bottom) axis. • hotter at left • cooler toward right

Explaining the H-R Diagram • Brightness: vertical (left side) axis. • brightest stars near top • dim stars near bottom

Explaining the H-R Diagram • A star’s position on the diagram will change as it moves from its “birth” to its “death”.

Explaining the H-R Diagram • You. Tube Style

Your Turn to Practice • Get a copy of HR Diagram. Color the different sections of the HR Diagram using colored pencils. Answer questions 115 using your notes and textbook.
 There are millions of stars in the sky
 Medium-sized star
 Life cycle of stars
 Star life cycle simulation
 Life cycle of stars graphic organizer
 Chapter 19 section 2 the life cycle of stars answer key
 Stellar evolution flow chart
 The life and death of stars
 The life and death of a star
 Section 26.3 life cycles of stars
 Life cycles of stars
 Hình ảnh bộ gõ cơ thể búng tay
 Bổ thể
 Tỉ lệ cơ thể trẻ em
 Chó sói


