The HertzsprungRussell diagram and the nature of stars


- Slides: 20
The Hertzsprung-Russell diagram and the nature of stars
The Hertzsprung-Russell Diagram Hertzsprung and Russell had the idea of plotting the luminosity of a star against its spectral type. This works best for a cluster, where you know the stars are all at the same distance. Then apparent brightness vs spectral type is basically the same as luminosity vs temperature. They found that stars only appear in certain parts of the diagram.
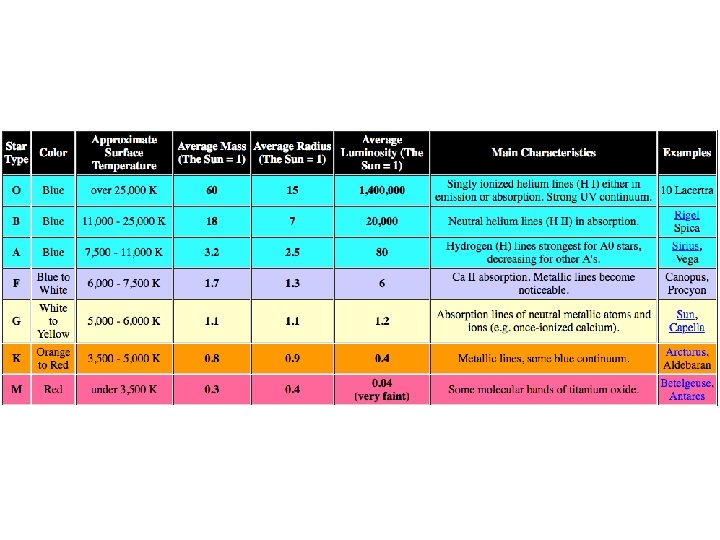
With information provided by spectroscopy, we can search for correlations between stellar properties
What the data show: the Hertzsprung. Russell Diagram Highest quality data from the Hipparchus spacecraft
The Sun is here The Sun is generically related to most
Filling out the Hertzsprung-Russell diagram
The Hertzsprung-Russell Diagram and the Types of Stars • • • Types of stars, important terms Main Sequence (luminosity class V) Giants (luminosity class III) Supergiants (luminosity class I) White dwarfs What does it all mean?
The Hertzsprung-Russell Diagram
Basics of the HR diagram Size Mass Red dwarfs
Hertzsprung. Russell Diagram Since there appears to be a strong correlation between luminosity and color (temperature), we put all the stars on a Luminosity – Temperature plot, and this is what it looks like: Properties of Stars shown in the H-R Diagram: 1. Luminosity (log scale). 2. Temperature and spectral type 3. Size 4. Mass of the main sequence 5. Lifetime Sizes scale 1 Rsun 1000 Rsun
Hertzsprung. Russell Diagram Notice that… • Temperature scale decreases from left to right. • The scale of luminosity is in power of 10 (log scale). • Mass increases from lower right to upper left • Size increases from lower left to upper right. Sizes scale 1 Rsun 1000 Rsun
Classification of Stars in H-R Diagram 1. The Main Sequence stars • healthy stars, fusing hydrogen in the core. • High-mass, highluminosity, hightemperature, and shortlived stars on the upper -left-hand corner • Low-mass, lowluminosity, lowtemperature, and longlived stars on the lower -right-hand corner Sizes scale 1 Rsun 1000 Rsun
Classification of Stars in H-R Diagram 2. The Supergiants, 3. The Giants, • Supergiants and giants are dying stars, fusing helium and heavier elements. 4. The White Dwarfs. • dead stars, exposed core of dead mainsequence stars. Sizes scale 1 Rsun 1000 Rsun
The Mass-Luminosity Diagram Main sequence stars The payoff: we can decode the HR diagram and learn that the main sequence is a mass sequence (and that off the main sequence things are more complicated).
HR Diagram - Properties Stars in different parts of the HR Diagram are in different phases of their life cycles. The Main Sequence is set by hydrogen fusion. Masses on the Main Sequence Stellar Sizes
Size/Luminosity Hot stars are very bright but very rare. They can affect the light, but not the mass of the Galaxy. Red giants are more common. Most common are red dwarfs. O 5 B 0 A 0
The Hertzsprung-Russell diagram is a plotting board for the nature and evolution of stars
Wein’s Law Ex. The light emitted by our sun is yellow light. It has a wavelength of 500 nm. What is the surface temperature of the sun according to Wein’s Law?