HertzsprungRussell HR Diagrams Take notes on your worksheet
 Diagrams Take notes on your worksheet, this is your study guide!")


- Slides: 8
Hertzsprung-Russell (H-R) Diagrams Take notes on your worksheet, this is your study guide!
Herzsprung-Russell Diagram Multiple axes to read: Spectral Class: OBAFGKM Astronomers have a classification scheme which describes the absorption lines of a spectrum. They have seven categories (OBAFGKM) each of which is subdivided into 10 subclasses. Thus, the spectral sequence includes B 8, B 9, A 0, A 1, etc. Although based on the absorption lines, spectral type tells you about the surface temperature of the star.
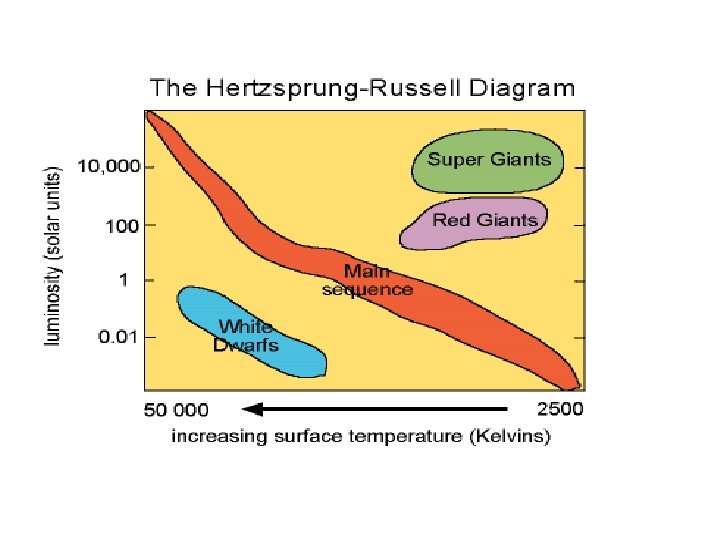
Herzsprung-Russell Diagram Temperature: The horizontal axis represents the star’s surface temperature (not the star’s core temperature – we cannot see into the core of a star, only its surface)! Usually this is labeled using the Kelvin temperature scale. Careful : On this diagram, the higher (hotter) temperatures are on the left, and the lower (cooler) temperatures are on the right.
Herzsprung-Russell Diagram Luminosity: Luminosity is technically the amount of energy a star radiates in one second, but you can think of it as how bright or how dim the star appears.
Herzsprung-Russell Diagram 1. What does luminosity mean? 2. Which stars are hot but dim? 3. Where is the sun on this diagram? 4. Describe the luminosity and temperature of red giants.
Our Sun’s Life Cycle What’s happening there?