Sunspots and Solar Cycles What might we expect


, SDO (Solar Dynamic Observatory) and NSO")
. This prediction is consistent")

- Slides: 30
Sunspots and Solar Cycles: What might we expect from Cycle 25 Parker Solar Probe KD 8 DZ September 2019
Corona during a solar eclipse
Sunspot Group
• • A Brief History of Sunspot Observations 800 BC Chinese observations recorded in the Book of Changes. 364 BC First deliberate observation by Chinese astronomer Gan De in his star catalogue. Imperial reported regular observations. 300 BC, First mention of sunspots in the west, Greek astronomer, Theophrastus, a student of Plato and Aristotle. 1610 English astronomer Thomas Harriot (Harriot was also the first astronomer to observe a Venus Transit). 1611 German astronomers Johannes and David Fabricius first to publish results about the same time Galileo observed the moons of Jupiter. He had been showing sunspots by projecting on to a white surface using a telescope. 1826 -1843 Samuel Schwabe investigated the cyclic nature of sunspots. 1875 Rudolf Wolf created a sunspot number formulation to compare observations of different astronomers. And many others…
Sunspot Observations and cycles 400 years of cycles Butterfly patterns Sunspot activity over longer time periods
The Solar Cycle Sunspot activity waxes and wanes over approximately eleven year period. 28 -year period (1645– 1715) 1826 -1843 Samuel Schwabe begins serious observations of sunspots and 1875 Rudolf Wolf created a sunspot number formulation to compare observations of different astronomers.
Note that the butterfly pattern is not completed for the current cycle.
Estimate of Solar activity over about 7000 years…
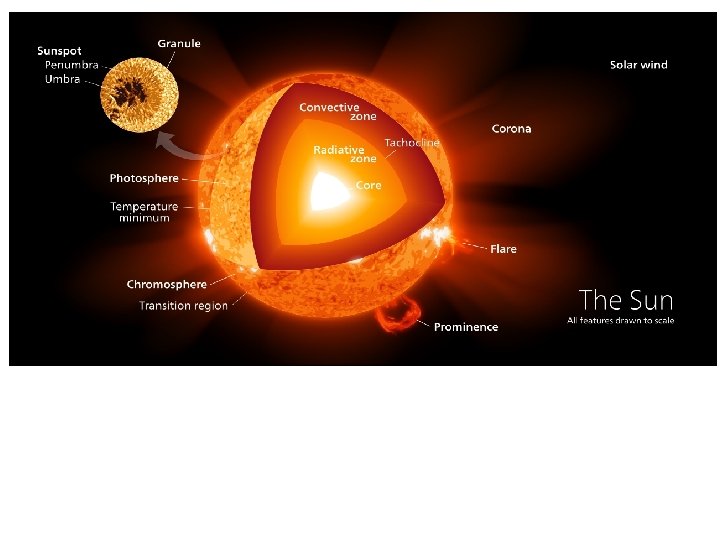
Visibility of sunspots Sunspots appear darker than the surrounding solar photosphere due to their lower temperature about 2700 -4200 °C, contrasted with the 5500 °C of the observable surrounding photosphere. Magnetic fields emanating from the spots constrain upwelling of hotter gases and thus appear darker. Lifecycle Spots last for a few days to as long as months and may expand or contract over time. They are manifestations of magnetic flux tubes that penetrate the surface of the sun caused by the winding up of magnetic field due to differential rotation of the sun. Solar rotation varies with latitude. Fastest at the equator, approximately 24. 47 days and slowest at the poles, almost 38 days
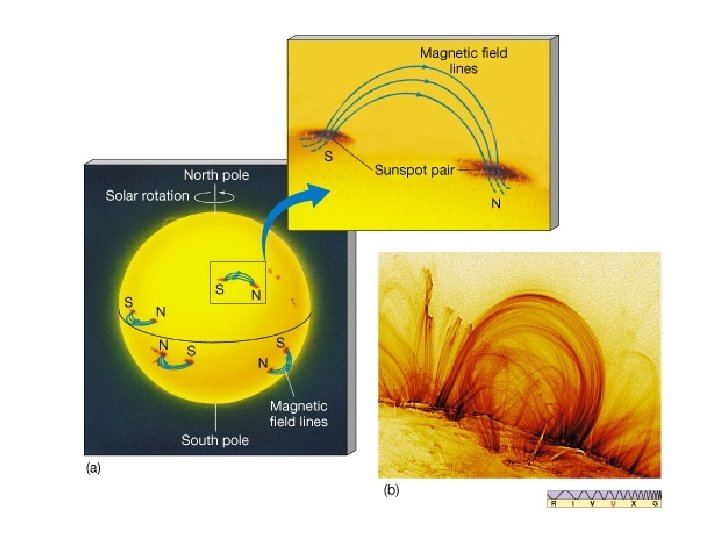
Sunspot Magnetic Properties define a longer 22 year cycle. • Sunspots begin appearing at higher latitudes at the beginning of a cycle and as the cycle continues, appear progressively at lower latitudes. The sunspot groups form in pairs with leading and trailing spots having opposite magnetic polarities. • The polarities in northern and southern hemispheres are opposite. • In preceding or succeeding cycles, the polarities reverse. For example, if the polarities in the northern hemisphere of the sun have leading spots which are north magnetic poles, then the leading spot in the southern hemisphere is a south magnetic pole. In the next cycle, the polarities are reversed.
Ell How do we know that the about the magnetic properties of sunspots The Zeeman effect in sunspots demonstrates the magnetic nature of sunspots and its polarity. The spectrum of the Fe I 6302. 5 Å iron line taken by George Ellery Hale showing the magnetic Zeeman splitting/broadening. The same spectra line not in a magnetic field would not show the splitting of the line.
Magnetograms Stanford Solar Center Magnetograms determine Sunspot polarity. Has to do with the polarized light from the spot. Line of sight fields South polarity magnetic fields (black) point into the sun and North polarity magnetic fields (white) point out of the sun.
A solar eruptive prominence as seen in extreme UV light on March 30, 2010 with Earth superimposed for a sense of scale. Credit: NASA/SDO
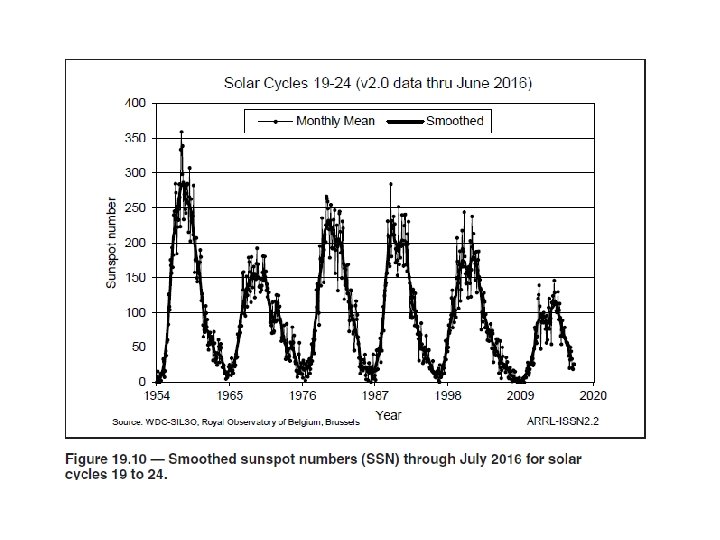
Sunspot numbers are calculated by first counting the number of groups and then the number of individual spots. The “sunspot number” is then given by the sum of the number of individual sunspots and ten times the number of groups. Since most sunspot groups have, on average about ten spots, this formula for counting sunspots gives reliable numbers even when the observing conditions are less than ideal and small spots are hard to see. R = k (10 g + s) R = sunspot number, g number of groups, s number of individual spots and k an atmospheric factor. Highest smoothed number was 201 for cycle 19.
The 10. 7 cm solar radio flux is an excellent indicator of solar activity and correlates with sunspot activity. F 10. 7 has been measured consistently in Canada since 1947 10. 7 cm (2800 MHz) radio emission from the sun in solar flux units (sfu) feom the Penticton Radio Observatory in British Columbia, Canada
Dominion Radio Astrophysical Observatory Penticton, British Columbia, Canada
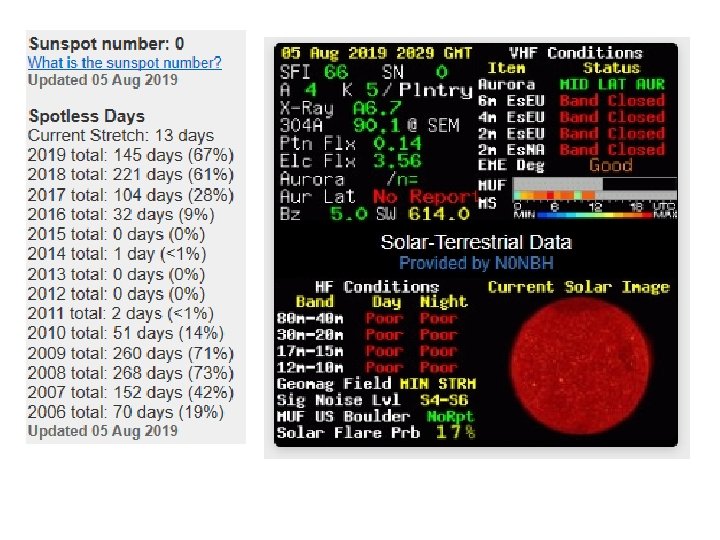
There is a relationship between smoothed sunspot number and the 10. 7 cm solar flux reported daily on various sources.
Take Away • 10. 7 Solar Flux is directly related to the solar magnetic activity. That is Sunspots. • In addition to the continuous measurements made by 2 dedicated radio telescopes at the Dominion Radio Astrophysical Observatory and reported on the web at 5 -second intervals, 3 precise measurements are made each day and E-mailed worldwide to a list of users such as the NOAA Space Weather Prediction Center at www. swpc. noaa. gov and www. Spaceweather. com.
PREDICTIONS "The current prediction for Sunspot Cycle 24 gives a smoothed sunspot number maximum of about 69 in the late Summer of 2013. The smoothed sunspot number reached 68. 9 in August 2013 so the official maximum will be at least this high. The smoothed sunspot number has been rising again towards this second peak over the last five months and has now surpassed the level of the first peak (66. 9 in February 2012). Many cycles are double peaked but this is the first in which the second peak in sunspot number was larger than the first. We are currently over five years into Cycle 24. The current predicted and observed size makes this the smallest sunspot cycle since Cycle 14 which had a maximum of 64. 2 in February of 1906. "[1]
SOLAR CYCLE 25 PRELIMINARY FORECAST published: Tuesday, June 11, 2019 04: 03 UTC The NOAA/NASA co-chaired international panel to forecast Solar Cycle 25 released a preliminary forecast for Solar Cycle 25 on April 5, 2019. The consensus: Cycle 25 will be similar in size to cycle 24. It is expected that sunspot maximum will occur no earlier than the year 2023 and no later than 2026 with a minimum peak sunspot number of 95 and a maximum of 130. In addition, the panel expects the end of Cycle 24 and start of Cycle 25 to occur no earlier than July, 2019, and no later than September, 2020. The panel hopes to release a final, detailed forecast for Cycle 25 by the end of 2019. Please read the official NOAA press release describing the international panel's forecast at https: //www. weather. gov/news/190504 -sun-activity-in-solar-cycle
NOAA/NASA SOLAR CYCLE 25 PRELIMINARY FORECAST published: Tuesday, June 11, 2019 04: 03 UTC
A second prediction. NOAA & NASA Solar Cycle 25 Forecasts – A Comparison based on Combined sunspot number and observed solar magnetic fields. Research by I. Kitiashvili NASA AMES Research Center, CA. Previous results • Successfully predicted cycle 24 • Uses SDO and SOHO satellite data. • Uses a model which is highly complex using observational data. Predictions q Extended solar minimum. q Maximum in 2024 -2025 q Peak sunspot number of 50 with estimated error of 15 -3
Data collected from SOHO (Solar and Heliospheric Observatory), SDO (Solar Dynamic Observatory) and NSO (Solar, National Solar Observatory) Data is based on observations over the last 4 solar cycles. Magnetic data from NSO since 1976.
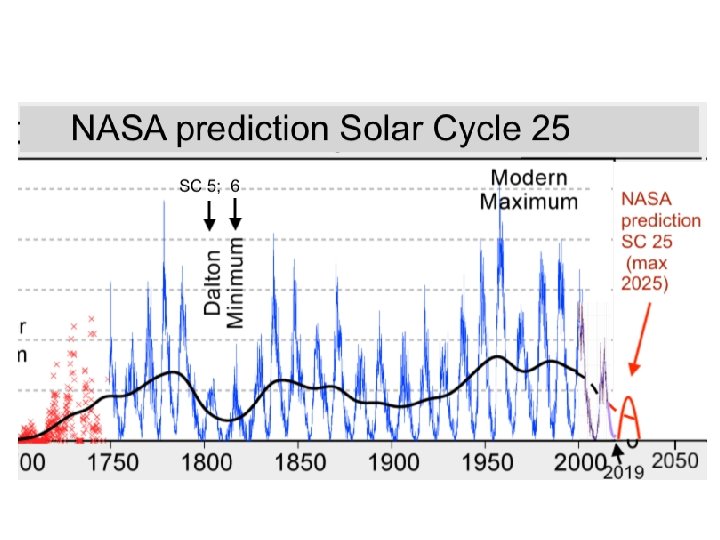
A 3 rd Prediction by David Birch (independent solar researcher). This prediction is consistent with a new paper by Valentina Zharkova confirming the next Grand Solar Minimum titled, Oscillations of the baseline of solar magnetic field and solar irradiance on a millennial timescale published in Nature. 25 26
Note that the period from about 1790 to 1830 may be similar to cycles 22, 23, 24 & 25. Birch predicts a sunspot number peak of 50 for cycle 25. Zharkova predicts a Grand Solar Minimum similar to the Maunder Minimum which starts in 2020 and continues to 2055 and will again arrive in 2370 -2415. Her team's calculations match up with the timelines of the Maunder Minimum (1645– 1715), Wolf minimum (1300– 1350), Oort minimum (1000– 1050), Homer minimum (800– 900 BC); also the Medieval Warm Period (900– 1200), the Roman Warm Period (400– 150 BC) and so on with great accuracy. So he says! TBD.