Statistics Or Do our Data mean Diddly Why
- Slides: 18
Statistics Or Do our Data mean Diddly?
Why are stat important • Sometimes two data sets look different, but aren’t • Other times, two data sets don’t look that different, but are.
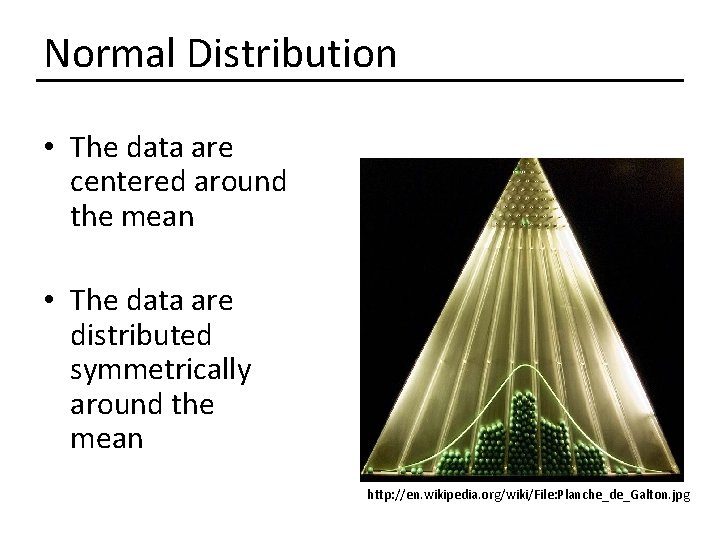
Normal Distribution • The data are centered around the mean • The data are distributed symmetrically around the mean http: //en. wikipedia. org/wiki/File: Planche_de_Galton. jpg
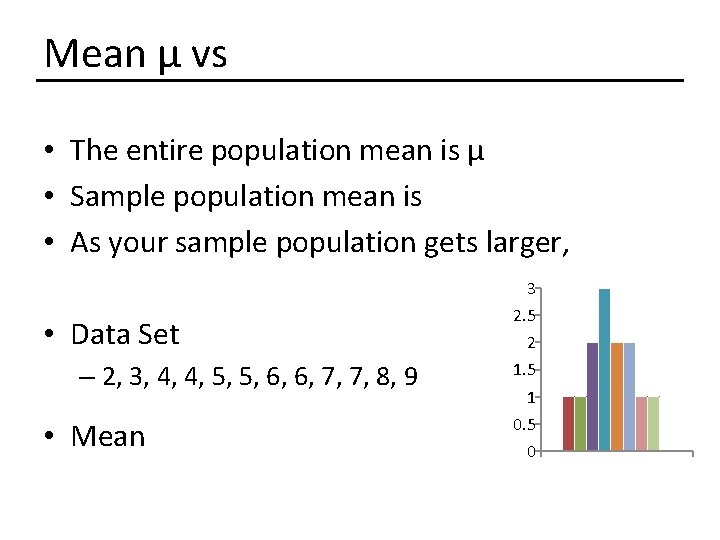
Mean μ vs • The entire population mean is μ • Sample population mean is • As your sample population gets larger, • Data Set – 2, 3, 4, 4, 5, 5, 6, 6, 7, 7, 8, 9 • Mean 3 2. 5 2 1. 5 1 0. 5 0
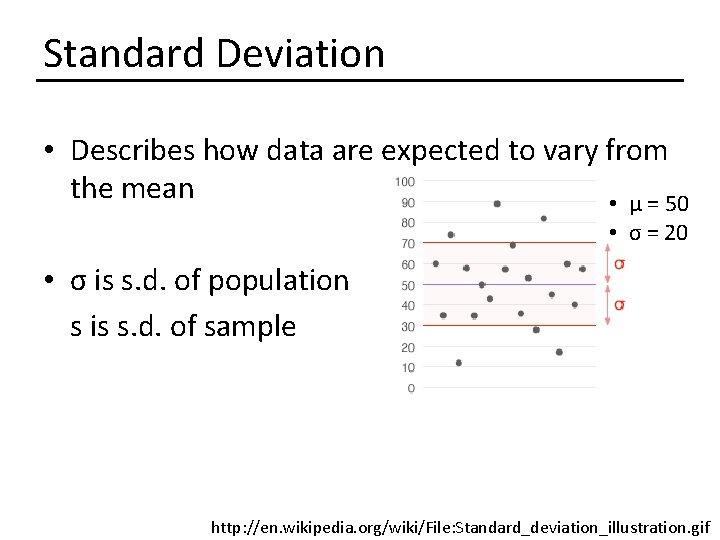
Standard Deviation • Describes how data are expected to vary from the mean • μ = 50 • σ = 20 • σ is s. d. of population s is s. d. of sample http: //en. wikipedia. org/wiki/File: Standard_deviation_illustration. gif
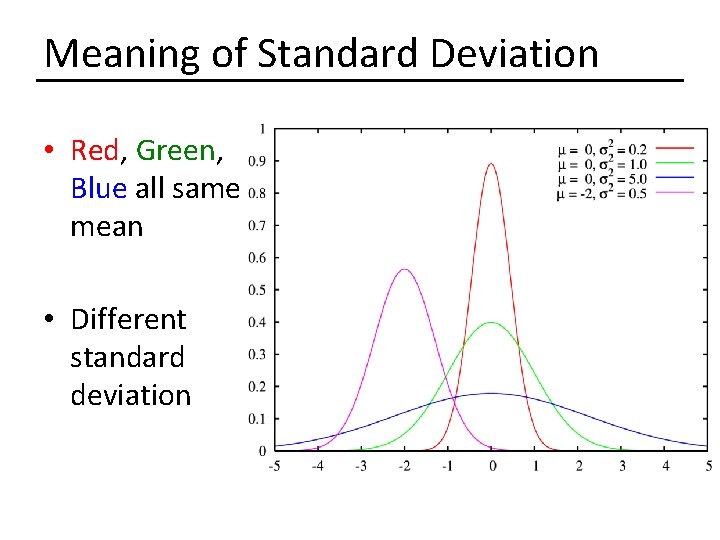
Meaning of Standard Deviation • Red, Green, Blue all same mean • Different standard deviation
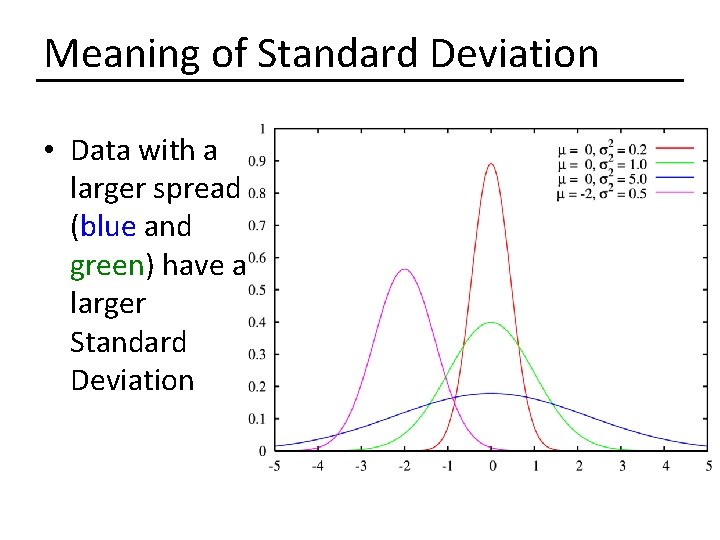
Meaning of Standard Deviation • Data with a larger spread (blue and green) have a larger Standard Deviation
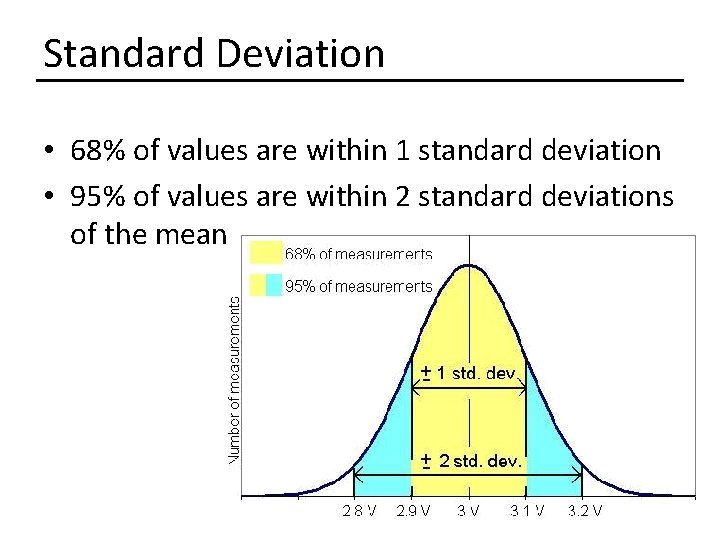
Standard Deviation • 68% of values are within 1 standard deviation • 95% of values are within 2 standard deviations of the mean
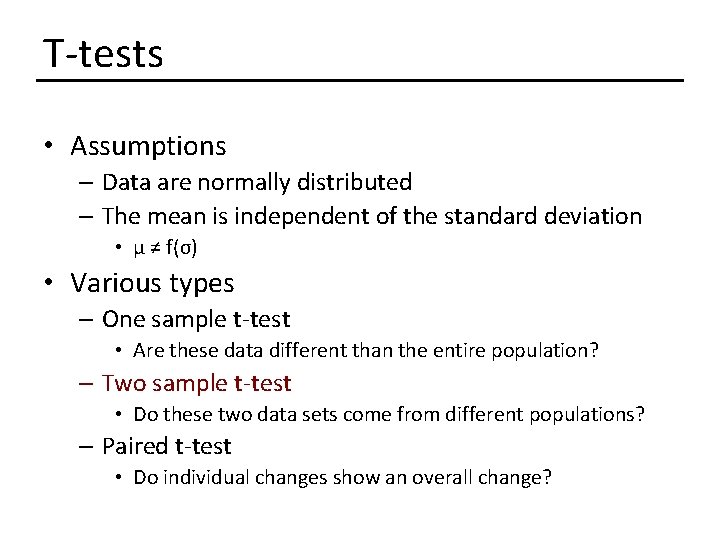
T-tests • Assumptions – Data are normally distributed – The mean is independent of the standard deviation • μ ≠ f(σ) • Various types – One sample t-test • Are these data different than the entire population? – Two sample t-test • Do these two data sets come from different populations? – Paired t-test • Do individual changes show an overall change?
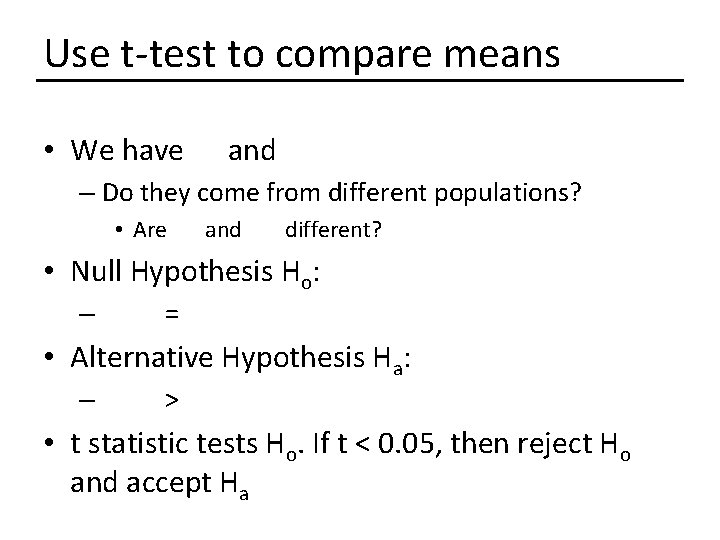
Use t-test to compare means • We have and – Do they come from different populations? • Are and different? • Null Hypothesis Ho: – = • Alternative Hypothesis Ha: – > • t statistic tests Ho. If t < 0. 05, then reject Ho and accept Ha
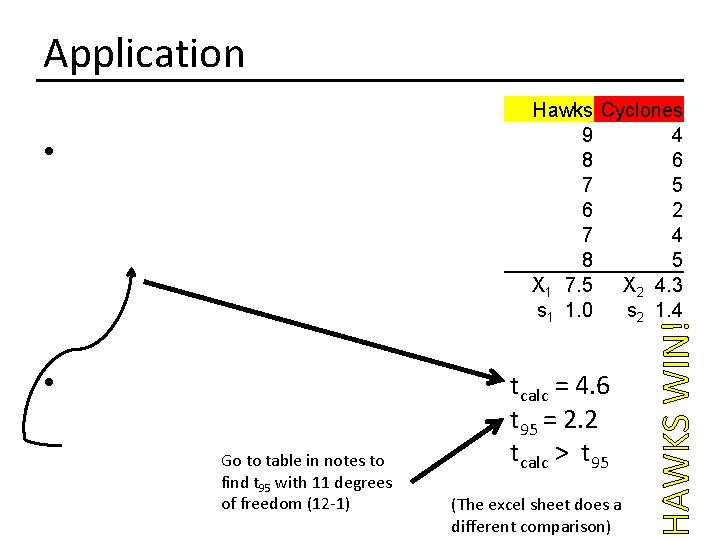
Application • • Go to table in notes to find t 95 with 11 degrees of freedom (12 -1) tcalc = 4. 6 t 95 = 2. 2 tcalc > t 95 (The excel sheet does a different comparison) HAWKS WIN! Hawks Cyclones 9 4 8 6 7 5 6 2 7 4 8 5 X 1 7. 5 X 2 4. 3 s 1 1. 0 s 2 1. 4
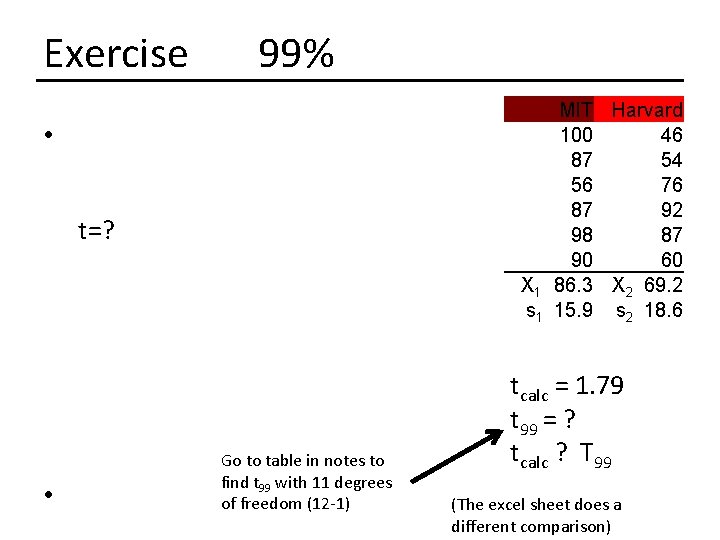
Exercise 99% MIT Harvard 100 46 87 54 56 76 87 92 98 87 90 60 X 1 86. 3 X 2 69. 2 s 1 15. 9 s 2 18. 6 • t=? • Go to table in notes to find t 99 with 11 degrees of freedom (12 -1) tcalc = 1. 79 t 99 = ? tcalc ? T 99 (The excel sheet does a different comparison)
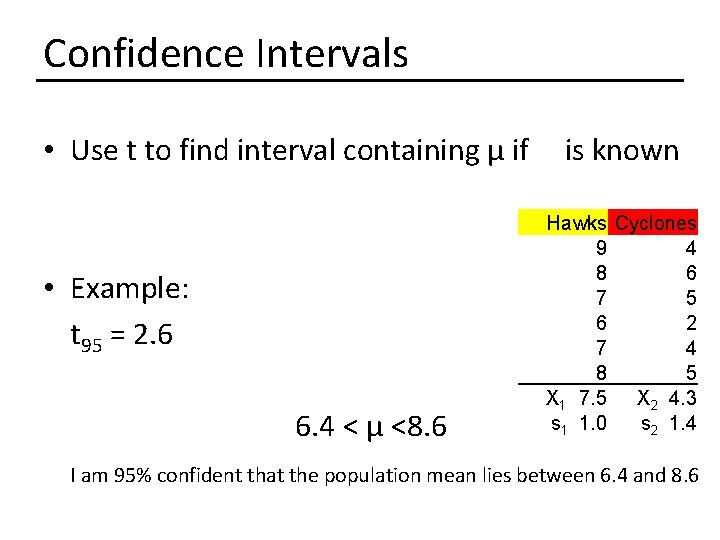
Confidence Intervals • Use t to find interval containing μ if • Example: t 95 = 2. 6 6. 4 < μ <8. 6 is known Hawks Cyclones 9 4 8 6 7 5 6 2 7 4 8 5 X 1 7. 5 X 2 4. 3 s 1 1. 0 s 2 1. 4 I am 95% confident that the population mean lies between 6. 4 and 8. 6
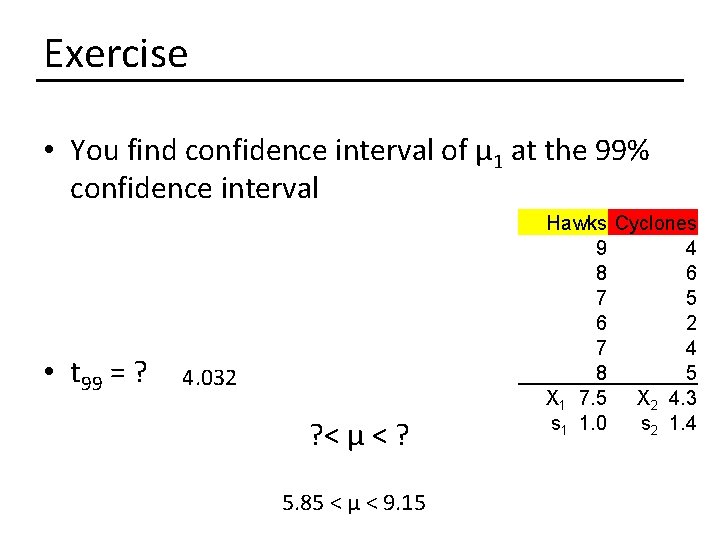
Exercise • You find confidence interval of μ 1 at the 99% confidence interval • t 99 = ? 4. 032 ? < μ < ? 5. 85 < μ < 9. 15 Hawks Cyclones 9 4 8 6 7 5 6 2 7 4 8 5 X 1 7. 5 X 2 4. 3 s 1 1. 0 s 2 1. 4
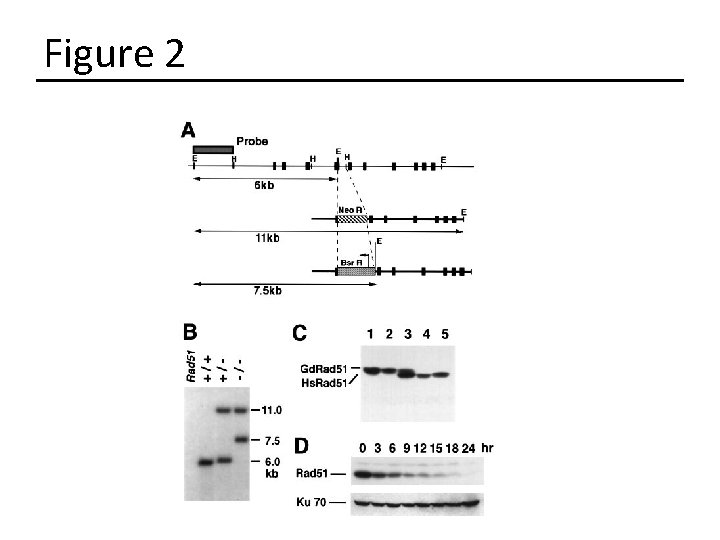
Figure 2
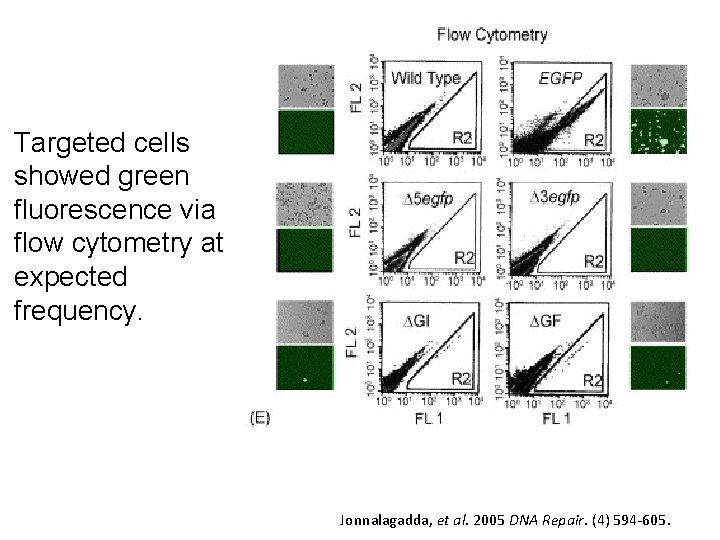
Targeted cells showed green fluorescence via flow cytometry at expected frequency. Jonnalagadda, et al. 2005 DNA Repair. (4) 594 -605.