SSACgnp JAM 1 7 Hawaii Volcanoes National Park


 The video below is a time series of")


")
 Human Population (respiratory) Livestock GARY Airplanes (potentially)")
 1. Example: Answer questions Q 1 -Q 6")
 1. Example: Answer questions Q 1 -Q 6")
- Slides: 18
SSACgnp. ? ? ? . JAM 1. 7 Hawaii Volcanoes National Park Trouble in Paradise Seismic data and webcams The module you are viewing is a Power. Point slide presentation. • • • Navigate from slide to slide using the up/down arrow keys, or, if available, the scroll bar on your mouse Core Quantitative Literacy Topics To be completed Use the mouse to select hyperlinks (underlined, in blue type) or to pass through embedded flash animations Supporting Quantitative Literacy Topics When done, use the escape key to exit the presentation. To be completed You can and probably should have a spreadsheet open in a separate window, Core Subject so you can try out things that are explained in Geoscience the presentation. Earthquakes and eruptions Power. Point applications use lots of memory, so you may want to exit other programs while running this presentation, especially if it starts to act slowly or sluggishly. Judy Mc. Ilrath Department of Geology, University of South Florida this window to proceed with slide © Close 2010 University of South Florida Libraries. All rightsthe reserved. show. 1
Getting started After completing this module you should be able to: • Discuss volcano monitoring techniques • Calculate movement using GPS data • Analyze graphs • Convert measurement units Canada You should also know where Hawaii Volcanoes National Park is located and its geologic origin. United States 2
The setting – Hawaii Volcanoes National Park Hawai’i Volcanoes National Park, established in 1916, also holds the designation of an International Biosphere Reserve (1980) and a World Heritage Site (1987). The park is home to two of the world’s most active volcanoes, Kilauea with almost continuous eruptions since 1983 and Mauna Loa. the world’s tallest mountain. Far from any plate tectonic boundary, Hawai’i is the youngest island in the Hawai’ian island chain which formed as the Pacific Plate moves over a hot spot. Thousands of miles from the closest continent, flora and fauna evolved over the last 70 million years in near complete isolation. Ninety percent of the species found in Hawai’i are found nowhere else in the world. 3
Evolution of a Hot Spot Island Chain The diagram below shows how an oceanic island chain evolves through time as the lithospheric plate moves over a stationary hot spot mantle plume in a conveyor belt-type motion. Ocean crust Ocean lithosphere Aesthenosphere Lithospheric plate motion Stationary mantle plume – “Hot Spot” 4
The Hawaiian Hot Spot The map below shows the islands created as the Pacific Plate moved over a hot spot. Volcano symbols indicate historical volcanic activity. Loihi Seamount, in the southeast, is the youngest volcano and may in time breach the ocean surface and become a new island. Hawaii has three active volcanoes, Mauna Loa, Kilauea, and Hualalai. Maui has experienced at least ten eruptions in the past 1, 000 years. Northwestern islands are older and volcanically extinct. Oahu Maui Loihi Seamount 5
Volcano Monitoring Techniques Hawaii Volcano Observatory, housed within the National Park, collects seismic, gas, gravity, geochemical, tilt, GPS, and webcam data along with visual observations to monitor the volcano. Seismic Data When earthquakes occur, they are recorded on seismometers strategically placed around volcanoes. Often, harmonic tremor, a continuous rhythmic earthquake, indicates magma movement. Note: Where the earthquakes cluster is the area of Kilauea Caldera, Puu. Oo crater, and the rift zones. This map of the southern portion of Hawaii displays latitude, longitude on the x-axis. Each circle on the map indicates the location, magnitude, and month in which the event occurred between 1/1/10 and 7/25/10. What is the range of latitude? Longitude?
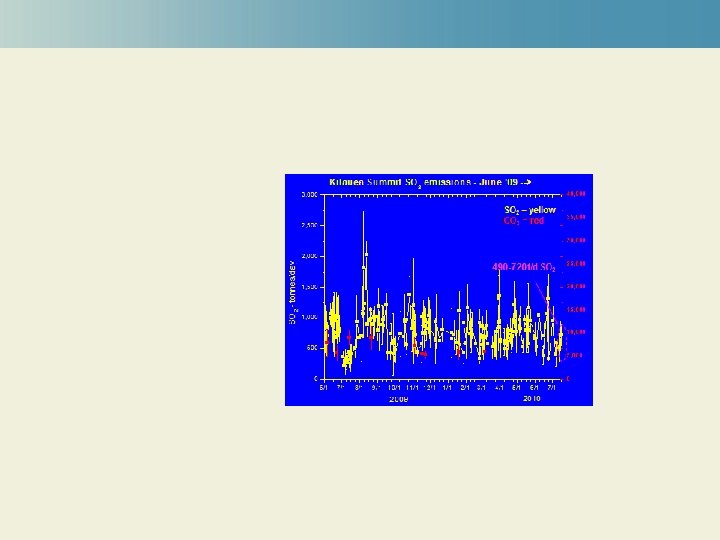
Volcano Monitoring Techniques Gas Data Plume of gas at Halema’u Crater on July 25, 2010 SO 2 concentrations at a gas-monitoring station on the south rim of Halema’u Crater since July 22, 2010.
Volcano Monitoring Techniques Gravity Data Geochemical Data
Monitoring Techniques – Tilt meters Tiltmeter accuracy an Ibeam one km long and place a dime under one end the amount of tilt is equivalent to one microradian we see one/tenth of that. Animation similar to Reid’s here! 9
Monitoring Techniques – Kinematic GPS & Continuous GPS After 10
Monitoring Techniques – Visual Observations (Webcams) The video below is a time series of images from Go to the webcam to see what is happening at the Halemaumau Crater Overlook. Write down your observations. Now go to the archive image on ? ? date. How do the image compare? 11
Why monitor Kilauea? # & volume of eruptions kkkk 12
Why monitor Kilauea? Explosive eruptions kkkk 1924 Kilauea from HVO 13
Kīlauea 1750– 1983 Kīlauea 1983 -present 1986– 1992 1983– 1986 Pu‘u ‘Ō‘ō (episodic fountains) Kupaianaha (continuous effusion) 1992– 2007–present Pu‘u ‘Ō‘ō flank vents (continuous effusion) July 21 st, 2007 eruption (continuous effusion)
Who is affected? Tropical Flower growers (Gas) Human Population (respiratory) Livestock GARY Airplanes (potentially) 15
End-of-module assignment (Arial bold, 20 pt) 1. Example: Answer questions Q 1 -Q 6 on pages 4, 8, 14, and 15. 2. Paragraph settings: Alignment = left Indentation: Before = 0. 35”, Special = hanging by 0. 35” Spacing: Before = 0 pt, After = 6 pt, Line spacing = single 16
End-of-module assignment (Arial bold, 20 pt) 1. Example: Answer questions Q 1 -Q 6 on pages 4, 8, 14, and 15. 2. Paragraph settings: Alignment = left Indentation: Before = 0. 35”, Special = hanging by 0. 35” Spacing: Before = 0 pt, After = 6 pt, Line spacing = single Pahoehoe Aa 18