Solar Energy Supply in the UK Andrea Finegan
- Slides: 8
Solar Energy Supply in the UK Andrea Finegan March 2010
Types of Solar Uses �Grid-connected domestic systems �Grid-Connected power plants �Off-grid systems for rural electrification �Off-grid industrial applications �Consumer goods
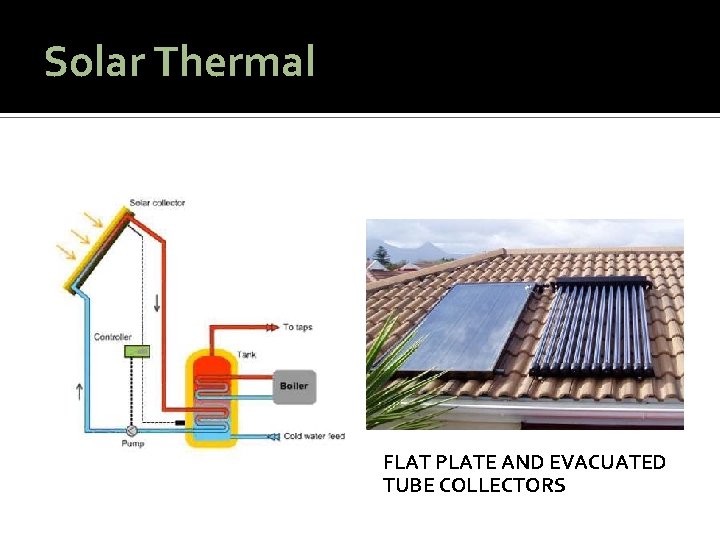
Solar Thermal FLAT PLATE AND EVACUATED TUBE COLLECTORS
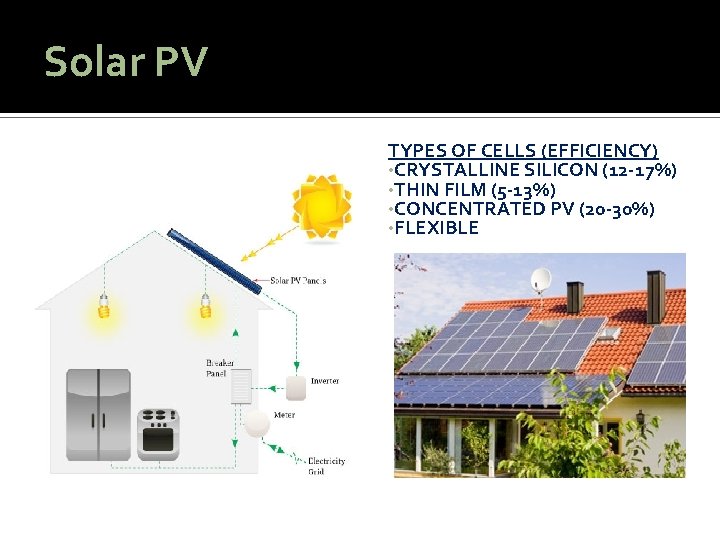
Solar PV TYPES OF CELLS (EFFICIENCY) • CRYSTALLINE SILICON (12 -17%) • THIN FILM (5 -13%) • CONCENTRATED PV (20 -30%) • FLEXIBLE
Benefits � PV emits 21. 65 g CO 2/k. Wh compared to 900 g/k. Wh for conventional thermal power � Energy payback between 1 and 3. 5 years � For every MW of PV capacity 7 -11 jobs are created compared to 3 for wind and 1 for coal & gas � Production costs falling 6% p. a. � Grid parity expected in 2013 Domestic 2018 Commercial 5
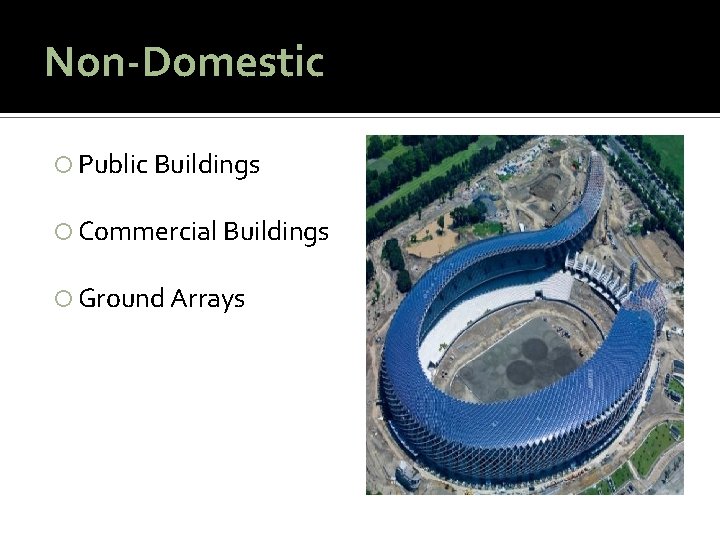
Non-Domestic Public Buildings Commercial Buildings Ground Arrays
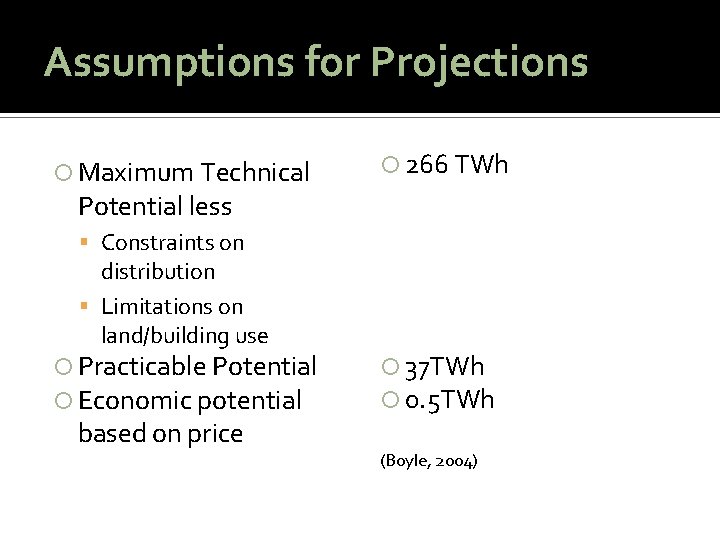
Assumptions for Projections Maximum Technical 266 TWh Potential less Constraints on distribution Limitations on land/building use Practicable Potential Economic potential based on price 37 TWh 0. 5 TWh (Boyle, 2004)
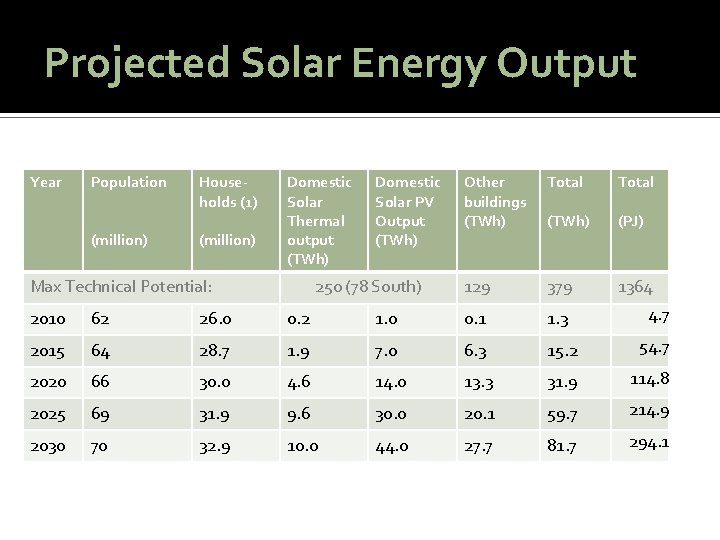
Projected Solar Energy Output Year Population (million) Households (1) (million) Domestic Solar Thermal output (TWh) Max Technical Potential: Domestic Solar PV Output (TWh) 250 (78 South) Other buildings (TWh) Total (TWh) (PJ) 129 379 1364 2010 62 26. 0 0. 2 1. 0 0. 1 1. 3 4. 7 2015 64 28. 7 1. 9 7. 0 6. 3 15. 2 54. 7 2020 66 30. 0 4. 6 14. 0 13. 3 31. 9 114. 8 2025 69 31. 9 9. 6 30. 0 20. 1 59. 7 214. 9 2030 70 32. 9 10. 0 44. 0 27. 7 81. 7 294. 1