Sc Wk 298 Quantitative Review Session Types of

- Slides: 22
Sc. Wk 298 Quantitative Review Session
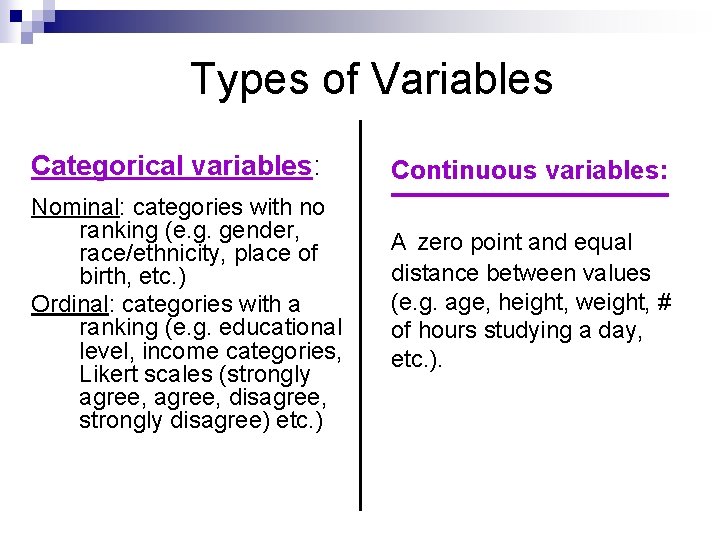
Types of Variables Categorical variables: Nominal: categories with no ranking (e. g. gender, race/ethnicity, place of birth, etc. ) Ordinal: categories with a ranking (e. g. educational level, income categories, Likert scales (strongly agree, disagree, strongly disagree) etc. ) Continuous variables: A zero point and equal distance between values (e. g. age, height, weight, # of hours studying a day, etc. ).
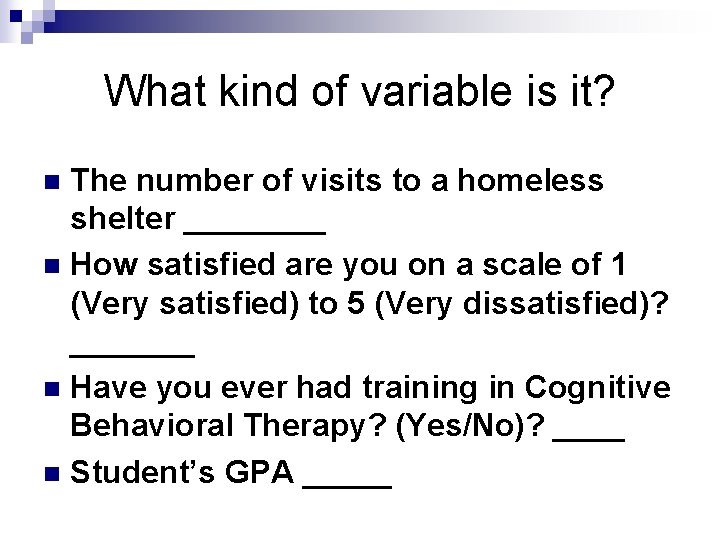
What kind of variable is it? The number of visits to a homeless shelter ____ n How satisfied are you on a scale of 1 (Very satisfied) to 5 (Very dissatisfied)? _______ n Have you ever had training in Cognitive Behavioral Therapy? (Yes/No)? ____ n Student’s GPA _____ n
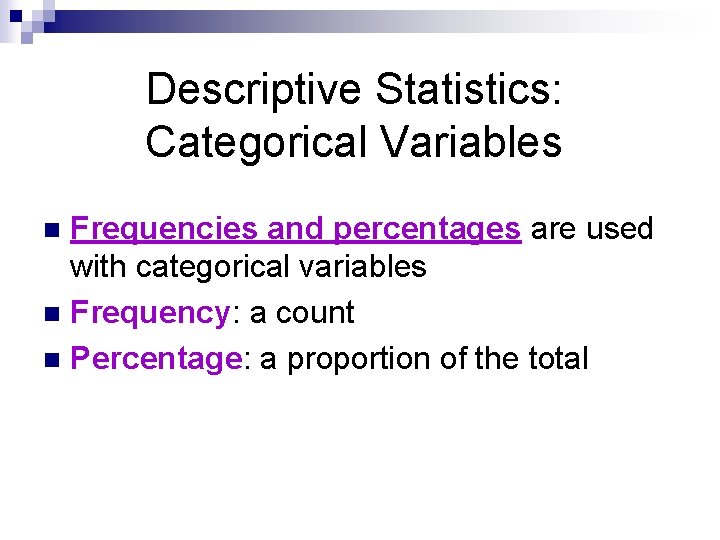
Descriptive Statistics: Categorical Variables Frequencies and percentages are used with categorical variables n Frequency: a count n Percentage: a proportion of the total n
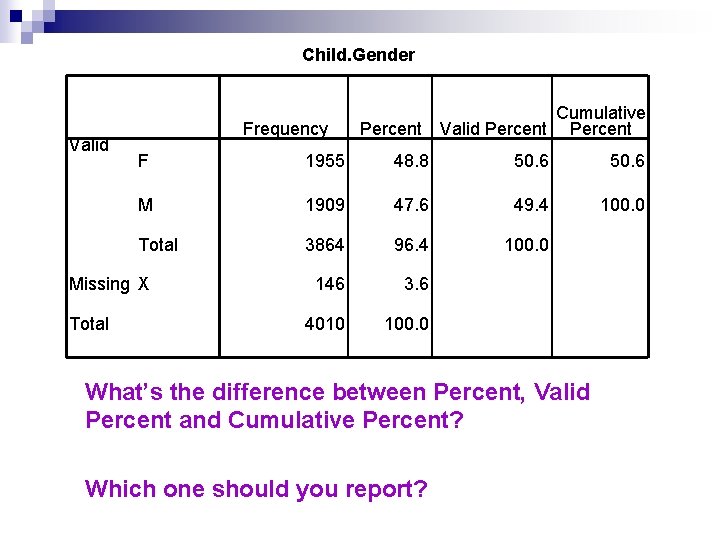
Child. Gender Valid Frequency F 1955 48. 8 50. 6 M 1909 47. 6 49. 4 100. 0 Total 3864 96. 4 100. 0 146 3. 6 4010 100. 0 Missing X Total Cumulative Percent Valid Percent What’s the difference between Percent, Valid Percent and Cumulative Percent? Which one should you report?
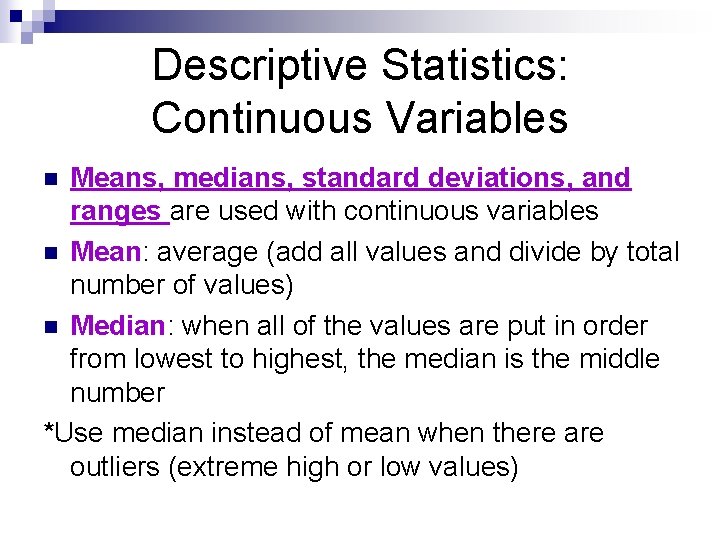
Descriptive Statistics: Continuous Variables Means, medians, standard deviations, and ranges are used with continuous variables n Mean: average (add all values and divide by total number of values) n Median: when all of the values are put in order from lowest to highest, the median is the middle number *Use median instead of mean when there are outliers (extreme high or low values) n
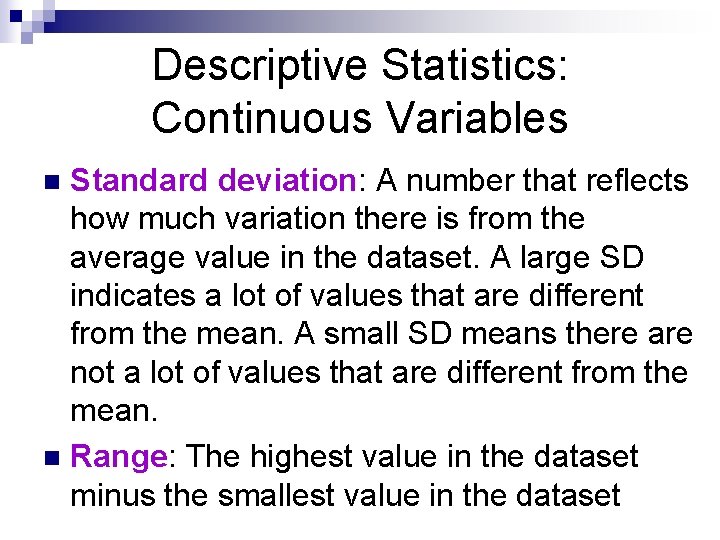
Descriptive Statistics: Continuous Variables Standard deviation: A number that reflects how much variation there is from the average value in the dataset. A large SD indicates a lot of values that are different from the mean. A small SD means there are not a lot of values that are different from the mean. n Range: The highest value in the dataset minus the smallest value in the dataset n
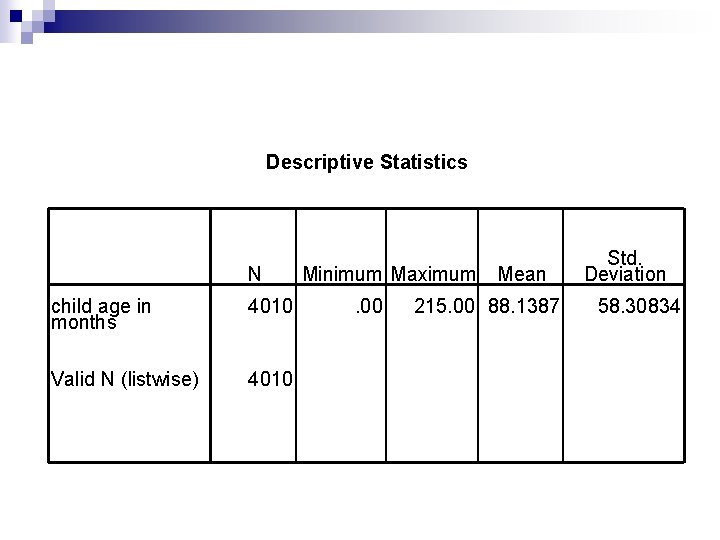
Descriptive Statistics N child age in months 4010 Valid N (listwise) 4010 Minimum Maximum. 00 Mean 215. 00 88. 1387 Std. Deviation 58. 30834
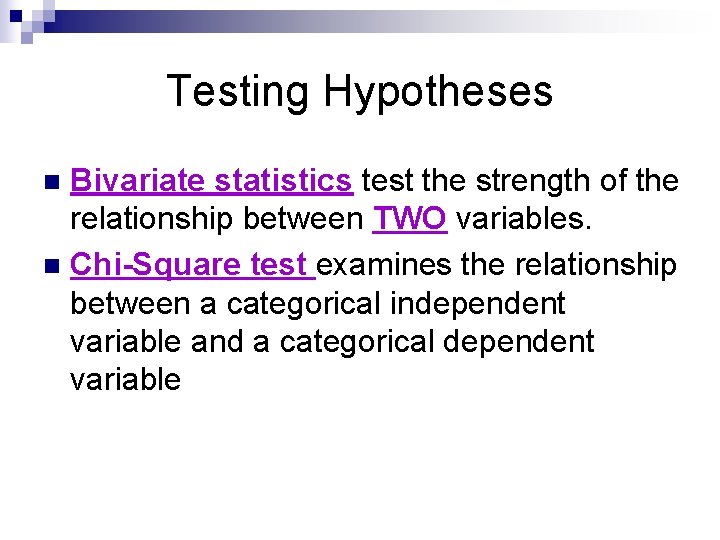
Testing Hypotheses Bivariate statistics test the strength of the relationship between TWO variables. n Chi-Square test examines the relationship between a categorical independent variable and a categorical dependent variable n
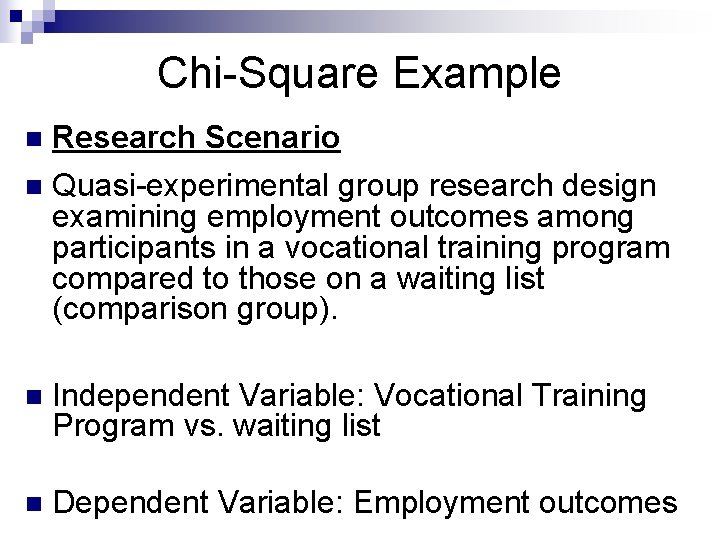
Chi-Square Example n Research Scenario n Quasi-experimental group research design examining employment outcomes among participants in a vocational training program compared to those on a waiting list (comparison group). n Independent Variable: Vocational Training Program vs. waiting list n Dependent Variable: Employment outcomes
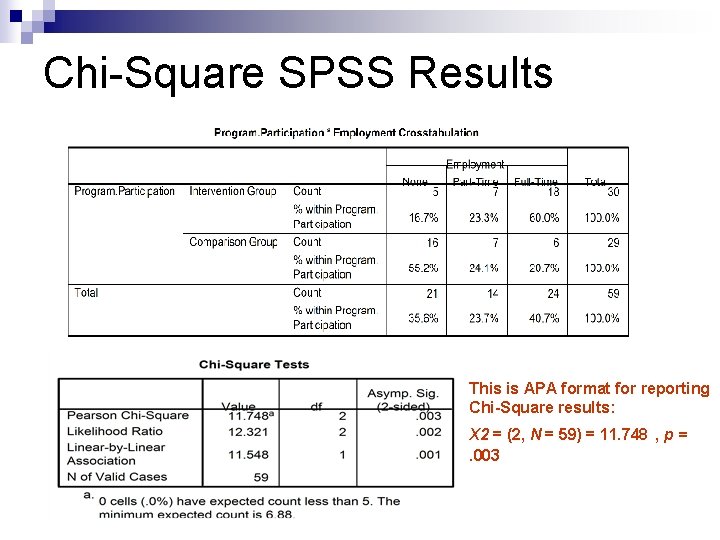
Chi-Square SPSS Results This is APA format for reporting Chi-Square results: X 2 = (2, N = 59) = 11. 748 , p =. 003
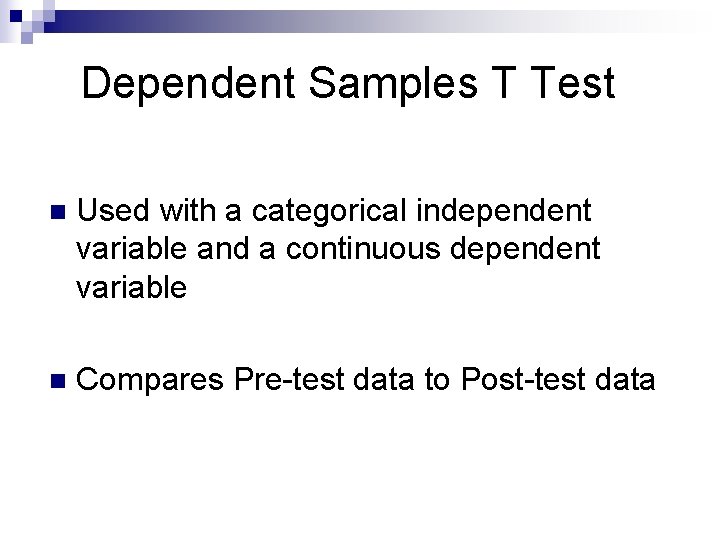
Dependent Samples T Test n Used with a categorical independent variable and a continuous dependent variable n Compares Pre-test data to Post-test data
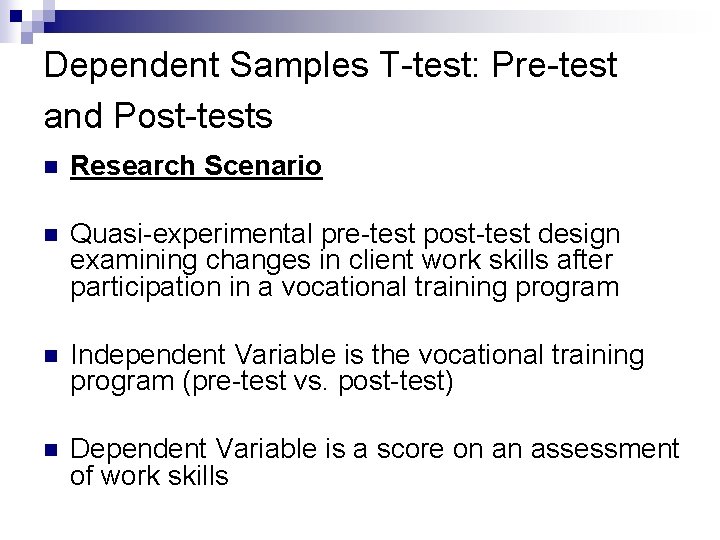
Dependent Samples T-test: Pre-test and Post-tests n Research Scenario n Quasi-experimental pre-test post-test design examining changes in client work skills after participation in a vocational training program n Independent Variable is the vocational training program (pre-test vs. post-test) n Dependent Variable is a score on an assessment of work skills
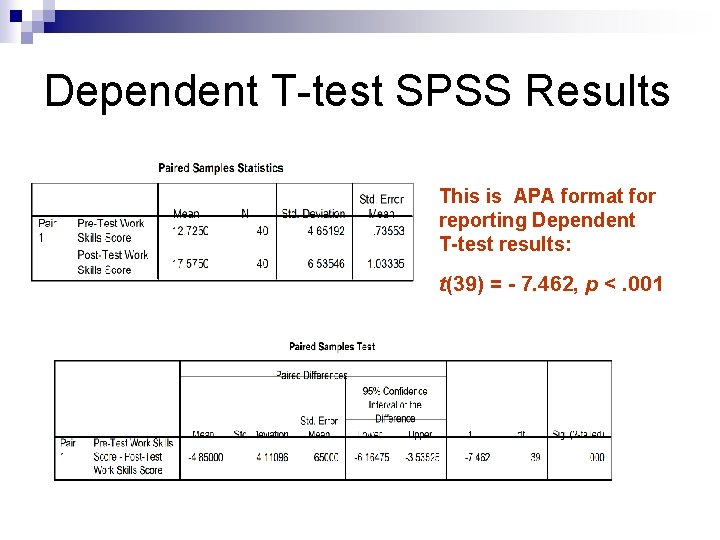
Dependent T-test SPSS Results This is APA format for reporting Dependent T-test results: t(39) = - 7. 462, p <. 001
Independent Samples T Test n Used with a categorical independent variable and a continuous dependent variable n Compares data between 2 different groups
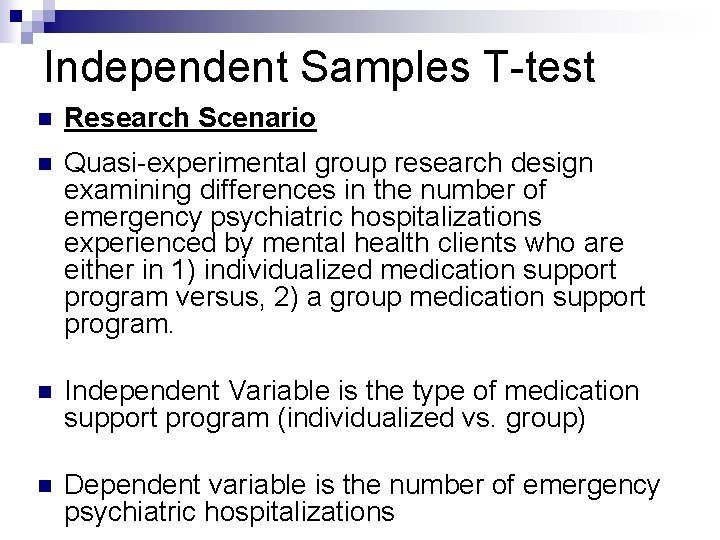
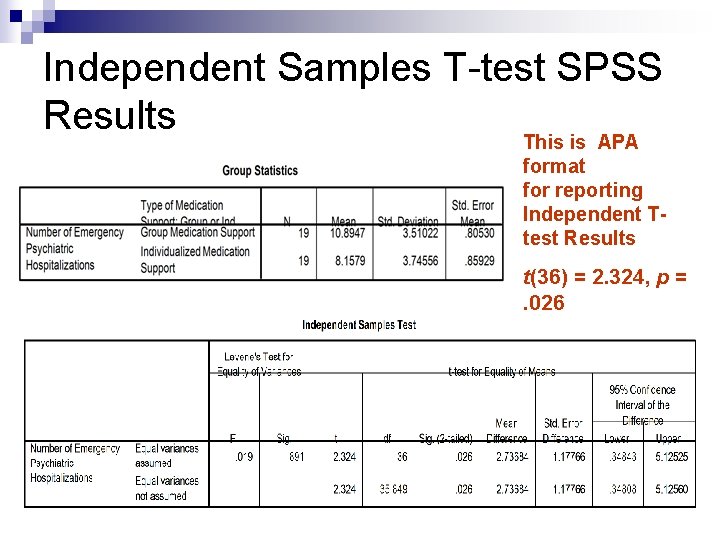
Independent Samples T-test n Research Scenario n Quasi-experimental group research design examining differences in the number of emergency psychiatric hospitalizations experienced by mental health clients who are either in 1) individualized medication support program versus, 2) a group medication support program. n Independent Variable is the type of medication support program (individualized vs. group) n Dependent variable is the number of emergency psychiatric hospitalizations
Independent Samples T-test SPSS Results This is APA format for reporting Independent Ttest Results t(36) = 2. 324, p =. 026
Correlation Used with a continuous independent variable and a continuous dependent variable n Tests the strength of the association between the 2 variables n
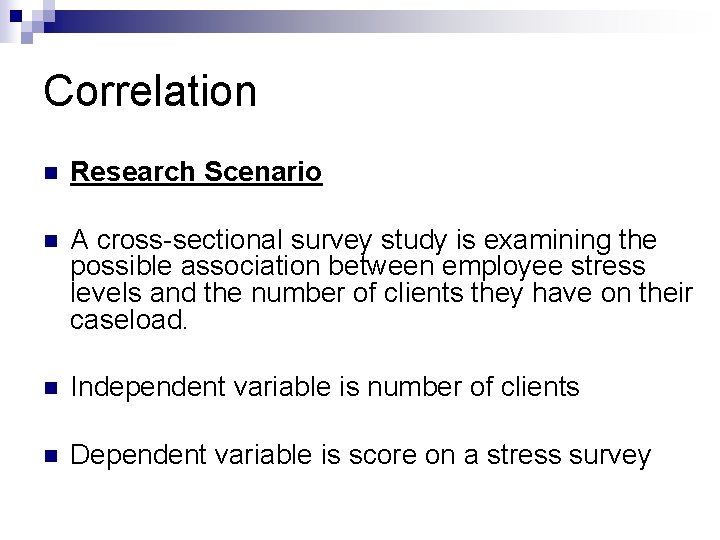
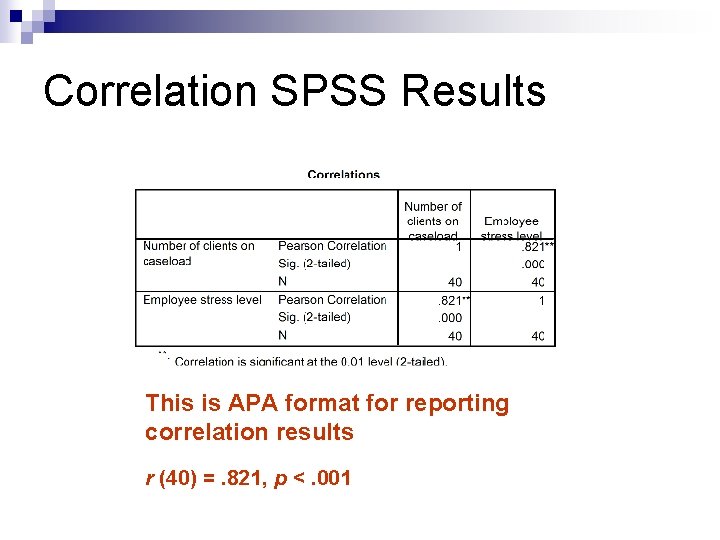
Correlation n Research Scenario n A cross-sectional survey study is examining the possible association between employee stress levels and the number of clients they have on their caseload. n Independent variable is number of clients n Dependent variable is score on a stress survey
Correlation SPSS Results This is APA format for reporting correlation results r (40) =. 821, p <. 001
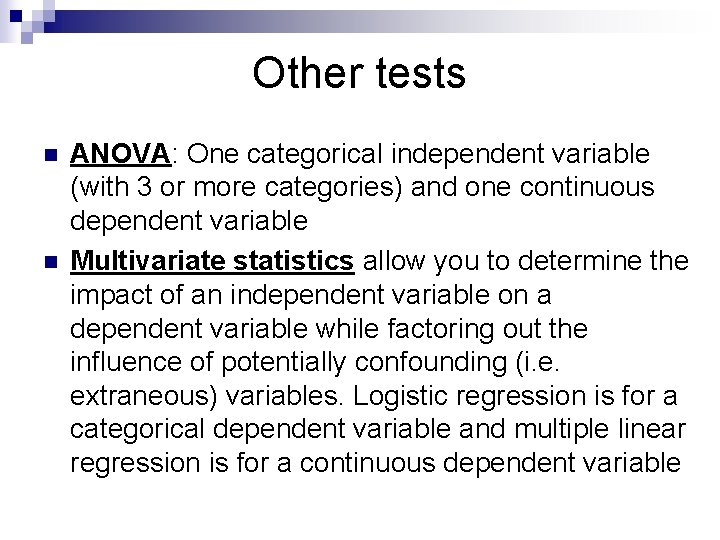
Other tests n n ANOVA: One categorical independent variable (with 3 or more categories) and one continuous dependent variable Multivariate statistics allow you to determine the impact of an independent variable on a dependent variable while factoring out the influence of potentially confounding (i. e. extraneous) variables. Logistic regression is for a categorical dependent variable and multiple linear regression is for a continuous dependent variable
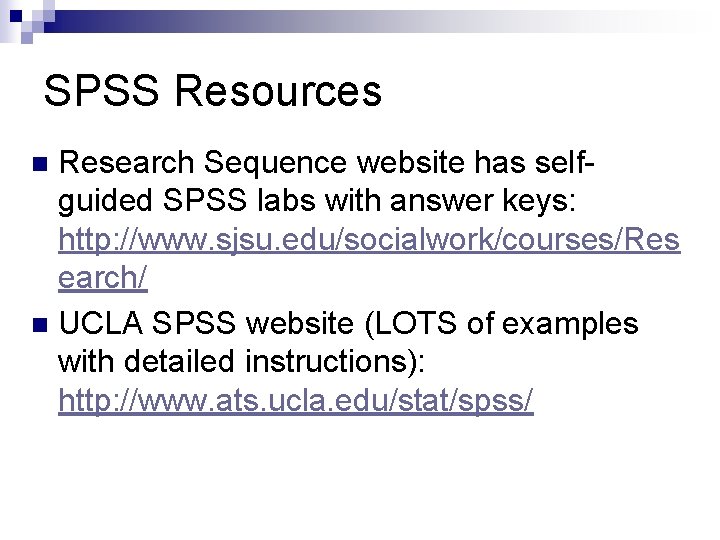
SPSS Resources Research Sequence website has selfguided SPSS labs with answer keys: http: //www. sjsu. edu/socialwork/courses/Res earch/ n UCLA SPSS website (LOTS of examples with detailed instructions): http: //www. ats. ucla. edu/stat/spss/ n