Salt River Verde River Watersheds Water Supply Update


 Oct-Nov 0. 03” -2. 56” Dec-Mar 2.")
 May 1 Storage (AF)")

 First month with above median")
 Salt/Verde ~")


- Slides: 16
Salt River & Verde River Watersheds Water Supply Update Stephen Flora, Senior Hydrologist ADWR Drought ICG Meeting - November 28, 2018
2
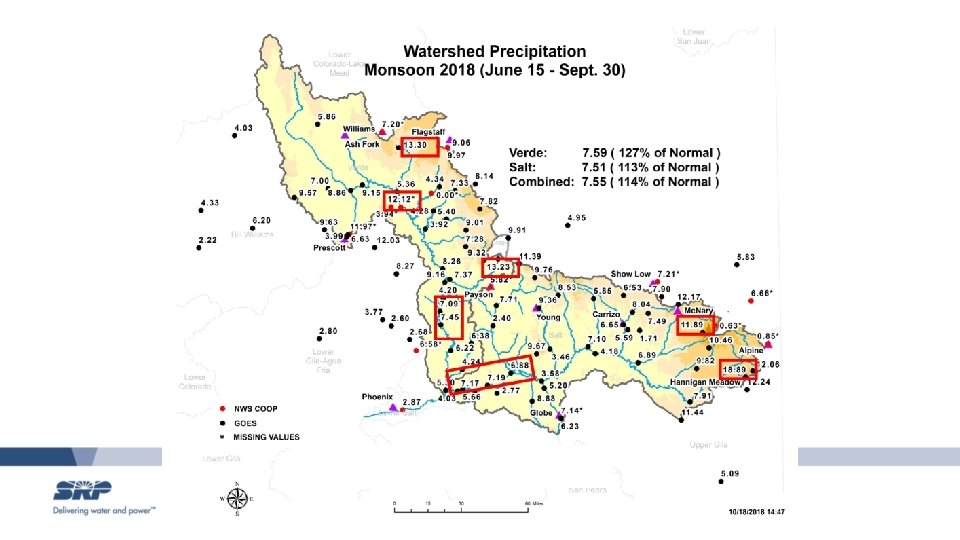
WY 2018: 10. 69” (57% of normal) Oct-Nov 0. 03” -2. 56” Dec-Mar 2. 85” -4. 88” Apr-Jun 0. 68” -0. 84” Jul-Sep 7. 13” +0. 73”
Salt and Verde River Winter Inflows Year Jan-May Inflow (AF) May 1 Storage (AF) May 1 Percent Full 2010 1, 419, 000 2, 311, 000 100 2011 223, 000 2, 006, 000 87 2012 196, 000 1, 512, 000 66 2013 449, 000 1, 453, 000 63 2014 148, 000 1, 300, 000 56 2015 328, 000 1, 314, 000 57 2016 338, 181 1, 307, 000 57 2017 970, 440 1, 731, 000 76 2018 100, 013* 1, 337, 000 58 *Winter 2018 Lowest Jan-May Inflow = 100, 013 AF (17% of median) 2018 Monsoon = 71, 881 AF (61% of median) WY 2018 Lowest WY Inflow (Oct 1 – Sept 30) = 240, 256 AF (28% of median) 2011 -2018 Lowest Inflow consecutive 8 -year period 1996 -2018 Lowest Inflow consecutive 23 -year period WY 2018 Streamflow
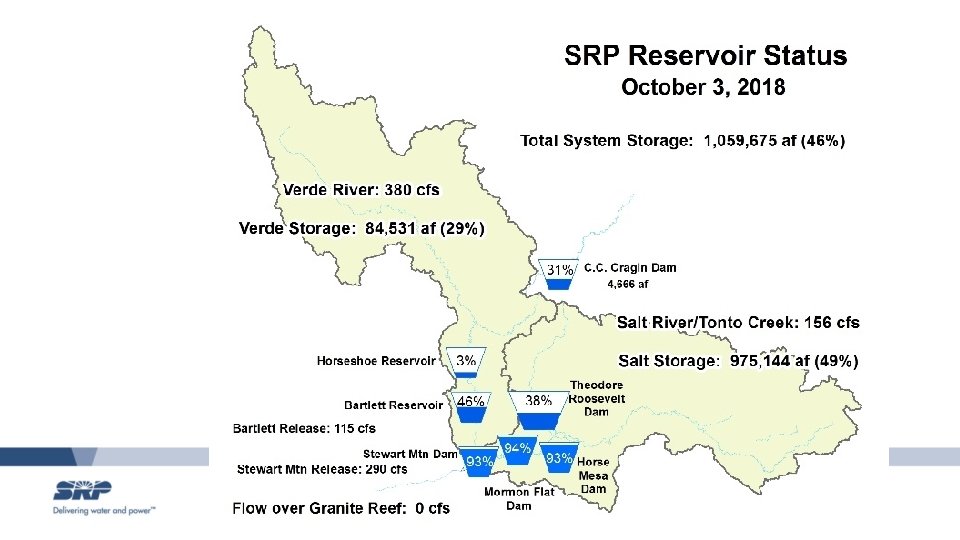
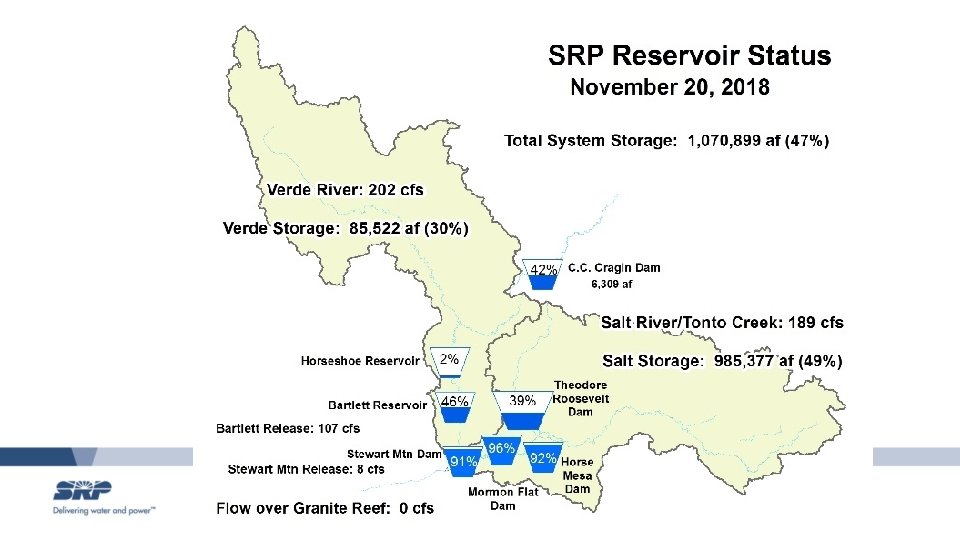
Assumptions Total Storage - SRP Reservoir System • Full allocation through 2018 (Demand = 800 kaf) • Total Demand = 800 kaf in 2019 and 2020 • Lower Quartile Runoff July 2018 through 2020 Groundwater (AF/Year) Surface Water (AF/Year) Projected End of Year Storage (KAF) Projected Percent Full (%) 2018 200, 000 600, 000 918 45 2019 275, 000 525, 000 936 46 2020 275, 000 525, 000 955 47 Storage (AF x 1000) 2000 1800 1600 1400 1200 1000 800 600 400 200 0 May 2016 PROP Jan-17 May 2017 PROP May-17 Sep-17 PROP May 2018 PROP Jan-18 May-18 Sep-18 Jan-19 Actual (with NCS) Project Reservoir Operations Plan (PROP) May-19 Sep-19 SRP Jan-20
October 2018= 46, 245 AF (170 % of median) First month with above median inflow this year!
Percent Normal Precipitation for October 2018 Salt, Tonto, and Verde Inflows (CFS) Salt/Verde ~ 325%
October 2018 Dec. 24 Jul. 10
6 Wettest Octobers since 1950 Water Year Oct. Precip. Dec. -Mar. Precip. Total Jan. -May Inflow (kaf) 1973 7. 89” 11. 14” 2, 297 2001 4. 53” 4. 24” 445 1960 4. 34” 8. 73” 866 2019 4. 03” ? . ? ? ” ? , ? ? ? 1975 3. 74” 5. 94” 683 1958 3. 57” 6. 50” 978
Two Week Outlook 7 -day precip. forecast 8 -14 Day Outlook
NOAA/Climate Prediction Center Precipitation Outlooks for December/January/February 42% chance of Above Normal 33% chance of Near Normal 25% chance of Below Normal 70% - 88% chance of winter El Nino!
Questions? Stephen Flora Senior Hydrologist Surface Water Resources
Planning Assumptions • • • 800, 000 AF -- full demand Demand mostly urban Up to 350, 000 AF -- maximum pumping (start earlier) Use revised allocation and pumping plan to manage for the 11 -year tree-ring drought (mega drought 1575 -1585) Planning for Drought (lower quartile inflows) An 11 -Year drought with 70 percent of historical gaged median inflow. Storage Planning Diagram Conjunctive water resource management plan for reservoir and pumping operations.