RISK POOLING 1 RISK POOLING System A Decentralized

 100 System B (Centralized Distribution) 200 500 150")


 100 +20 System B (Centralized Distribution) 200 -10 +20")


- Slides: 16
RISK POOLING 1
RISK POOLING System A (Decentralized Distribution) 100 System B (Centralized Distribution) 200 500 150 50 2
As Is Distribution Strategy = 97% service level = 3% stockout New Jersey Massachusetts Delivery Lead Time = 1 week Chicago 새 CEO는 7년전에 수립된 ACME의 Distribution Strategy를 바꿀 것을 고려하고 있음!!! 4
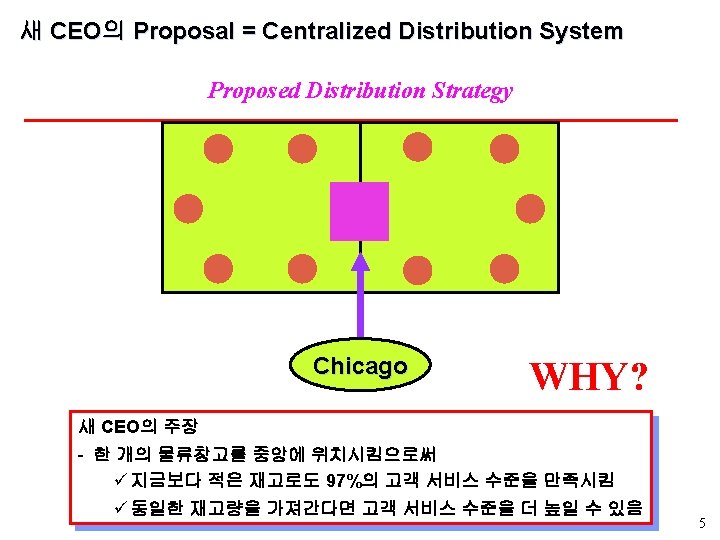
u Old Strategy Warehouse One Market One Warehouse Two Market Two Supplier u New Strategy Supplier Market One Warehouse Market Two 6
Intuition! System A (Decentralized Distribution) 100 +20 System B (Centralized Distribution) 200 -10 +20 -10 500 150 -20 50 +10 Inventory Re. Allocation -20 +10 7
현행 Distribution전략의 정점 New Jersey Massachusetts Delivery Lead Time = 1 week Chicago 두 개의 물류창고를 운영함으로써 고객에 대한 Delivery Effort를 감소시킬 수 있음!!! Chicago 8
Product A Product B 주 MA 1 2 3 4 5 6 7 8 33 45 37 38 55 30 18 58 NJ 46 35 41 40 26 48 18 55 Total 79 80 78 78 81 78 36 113 주 MA 1 2 3 4 5 6 7 8 0 2 3 0 0 1 3 0 NJ 2 4 0 0 3 1 0 0 Total 2 6 3 0 3 2 3 0 10
설명은 뒷 페이 지에 지역 제품 평균수요 표준편차 변동계수 MA MA NJ A B A 39. 3 1. 125 38. 6 13. 2 1. 36 12. 0 0. 34 1. 21 0. 31 NJ Total B A B 1. 25 77. 9 2. 375 1. 58 20. 71 1. 9 1. 26 0. 27 0. 81 11
지역 제 품 평균 수요 MA A 39. 3 13. 2 0. 34 MA B NJ A NJ Centr al B Centr al A B 표준 편차 변동 계수 안전 재주 재고 문점 주문 량 25. 0 8 65 132 91 1. 12 1. 36 1. 21 2. 58 5 4 25 15 131 88 24 15 186 132 26% 33 20 33% 22. 8 38. 6 12. 0 0. 31 62 0 1. 25 1. 58 1. 26 3 5 20. 7 39. 6 77. 9 0. 27 118 1 5 2. 37 5 1. 9 0. 81 3. 61 6 평균 Savings 재고 13
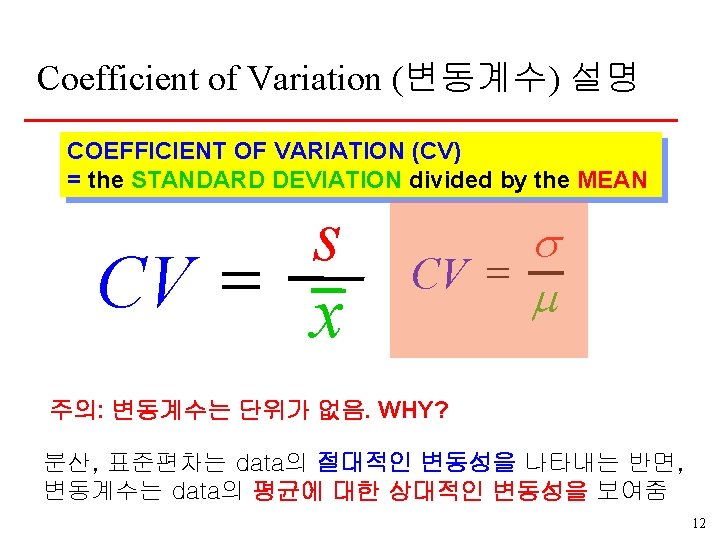
Is the Risk Pooling Strategy applicable in all circumstances? 1. 수요의 변동계수 (Coefficient of Variation)가 높으면 높을수록 Risk Pooling을 도입했을 때의 Benefit은 더 커짐. WHY? 변동계수 = 표준편차 / 평균 & 평균재고 = 안전재고( z) + Q/2 2. If demands are positively correlated, the Benefit from Risk Pooling disappears. WHY? + - + + - - - + + + - 15
De-centralized v. s. Centralized Distribution System 비교 항 목 Centralized Decentralized 안전재고 고객서비스 수준 경비 고객인도기간 수송비용 Outbound Inbound Risk Pooling 전략은 여러 다양한 형태로 구현 가능 : • Aggregate demands across locations • Aggregate demands across products 16