Overview of the DST Human Capital Development Strategy

- Slides: 18
Overview of the DST Human Capital Development Strategy Phethiwe Matutu TWG 10 February 2015
Contents • Human Capital Development (HCD) landscape • High-level HCD challenges • Key strategic responses • Way forward Presentation www. dst. gov. za 2
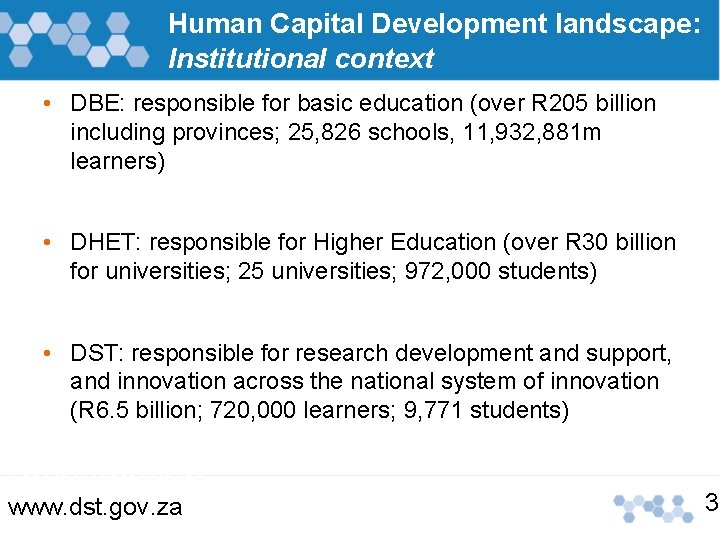
Human Capital Development landscape: Institutional context • DBE: responsible for basic education (over R 205 billion including provinces; 25, 826 schools, 11, 932, 881 m learners) • DHET: responsible for Higher Education (over R 30 billion for universities; 25 universities; 972, 000 students) • DST: responsible for research development and support, and innovation across the national system of innovation (R 6. 5 billion; 720, 000 learners; 9, 771 students) Presentation www. dst. gov. za 3
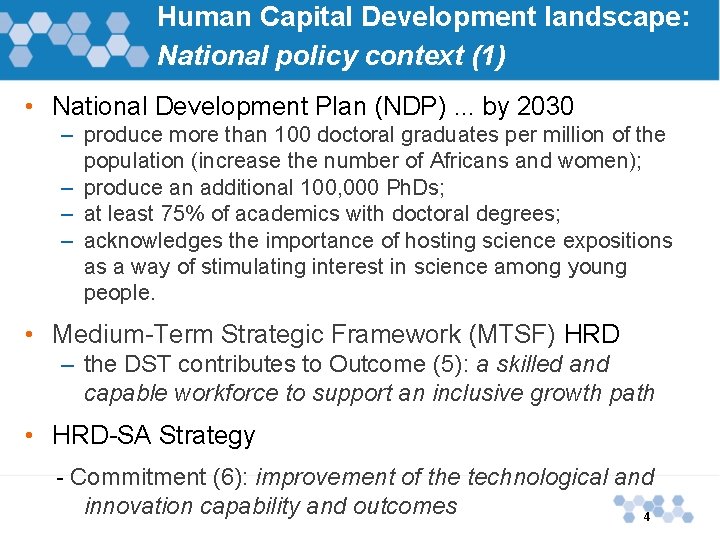
Human Capital Development landscape: National policy context (1) • National Development Plan (NDP). . . by 2030 – produce more than 100 doctoral graduates per million of the population (increase the number of Africans and women); – produce an additional 100, 000 Ph. Ds; – at least 75% of academics with doctoral degrees; – acknowledges the importance of hosting science expositions as a way of stimulating interest in science among young people. • Medium-Term Strategic Framework (MTSF) HRD – the DST contributes to Outcome (5): a skilled and capable workforce to support an inclusive growth path • HRD-SA Strategy - Commitment (6): improvement of the technological and innovation capability and outcomes 4
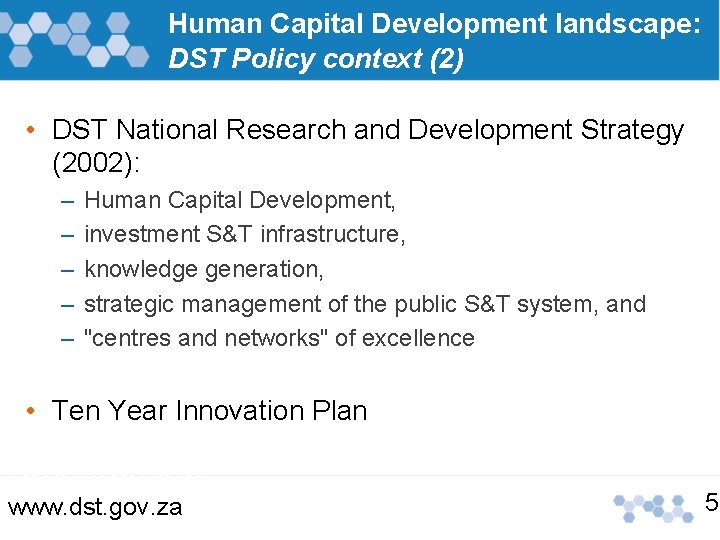
Human Capital Development landscape: DST Policy context (2) • DST National Research and Development Strategy (2002): – – – Human Capital Development, investment S&T infrastructure, knowledge generation, strategic management of the public S&T system, and "centres and networks" of excellence • Ten Year Innovation Plan Presentation www. dst. gov. za 5
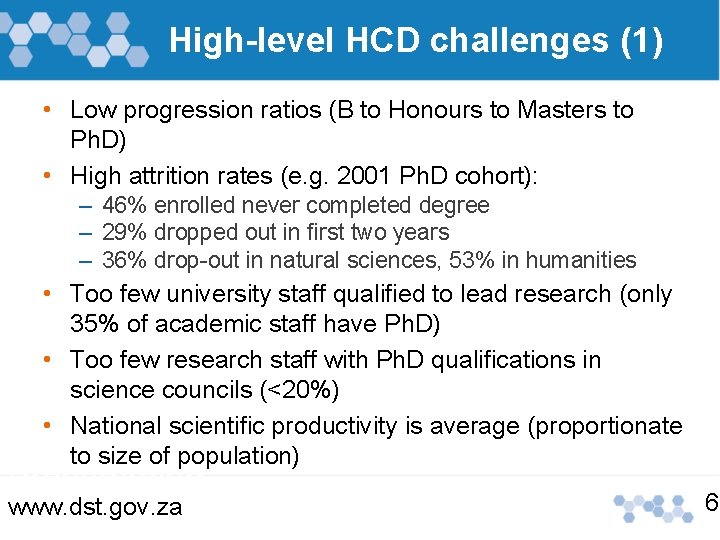
High-level HCD challenges (1) • Low progression ratios (B to Honours to Masters to Ph. D) • High attrition rates (e. g. 2001 Ph. D cohort): – 46% enrolled never completed degree – 29% dropped out in first two years – 36% drop-out in natural sciences, 53% in humanities • Too few university staff qualified to lead research (only 35% of academic staff have Ph. D) • Too few research staff with Ph. D qualifications in science councils (<20%) • National scientific productivity is average (proportionate to size of population) Presentation www. dst. gov. za 6
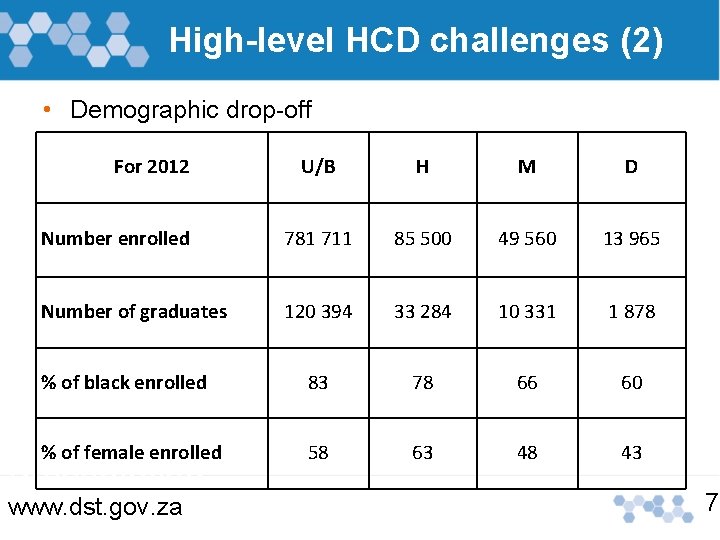
High-level HCD challenges (2) • Demographic drop-off For 2012 U/B H M D Number enrolled 781 711 85 500 49 560 13 965 Number of graduates 120 394 33 284 10 331 1 878 % of black enrolled 83 78 66 60 % of female enrolled 58 63 48 43 Presentation www. dst. gov. za 7
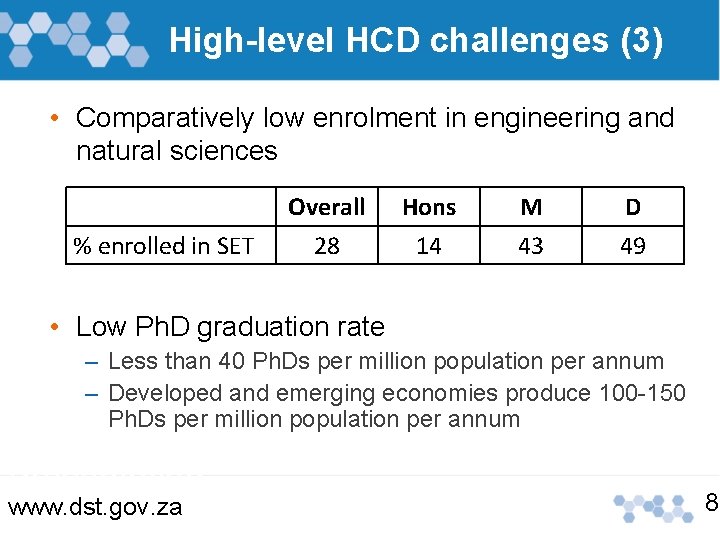
High-level HCD challenges (3) • Comparatively low enrolment in engineering and natural sciences % enrolled in SET Overall 28 Hons 14 M 43 D 49 • Low Ph. D graduation rate – Less than 40 Ph. Ds per million population per annum – Developed and emerging economies produce 100 -150 Ph. Ds per million population per annum Presentation www. dst. gov. za 8
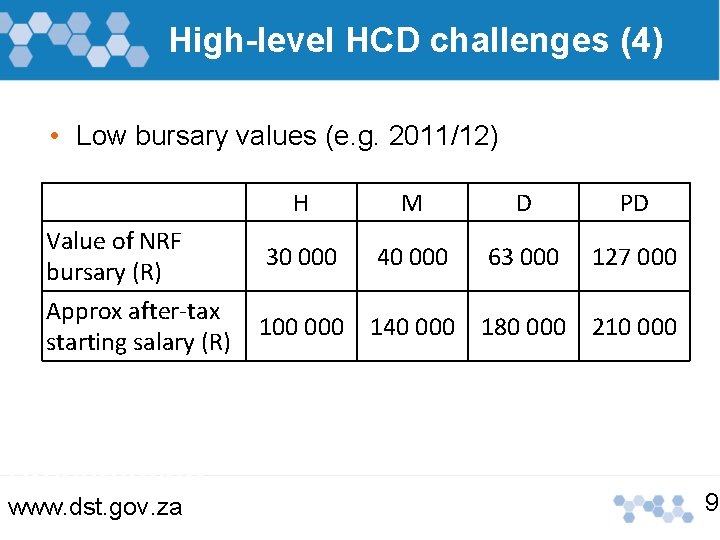
High-level HCD challenges (4) • Low bursary values (e. g. 2011/12) Value of NRF bursary (R) Approx after-tax starting salary (R) Presentation www. dst. gov. za H M D PD 30 000 40 000 63 000 127 000 100 000 140 000 180 000 210 000 9
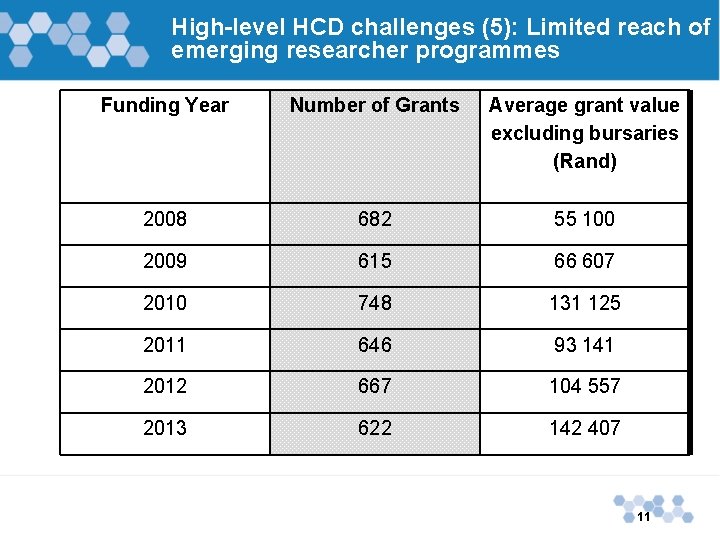
High-level HCD challenges (5): Limited reach of emerging researcher programmes Funding Year Number of Grants Average grant value excluding bursaries (Rand) 2008 682 55 100 2009 615 66 607 2010 748 131 125 2011 646 93 141 2012 667 104 557 2013 622 142 407 11
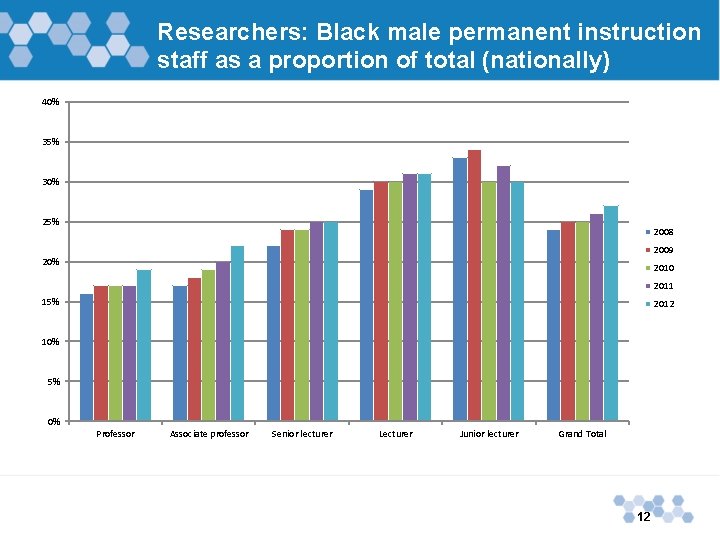
Researchers: Black male permanent instruction staff as a proportion of total (nationally) 40% 35% 30% 25% 2008 2009 20% 2010 2011 15% 2012 10% 5% 0% Professor Associate professor Senior lecturer Lecturer Junior lecturer Grand Total 12
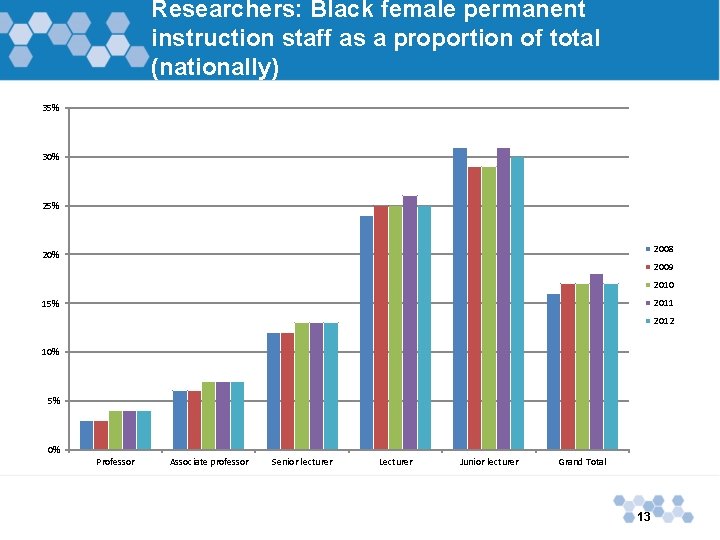
Researchers: Black female permanent instruction staff as a proportion of total (nationally) 35% 30% 25% 2008 20% 2009 2010 2011 15% 2012 10% 5% 0% Professor Associate professor Senior lecturer Lecturer Junior lecturer Grand Total 13
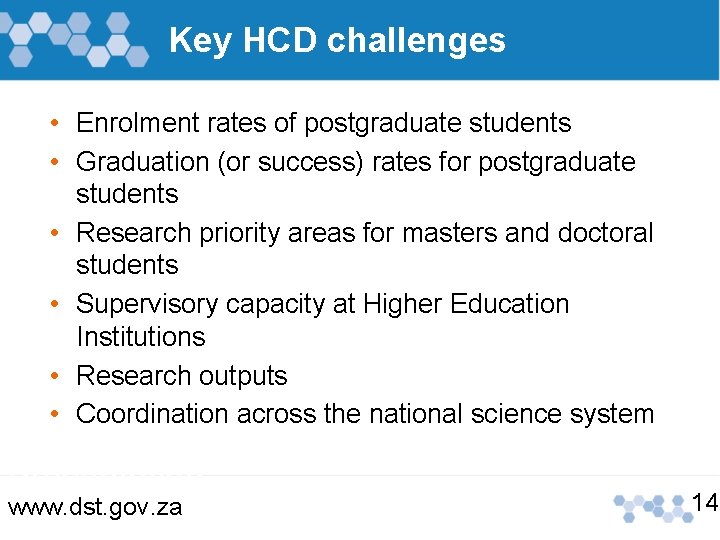
Key HCD challenges • Enrolment rates of postgraduate students • Graduation (or success) rates for postgraduate students • Research priority areas for masters and doctoral students • Supervisory capacity at Higher Education Institutions • Research outputs • Coordination across the national science system Presentation www. dst. gov. za 14
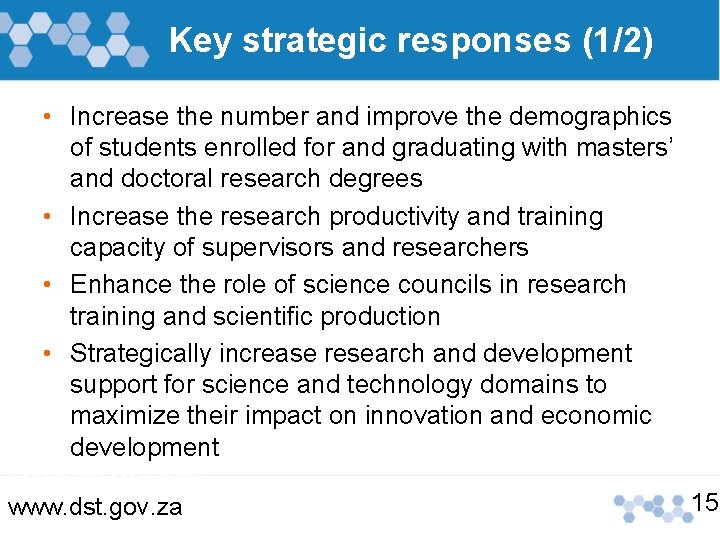
Key strategic responses (1/2) • Increase the number and improve the demographics of students enrolled for and graduating with masters’ and doctoral research degrees • Increase the research productivity and training capacity of supervisors and researchers • Enhance the role of science councils in research training and scientific production • Strategically increase research and development support for science and technology domains to maximize their impact on innovation and economic development Presentation www. dst. gov. za 15
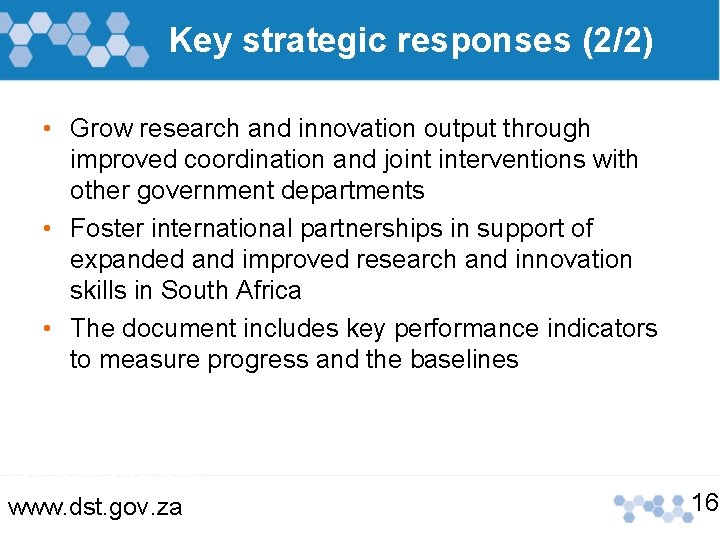
Key strategic responses (2/2) • Grow research and innovation output through improved coordination and joint interventions with other government departments • Foster international partnerships in support of expanded and improved research and innovation skills in South Africa • The document includes key performance indicators to measure progress and the baselines Presentation www. dst. gov. za 16
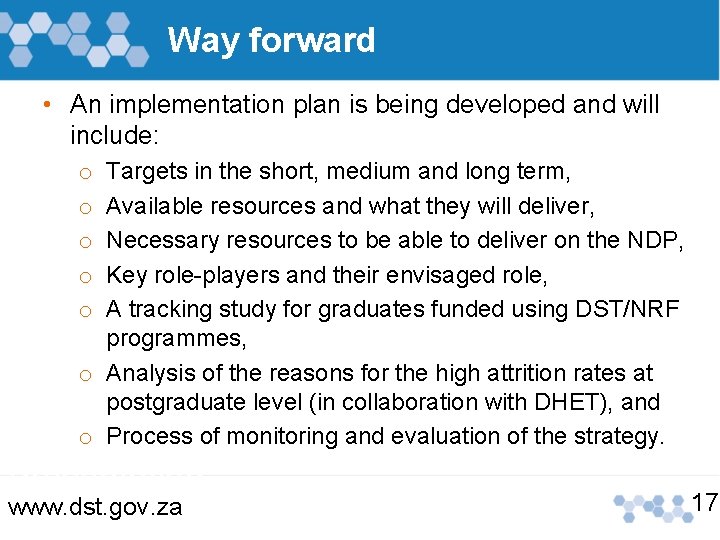
Way forward • An implementation plan is being developed and will include: Targets in the short, medium and long term, Available resources and what they will deliver, Necessary resources to be able to deliver on the NDP, Key role-players and their envisaged role, A tracking study for graduates funded using DST/NRF programmes, o Analysis of the reasons for the high attrition rates at postgraduate level (in collaboration with DHET), and o Process of monitoring and evaluation of the strategy. o o o Presentation www. dst. gov. za 17
Dankie Enkosi Ha khensa Re a leboga Ro livhuwa Siyabonga Siyathokoza Presentation www. dst. gov. za Thank you 18