NOTES 5 CH 1 3 CONTINUED DETECTING PHONY
- Slides: 19
NOTES #5 CH 1 -3 CONTINUED DETECTING PHONY DATA
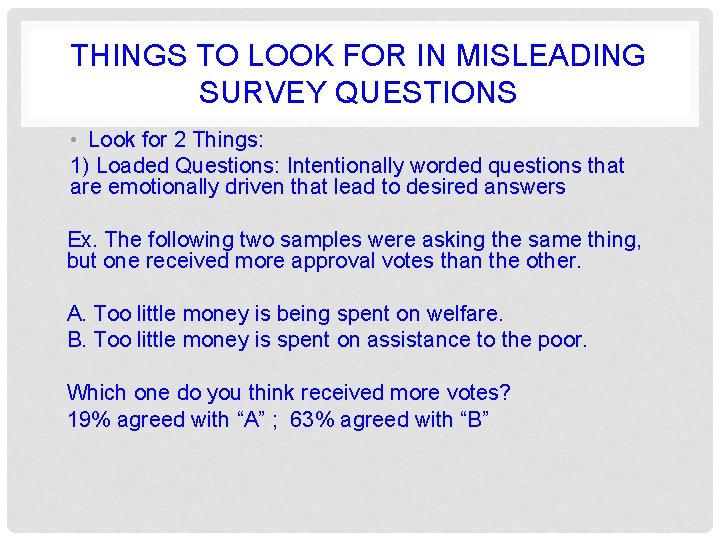
THINGS TO LOOK FOR IN MISLEADING SURVEY QUESTIONS • Look for 2 Things: 1) Loaded Questions: Intentionally worded questions that are emotionally driven that lead to desired answers Ex. The following two samples were asking the same thing, but one received more approval votes than the other. A. Too little money is being spent on welfare. B. Too little money is spent on assistance to the poor. Which one do you think received more votes? 19% agreed with “A” ; 63% agreed with “B”
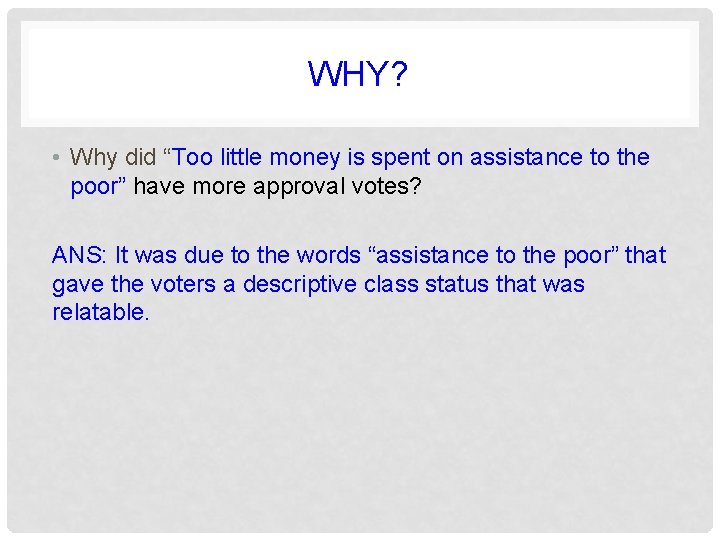
WHY? • Why did “Too little money is spent on assistance to the poor” have more approval votes? ANS: It was due to the words “assistance to the poor” that gave the voters a descriptive class status that was relatable.
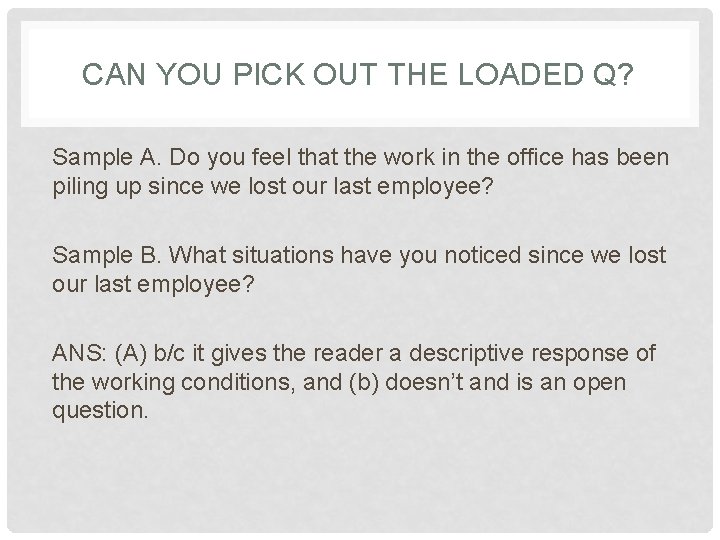
CAN YOU PICK OUT THE LOADED Q? Sample A. Do you feel that the work in the office has been piling up since we lost our last employee? Sample B. What situations have you noticed since we lost our last employee? ANS: (A) b/c it gives the reader a descriptive response of the working conditions, and (b) doesn’t and is an open question.
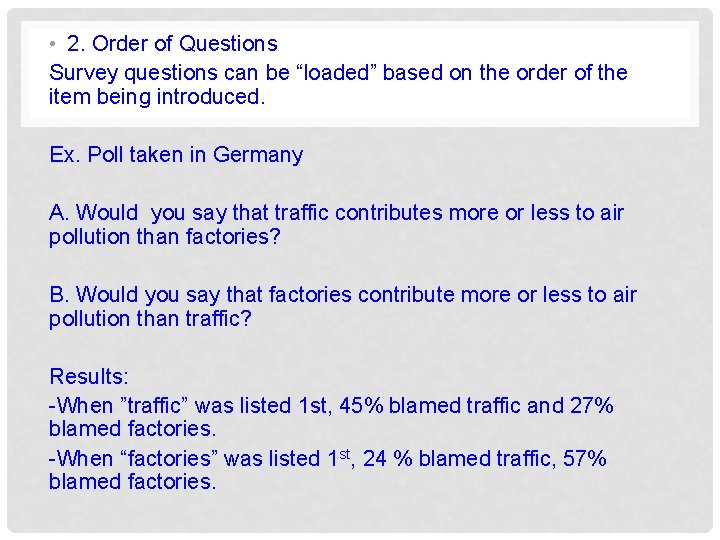
• 2. Order of Questions Survey questions can be “loaded” based on the order of the item being introduced. Ex. Poll taken in Germany A. Would you say that traffic contributes more or less to air pollution than factories? B. Would you say that factories contribute more or less to air pollution than traffic? Results: -When ”traffic” was listed 1 st, 45% blamed traffic and 27% blamed factories. -When “factories” was listed 1 st, 24 % blamed traffic, 57% blamed factories.
OTHER FACTORS THAT AFFECT STATISTICAL RESULTS OF A STUDY 1. Nonresponse - Refusing to answer a survey question or person not available to answer throws off final data results. - Ex. Hanging up when a telemarketer calls or after a completion of a service call. 2. Missing Data - Data can be missing at random, where findings to a study or survey is not entirely conclusive for the population being questioned. Ex. U. S. Census has missing data, due to missing people who are homeless or low income groups who do not have an address where the Census could be sent to.
SPOTTING FOR BIASES OR SPECIAL INTERESTS IN A STUDY OR SURVEY 4 Things to Look for 1. Self-Interest Studies - Surveys or studies that are sponsored by a specific party with an agenda or interest to promote. Ex. Drug companies paying doctors to conduct a study about the effectiveness of their new drugs and publishing results in world renown journals or info commercials. What is the problem with this? Conflict of interest due to doctors being paid by a company that created the drug.
• 2. Precise Numbers - Figure that are very precise can make people incorrectly assume that the number is also accurate. • Ex. “There are now 103, 215, 027 households in the U. S. ” is more of an estimate, and should not be taken as a precise count. • Solution to the problem: Stating “the number of households is about 103 million” would have been more honest and better.
3. Partial Pictures - Claims that are misleading and not presenting the complete results. Ex. “Ninety percent of all our cars sold in this country in the last 10 years are still on the road. ” Problem with the claim? ANS: Consumers were impressed; however, the dealer failed to mention that 90% of the cars that the dealer sold were in the last 3 years. So of course your cars should still be on the road, the cars are still relatively new!
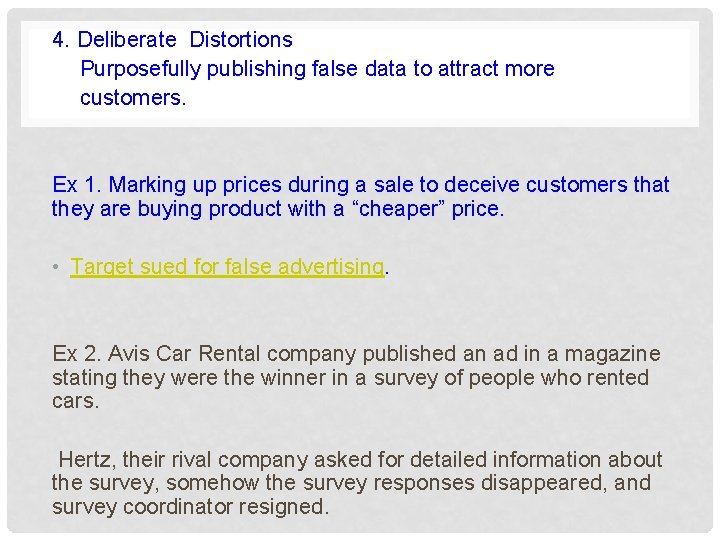
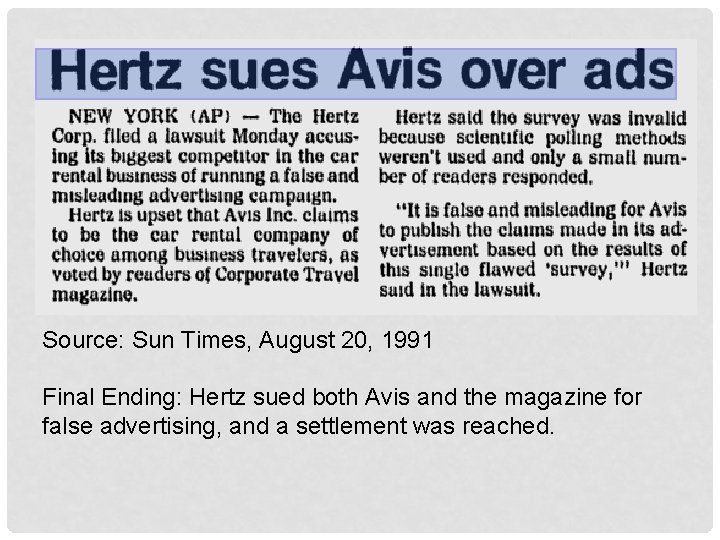
4. Deliberate Distortions Purposefully publishing false data to attract more customers. Ex 1. Marking up prices during a sale to deceive customers that they are buying product with a “cheaper” price. • Target sued for false advertising. Ex 2. Avis Car Rental company published an ad in a magazine stating they were the winner in a survey of people who rented cars. Hertz, their rival company asked for detailed information about the survey, somehow the survey responses disappeared, and survey coordinator resigned.
Source: Sun Times, August 20, 1991 Final Ending: Hertz sued both Avis and the magazine for false advertising, and a settlement was reached.
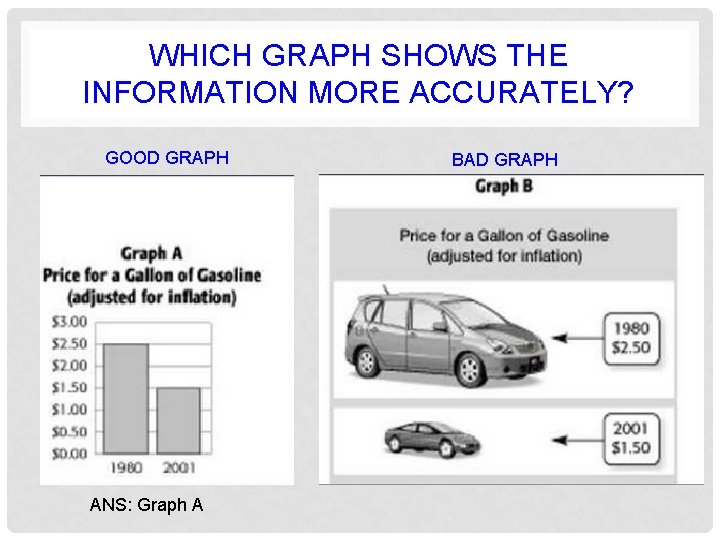
MISLEADING PICTOGRAPHS What is a pictograph? ANS: A pictograph is a drawing of an object meant to represent and depict data.
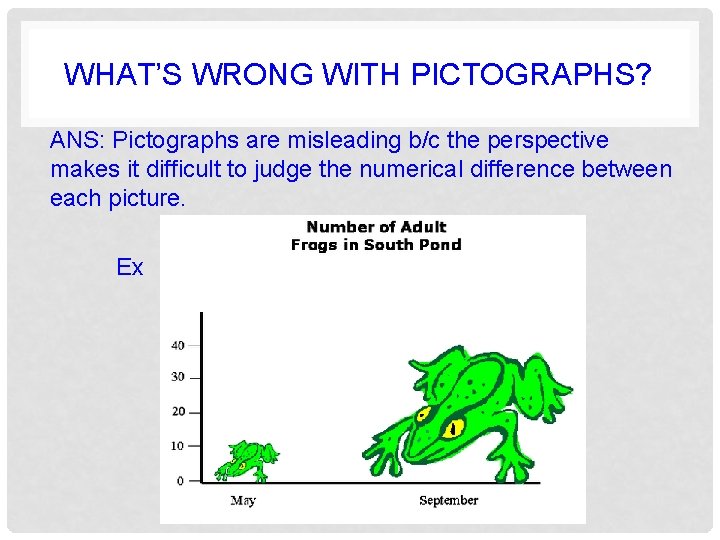
WHAT’S WRONG WITH PICTOGRAPHS? ANS: Pictographs are misleading b/c the perspective makes it difficult to judge the numerical difference between each picture. Ex
WHICH GRAPH SHOWS THE INFORMATION MORE ACCURATELY? GOOD GRAPH ANS: Graph A BAD GRAPH
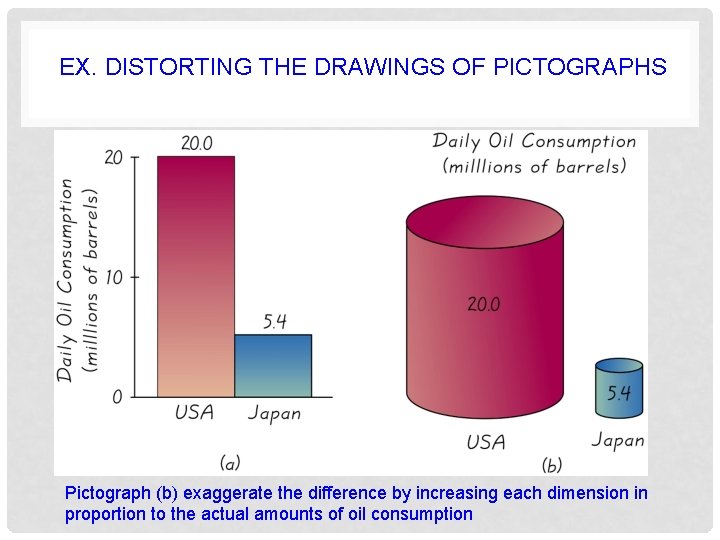
EX. DISTORTING THE DRAWINGS OF PICTOGRAPHS Pictograph (b) exaggerate the difference by increasing each dimension in proportion to the actual amounts of oil consumption
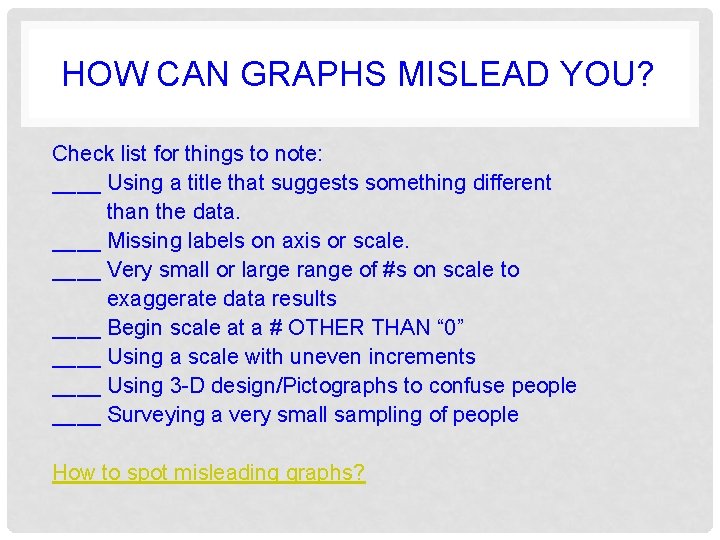
HOW CAN GRAPHS MISLEAD YOU? Check list for things to note: ____ Using a title that suggests something different than the data. ____ Missing labels on axis or scale. ____ Very small or large range of #s on scale to exaggerate data results ____ Begin scale at a # OTHER THAN “ 0” ____ Using a scale with uneven increments ____ Using 3 -D design/Pictographs to confuse people ____ Surveying a very small sampling of people How to spot misleading graphs?
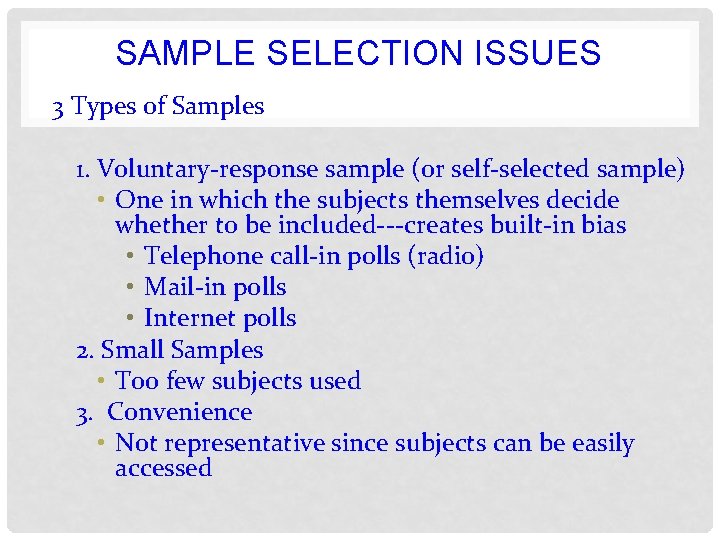
SAMPLE SELECTION ISSUES 3 Types of Samples 1. Voluntary-response sample (or self-selected sample) • One in which the subjects themselves decide whether to be included---creates built-in bias • Telephone call-in polls (radio) • Mail-in polls • Internet polls 2. Small Samples • Too few subjects used 3. Convenience • Not representative since subjects can be easily accessed
CLASSWORK • Finish Misleading Data Gallery Walk Chart • #1 to #9
HW • Ch 1 -3 Review Wksht • Quiz on Notes (#3 -#5)