Neuronal adaptation Jagat Ramdin Neuromorpho org Neuromorpho org


- Slides: 13
Neuronal adaptation Jagat Ramdin
Neuromorpho. org • Neuromorpho. org is a regularly updated online database of neurons of many species and brain reasons. • Because it is free to access, if one wishes to take data or images, it can easily be done.
Acquiring the Data • The goal of this exercise was to consolidate data on the most commonly gathered brain regions from humans. Only pyramidal neurons were examined. • The regions chosen were the top four found: • 1) Prefrontal Cortex -392 entries • 2) Parietal Lobe -100 entries • 3)Anterior Cingulate -20 entries • 4) Fronto-Insula -16 entries • Total entries: 528 neurons
Data analysis • Using WEKA, through a combination of different classification programs, the following was generated:
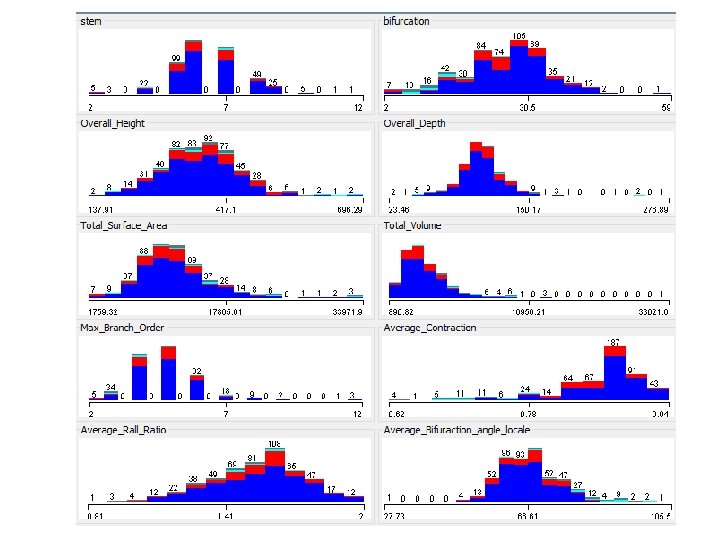
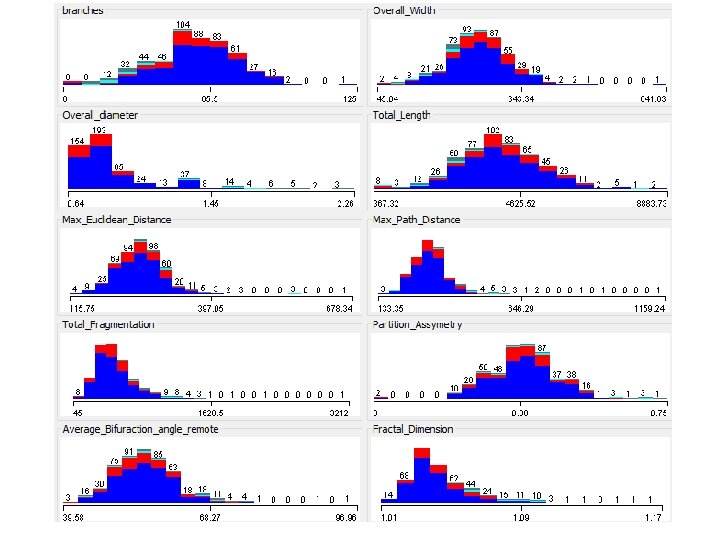
Histograms • The next slides will show histograms based on the 20 attributes recorded by the experimenters who submitted these neurons
• There was very little variation in these histograms. Despite the dark blue, prefrontal cortex data being the most abundant, there is no outstanding attributes to any of these 4 brain region’s pyramidal neurons. • It should be noted that some of the Anterior Cingulate neurons were the most prevalent in terms of outliers when the category referenced length or size. • More data from this region is necessary to make claim, however.
Clusters based on 20 attributes
• The circles and black lines were done via paint. • This was purely to illustrate the groups for the audience and highlight the lack of clusters for group 2. • X axis is the actual group while Y axis is the predicted group from a classifier.
• The previous graph shows that prefrontal and parietal lobe neurons are near indistinguishable. While it appears unhelpful, it emphasizes just how much the frontal and parietal lobes communicate. The prefrontal cortex is responsible for high end cognitive functions while the parietal lobe collates information from different sensory systems; touch, sight, etc.
• While the blue and red near the front of the brain, the green and light blue are deeper in. These two brain areas rarely clashed with the blue and red areas in terms of being misclassified together. • This suggests that it isn’t function that causes neurons to differentiate, but its neighbors who it connects to instead. • That being said, there is far too little on the green and light blue regions to make any affirmative statement.
Future research • Rather than humans, use of primate or rats with humans to determine if empirical data is proportional to substitute for humans. • Waiting for or performing research in other brain areas to gather more data on neurons that are not researched as often.