Moving Towards Predictive Policing Professor Shane D Johnson

- Slides: 25
Moving Towards Predictive Policing Professor Shane D Johnson UCL Department of Security and Crime Science shane. johnson@ucl. ac. uk
Predicting future patterns • Questions we might ask – How many burglaries are expected in the next few days? – Bursty analysis (Johnson et al. , 2012)? – Self-exciting Point Process? – What is likely to be stolen (Bowers & Johnson, 2012)? – Where will burglaries most likely next occur? – What is the relative risk within an area for (say) the next seven days – By day/night
Overview • Spatial patterns (risk heterogeneity) – Patterns and predictors at the street segment level • Space-time clustering (event dependency) – What happens in the wake of an offense? – Point level analysis • Collaboration with West Midlands Police – Combining the approaches to analysis • Displacement?
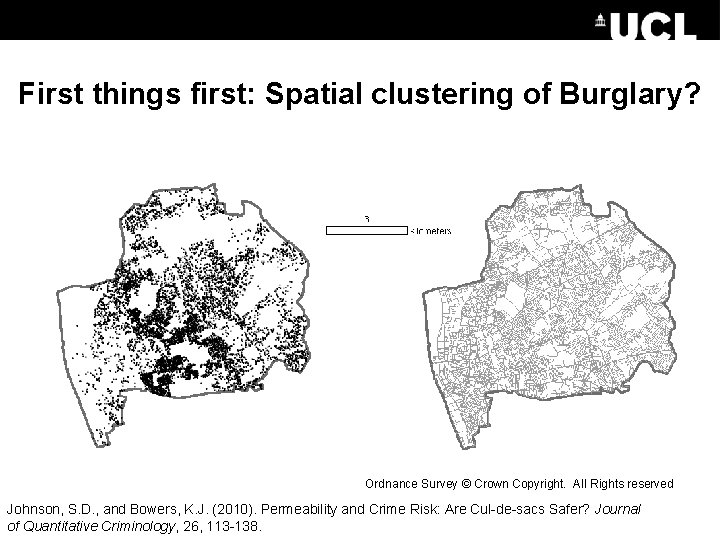
First things first: Spatial clustering of Burglary? Ordnance Survey © Crown Copyright. All Rights reserved Johnson, S. D. , and Bowers, K. J. (2010). Permeability and Crime Risk: Are Cul-de-sacs Safer? Journal of Quantitative Criminology, 26, 113 -138.
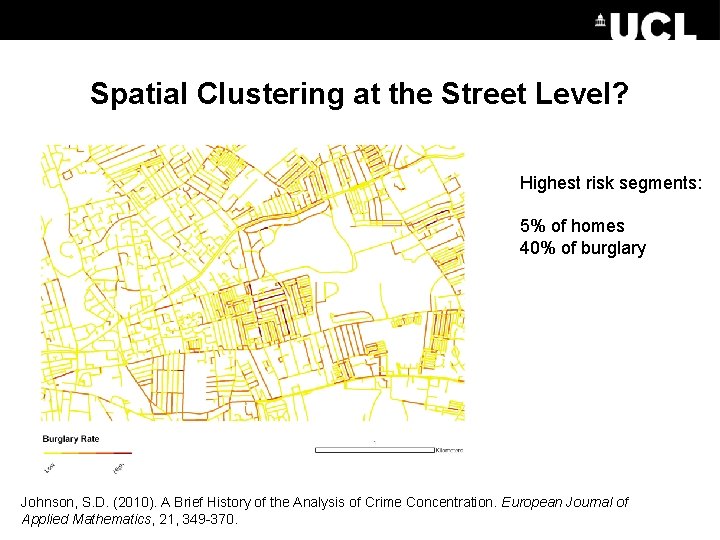
Spatial Clustering at the Street Level? Highest risk segments: 5% of homes 40% of burglary Johnson, S. D. (2010). A Brief History of the Analysis of Crime Concentration. European Journal of Applied Mathematics, 21, 349 -370.
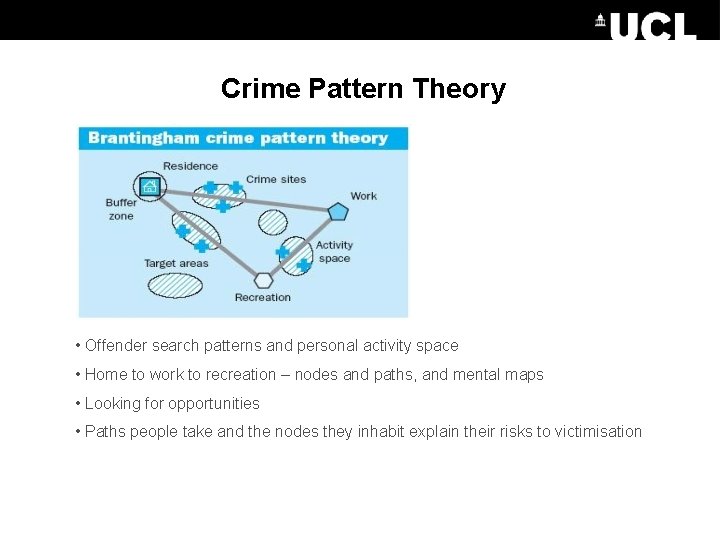
Crime Pattern Theory • Offender search patterns and personal activity space • Home to work to recreation – nodes and paths, and mental maps • Looking for opportunities • Paths people take and the nodes they inhabit explain their risks to victimisation
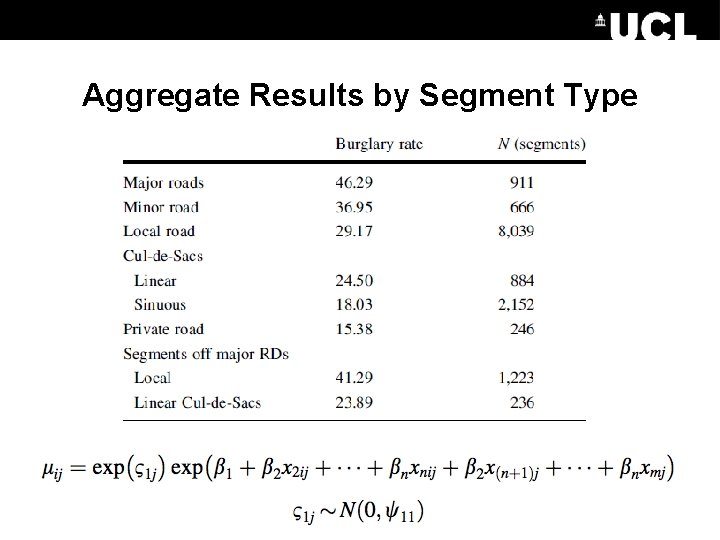
Hypotheses H 1 – the risk of burglary will be greater on Major roads and those intended to be most frequently used H 2 – the risk of burglary will be highest on the most connected streets, particularly those connected to major roads H 3 - the risk of burglary will be lower in cul-de-sacs and, in particular, in those that are non-linear Johnson, S. D. , and Bowers, K. J. (2010). Permeability and Crime Risk: Are Cul-de-sacs Safer? Journal of Quantitative Criminology, 26, 113 -138.
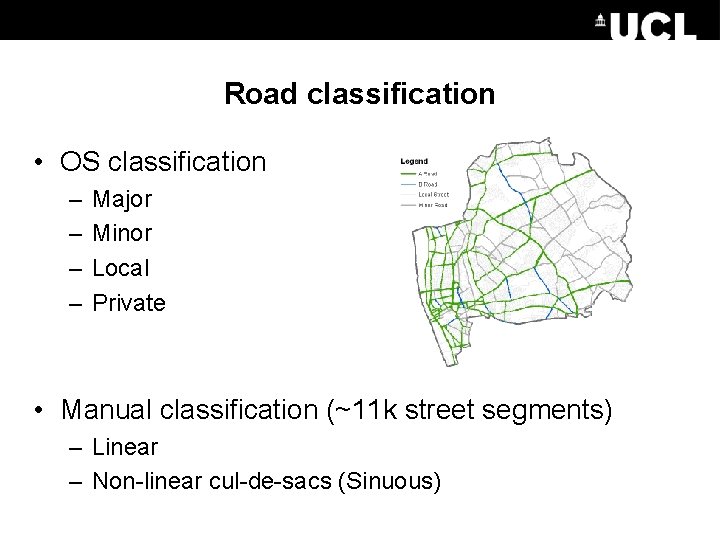
Road classification • OS classification – – Major Minor Local Private • Manual classification (~11 k street segments) – Linear – Non-linear cul-de-sacs (Sinuous)
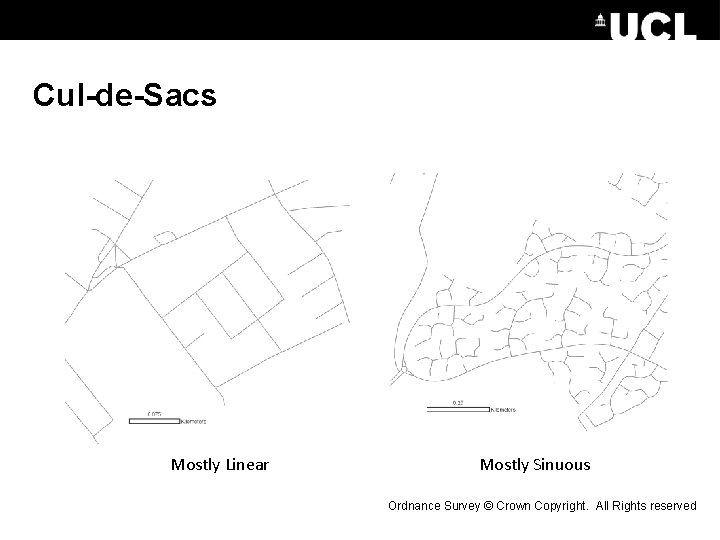
Cul-de-Sacs Mostly Linear Mostly Sinuous Ordnance Survey © Crown Copyright. All Rights reserved
Aggregate Results by Segment Type
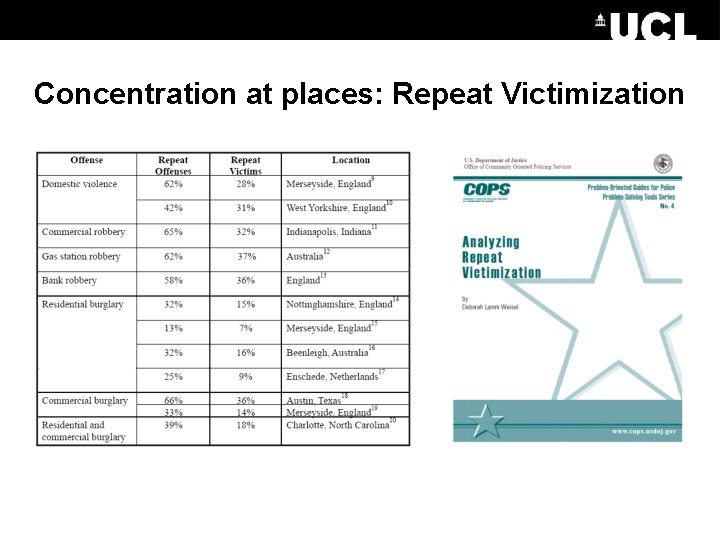
Concentration at places: Repeat Victimization
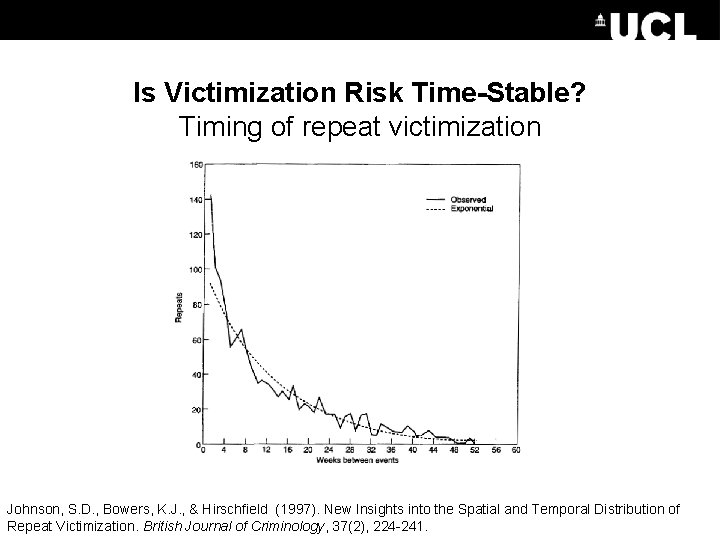
Is Victimization Risk Time-Stable? Timing of repeat victimization Johnson, S. D. , Bowers, K. J. , & Hirschfield (1997). New Insights into the Spatial and Temporal Distribution of Repeat Victimization. British Journal of Criminology, 37(2), 224 -241.
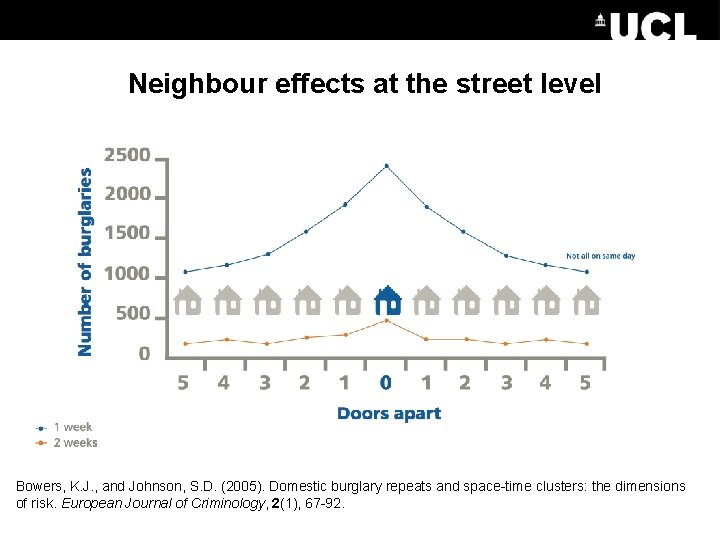
Explaining Repeat Victimisation Boost Account • Repeat victimisation is the work of a returning offender • Optimal foraging Theory (Johnson & Bowers, 2004) - maximising benefit, minimising risk and keeping search time to a minimum– repeat victimisation as an example of this – burglaries on the same street in short spaces of time would also be an example of this • Consider what happens in the wake of a burglary – To what extent is risk to non-victimised homes shaped by an initial event?
Neighbour effects at the street level Bowers, K. J. , and Johnson, S. D. (2005). Domestic burglary repeats and space-time clusters: the dimensions of risk. European Journal of Criminology, 2(1), 67 -92.
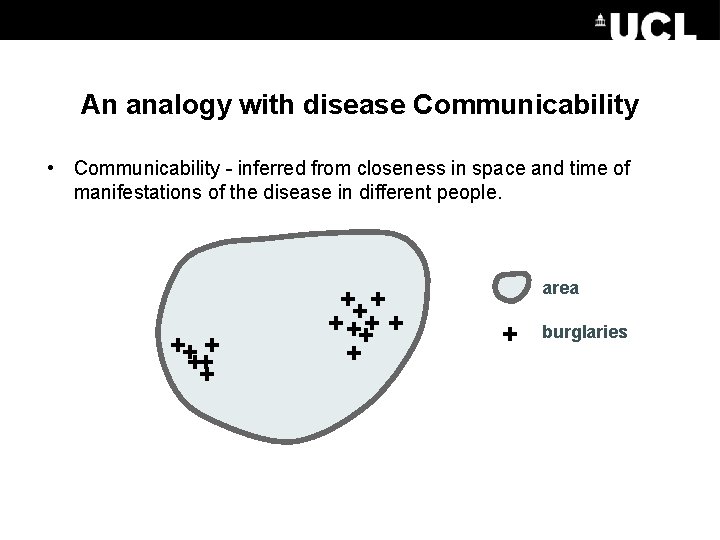
An analogy with disease Communicability • Communicability - inferred from closeness in space and time of manifestations of the disease in different people. ++ + + +++ + + area + burglaries
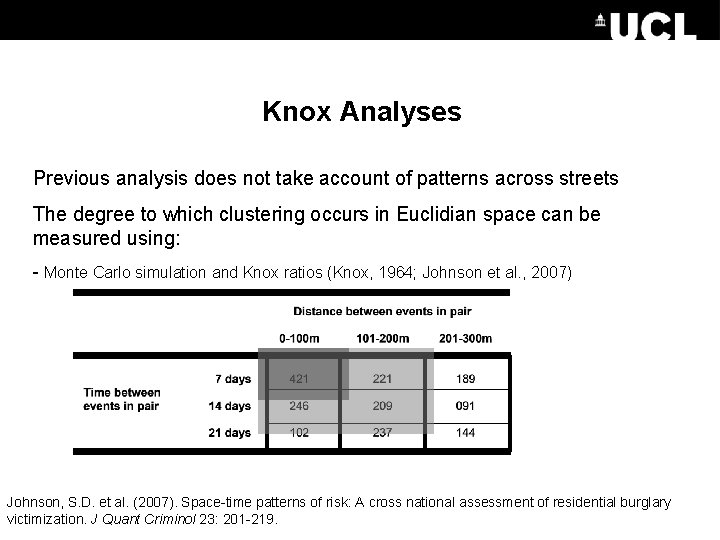
Knox Analyses Previous analysis does not take account of patterns across streets The degree to which clustering occurs in Euclidian space can be measured using: - Monte Carlo simulation and Knox ratios (Knox, 1964; Johnson et al. , 2007) Johnson, S. D. et al. (2007). Space-time patterns of risk: A cross national assessment of residential burglary victimization. J Quant Criminol 23: 201 -219.
Patterns in detection data? For pairs of crimes: – Those that occur within 100 m and 14 days of each other, 76% are cleared to the same offender – Those that occur within 100 m and 112 days or more of each other, only 2% are cleared to the same offender Johnson, S. D. , Summers, L. , Pease, K. (2009). Offender as Forager? A Direct Test of the Boost Account of Victimization. Journal of Quantitative Criminology, 25, 181 -200.
Near Repeats – Foraging What do offenders say? “If this area I didn’t get caught in, I earned enough money to see me through the day then I’d go back the following day to the same place. If I was in, say, that place and it came on top, and by it came on top I mean I was seen, I was confronted, I didn’t feel right, I’d move areas straight away …” (P 02) “The police certainly see a pattern, don’t they, so even a week’s a bit too long. Basically two or three days is ideal, you just smash it and then move on … find somewhere else and then just repeat it, and then the next area …” (RC 02) Summers, L. , Johnson, S. D. , & Rengert, G. (2010) The Use of Maps in Offender Interviewing. In W. Bernasco (Ed. ) Offenders on Offending. Willan.
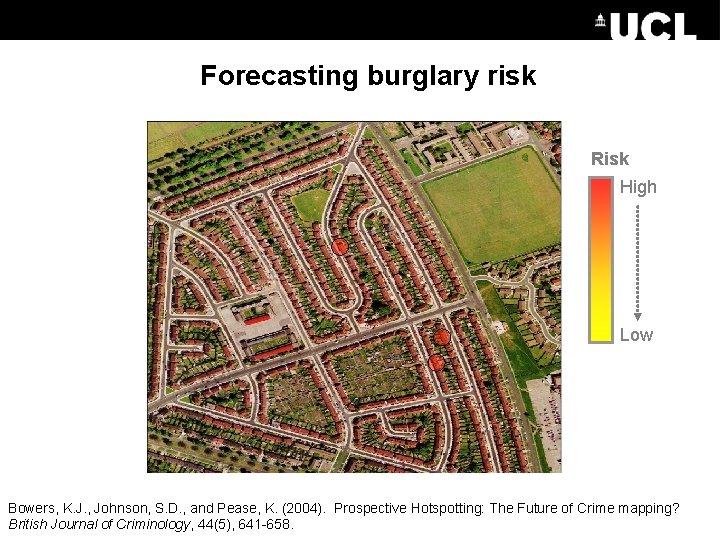
Forecasting burglary risk Risk High Low Bowers, K. J. , Johnson, S. D. , and Pease, K. (2004). Prospective Hotspotting: The Future of Crime mapping? British Journal of Criminology, 44(5), 641 -658.
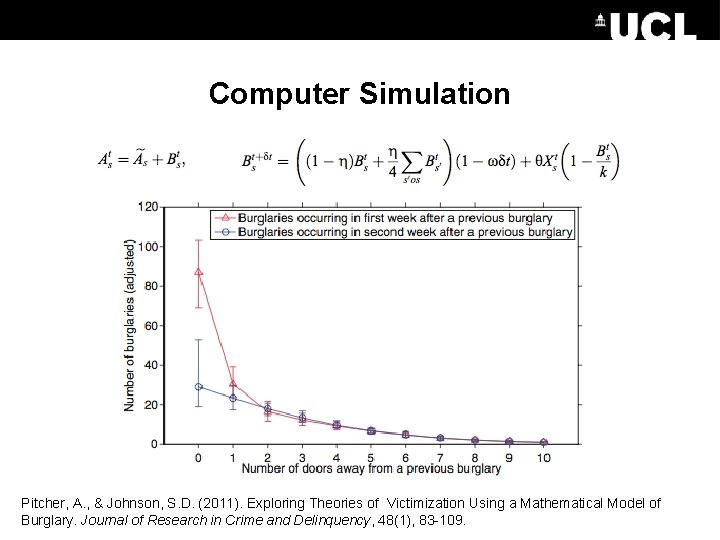
Computer Simulation Pitcher, A. , & Johnson, S. D. (2011). Exploring Theories of Victimization Using a Mathematical Model of Burglary. Journal of Research in Crime and Delinquency, 48(1), 83 -109.
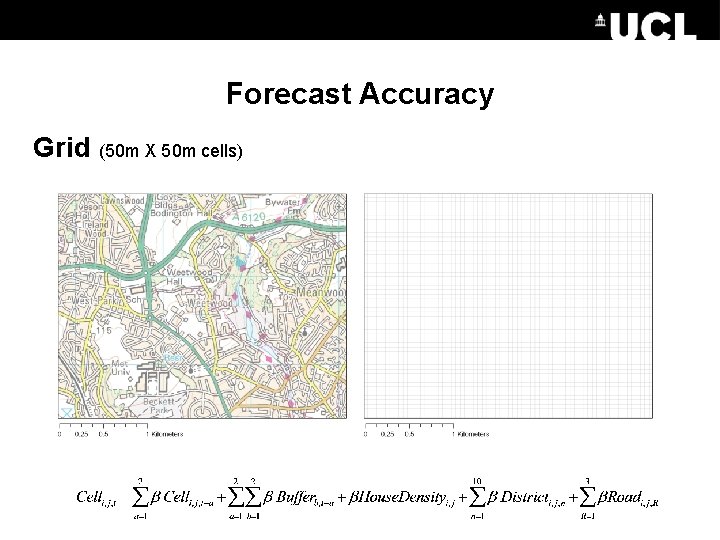
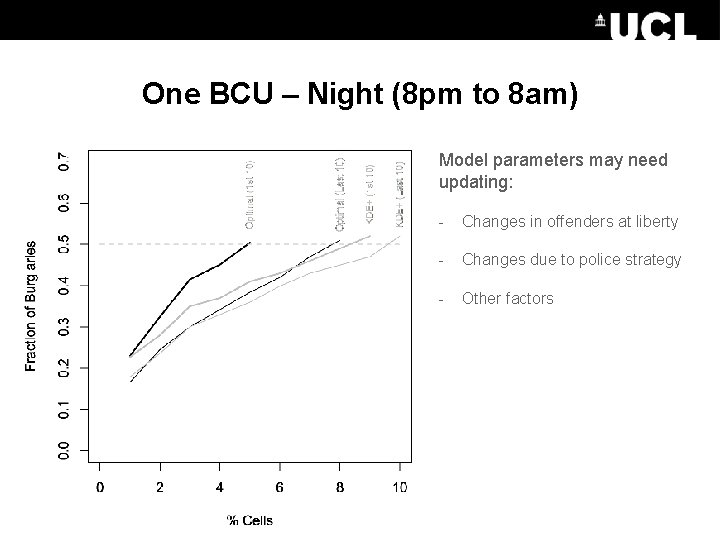
Forecast Accuracy Grid (50 m X 50 m cells)
One BCU – Night (8 pm to 8 am) Model parameters may need updating: - Changes in offenders at liberty - Changes due to police strategy - Other factors
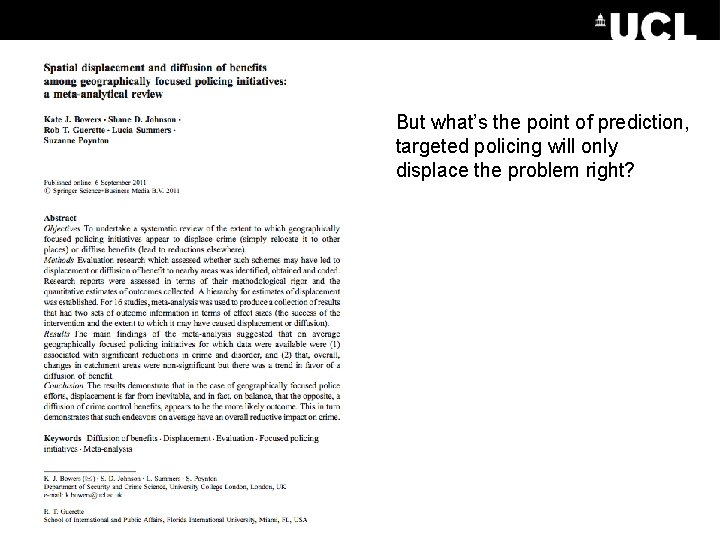
But what’s the point of prediction, targeted policing will only displace the problem right?
Summary and Combining the Approaches • Triangulation across methods • Burglary more likely at more connected segments – Analyses ignore patterns over time • Risk of crime temporarily elevated around victimized homes (predictable in space-time) – Topology of the street network ignored – Units of analysis “cells” not street segments • West Midlands Police and UCL Dept SCS Collaboration (Toby Davies) – Does risk diffuse along the street network in predictable ways? – Is risk more likely to be diffused along certain types of segment? – Other offence types – Randomized Controlled Trial