Moscow State University Russia Faculty of physics and

")


 Reflected IR")


- Slides: 20
Moscow State University, Russia Faculty of physics and International Laser Center RAMAN AND ATR FTIR SPECTROSCOPY IN THE STUDY OF CHEMICAL REACTION RATES I. A. Balakhnina, N. N. Brandt, A. Yu. Chikishev, A. A. Mankova, I. G. Shpachenko
How to measure reaction rate? Reaction rate = Rate of changes in reagent (product) concentration Optical methods Disadvantages PHOTOMETRY Overlapping absorption bands POLARIMETRY Optically active substrate or product FLUORIMETRY Overlapping absorption bands and concentrational limitations Universal method is unavailable Experimentally prove the applicability of vibrational spectroscopy in the Task: measurements of chemical reaction rates
Reaction of alkaline hydrolysis of ethyl acetate: Raman spectroscopy of the components Frequency сm-1 Component 637 852 880 929 1345 1413 CH 3 COOC 2 H 5 OH CH 3 COOK 1453 CH 3 COOC 2 H 5 , C 2 H 5 OH 1736 CH 3 COOC 2 H 5 Raman spectrum of the reaction and its approximation with linear combination of Raman spectra of the components: ethyl acetate (CH 3 COOC 2 H 5), ethanol (C 2 H 5 OH) , potassium acetate (CH 3 COOK), and KOH.
Processing of Raman data series Intensity kinetics Reaction rate k
Effect of background subtraction and scaling
Temperature dependence of reaction rates k, М-1 с-1 Raman spectra of the reaction mixture (hydrolysis of ethyl acetate), measured at 14 -2110 s from the beginning of reaction at a temperature of 22 °C 22°С 42°С 0, 048± 0, 004 0, 28± 0, 02 Time dependence of the integral Raman intensity of the band at 880 cm-1 measured at different temperatures An increase in temperature leads to an increase in reaction rate
Reaction rate and activation energy А – const Reaction rates of ethyl acetate hydrolysis at different temperatures
Reaction rate and activation energy
Reaction rates of alkaline hydrolysis of ethyl acetate determined using different spectral lines Time dependences of Raman intensity of the bands at 880, 929, and 852 сm-1 at a temperature of 25 °C and their approximations Raman spectra of the reaction of ethyl acetate hydrolysis, measured at 20 -600 seconds from the beginning of reaction at a temperature of 25 °C Mean value of the reaction rate is k = 0, 088 ± 0, 006 M-1 s-1
Raman spectroscopy of spontaneous and enzymatic hydrolysis 14°С p. H 7, 8 Enzymatic hydrolysis: Raman spectra of the reaction of enzymatic hydrolysis of 2, 4 -dinitrophenylacetate (DNPA) in the presence of chymotrypsin, measured at 100 s - 260 min from the beginning of reaction Spontaneous hydrolysis: KM = (39, 55± 0, 01)10 -4 M kh = (1, 26± 0, 01)10 -5 s-1 S – substrate; E – enzyme; P – product; ES – enzyme-substrate complex
ATR FTIR geometry Evanescent wave Incident IR light d ATR crystal (diamond) Reflected IR light
Reaction of alkaline hydrolysis of ethyl acetate: ATR FTIR spectroscopy of the components ATR FTIR spectrum of the reaction mixture at 17 s and the spectra of the components: ethyl acetate (CH 3 COOC 2 H 5), ethanol (C 2 H 5 OH) , potassium acetate (CH 3 COOK), and KOH Frequency сm-1 Component 1022 CH 3 COOK 1050 CH 3 COOC 2 H 5 OH 1265 CH 3 COOC 2 H 5 CH 3 COOK 1380 Et. OAc 1414 CH 3 COOK 1553 CH 3 COOK
Reaction rates: ATR FTIR spectroscopy ATR FTIR spectra of the reaction of ethyl acetate hydrolysis, measured at 13 -300 s from the beginning of reaction at a temperature of 27, 4 °C ATR FTIR Raman T, °C k 103, М-1 с-1 Time dependence of the area under the band at 1265 cm-1 measured at 27. 4 °C and its approximation 25, 6 27, 4 27, 8 490± 10 540± 10 830± 10 480± 10 25 27, 4 89± 8 94± 8
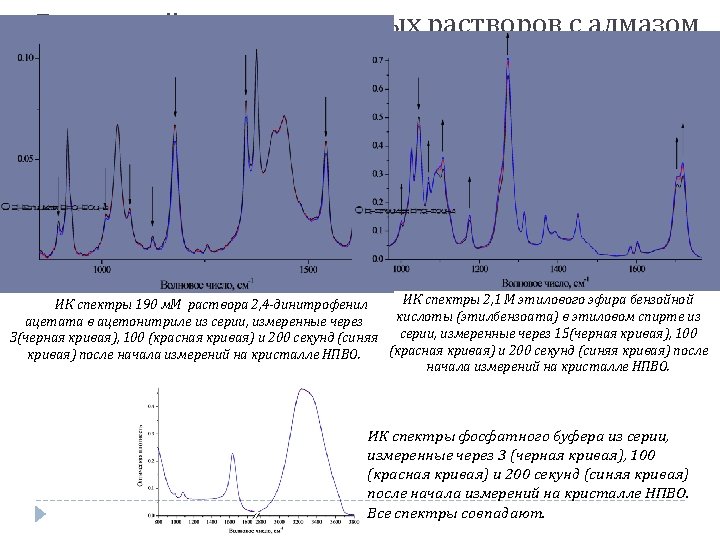
ATR FTIR time-dependence: liquid-in-liquid solution Concentration changes are obvious Solvent evaporation? Molar ratio: Ethanol / Benzoic ether = 5 Interaction with ATR crystal surface?
ATR FTIR time-dependence: solid-in-liquid solution Molar ratio: Acetonitrile / DNPA = 100 In case of reaction: product increasing rate = reagent decreasing rate
Reaction rates: ATR FTIR spectroscopy
Reaction rates: ATR FTIR spectroscopy 1264, 1300, 1359, 1393, 2800 -3100 cm-1 unchanged 607, 634, 785, 847, 916, 938, 1097, 1115, 1373 cm-1 – intensity 1045, 1238 cm-1 (skeletal) – intensity and width Ethyl acetate ordering (crystallization) on diamond surface
Conclusions Raman spectroscopy makes it possible to locally measure the rates of chemical processes (including enzymatic) in experiments with liquids and solids in the absence of specific requirements to reagents (substrates) Raman measurements make it possible to determine rate constants using variations in intensities of several spectral bands, so that the accuracy of calculations can be increased In the case of ATR FTIR measurements, the phase transition of liquids into quasi-crystalline state on the surface of ATR crystal is possible (even for diamond)
ATR FTIR spectroscopy of spontaneous and enzymatic hydrolysis Four reaction kinetics at 1380 см-1 ATR FTIR spectra of spontaneous reaction of 100 FTIR m. M spectra of ethyl acetate ATR ethyl acetate hydrolysis, measured at 11 -600 smeasured from the at 3, 100, and 200 s after beginning of reaction at the temperature of 23, 5 °C the beginning of reaction